Purpose
To reappraise macular pseudohole characteristics using spectral-domain optical coherence tomography (OCT) and characteristics and postoperative outcomes of macular pseudoholes.
Design
Retrospective, observational case series.
Methods
In this institutional study, 54 eyes with macular pseudohole were selected among 369 patients examined for an epiretinal membrane (ERM) by Cirrus spectral-domain OCT (Carl Zeiss Meditec) within a 2-year period. The diagnosis of macular pseudohole was based on the presence of a deep foveal pit, with verticalized edges and a macula thickened by the contraction of an ERM. All eyes underwent color fundus photography and spectral-domain OCT examination comprising a macular map, line raster scans, and en face images of the inner retinal surface. The main outcome measures were the morphologic description of the foveal profile in macular pseudoholes in relation to the pattern of the ERM contraction and the postoperative changes.
Results
In 24 eyes, the foveal pit had vertical, straight, smooth edges on the OCT scan corresponding to centripetal contraction of the ERM. Thirty other eyes exhibited some degree of stretching and cleavage of the foveal pit edge resulting from asymmetrical tangential traction of the ERM between multiple epicenters of contraction. Thirty-three patients underwent surgery, and their macular profile and visual acuity improved whatever their initial foveal profile.
Conclusions
The OCT profile of macular pseudohole varies according to the pattern of the causal ERM contraction. Macular pseudoholes with a stretched foveal edge respond to ERM peeling as positively as other eyes and should not be confounded with macular lamellar holes.
Macular pseudohole is a lesion that first was described using biomicroscopy and then was redefined by time-domain optical coherence tomography (OCT). The latter allowed the morphologic differences between macular pseudohole and lamellar macular holes to be clarified. The advent of ultra–high-resolution OCT and the subsequent current use of spectral-domain (SD) OCT have revealed new features of the macular profile of these cases and have reopened the debate about the differential diagnosis with lamellar macular hole. We therefore decided to restudy the morphologic features of macular pseudohole based on SD OCT images to characterize the OCT profile of these cases more clearly.
Methods
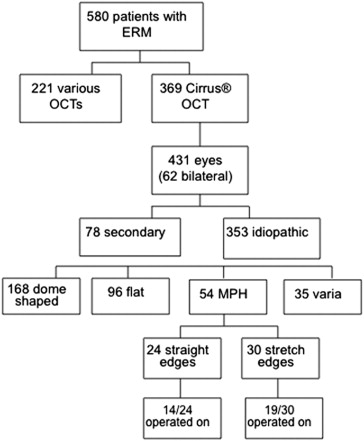
This retrospective study adhered to the principles of the Declaration of Helsinki. The Ethics Committee of the French Society of Ophthalmology found no argument against the medical and scientific rules of ethics conducted in this study, as accepted in France. We retrospectively reviewed the files and SD OCT scans of 580 consecutive patients referred to our ophthalmology department at Lariboisière Hospital, Paris, France, for surgery for an epiretinal membrane (ERM) from 2008 through 2009. Of these patients, 369 were examined with a Cirrus SD OCT device (Carl Zeiss Meditec, Dublin, California, USA). Sixty-two had bilateral ERM, and the files of 431 eyes therefore were studied. From these, we excluded 78 eyes with ERM in which the diseases was not idiopathic or in which an ERM was combined with other pathologic features (22 with vitreomacular traction syndrome, 7 with ERM after retinal detachment, 17 with high myopia, and 32 with miscellaneous conditions). We also excluded eyes with diabetic retinopathy, macular degeneration, high and medium myopia, a previous history of retinal detachment, or macular edema whatever its cause. Thus in the end, 353 eyes that had idiopathic ERM were available for this study ( Figure 1 ). Fifty-four (15.3%) had a macular pseudohole profile on OCT. One hundred sixty-eight had a dome-shaped profile (47.5%), 96 had a flat profile (27.2%), and 35 eyes did not display any of these 3 patterns. These latter cases exhibited various anomalies such as irregular folding of the inner retina, cystoid macular edema, subfoveal deposit, foveal herniation, and so forth. Color and red-free fundus photographs also were analyzed to rule out the possible presence of associated conditions.
All eyes underwent an OCT examination at the first presentation of the patient according to department practices, that is, including a macular cube of 6 × 6 mm that comprises 128 horizontal lines of 512 pixels, generating a 20-degree macular thickness map (macular cube), combined with 2 rasters of 5 vertical and horizontal line scans, each line comprising 1024 pixels enhanced by 4 summations. The distance between the raster lines was 75 μm.
The macular thickness map (overlaid on the fundus image and displayed as 3-dimensional thickness map) and horizontal and raster scans were studied independently by 2 readers (Y.A., A.G.), and a consensus was reached regarding the characterization of the macular profile, as well as the pattern of retinal folds on en face images. After independent review of the cases, only 3 were discordant and needed reconciliation. To make the diagnosis, all the lines of the cube and all line raster scans were reviewed. The diagnosis of macular pseudohole was based on the presence of a deep foveal pit, with verticalized edges and a macula thickened by the contraction of an ERM. We recorded the central macular thickness calculated by the software as the mean value of the central subfield, with a diameter of 1 mm. The central foveal point thickness (central foveal point thickness) was measured manually, by calipers, on the most central of the 5 horizontal raster scans by 2 different operators (Y.A.,R.T.). When the measures were discordant, the lowest value was retained.
In addition, advanced mode visualization enabled us to obtain an en face image of the inner retinal surface (coronal mode) of these cases, which was edited and analyzed. The OCT en face images on the Cirrus are axially integrated image data, referred to as slab images. The slab used followed the contour of the segmentation of the internal limiting membrane (ILM) plane, and the integration was preset within a range of 20 μm. For each A-scan, the image intensities are summed within the specified range. This function provides an excellent view of the irregularities of the macular surface. For each case, a comparison was made between OCT scan profiles, from the cube and from the raster scans on the one hand, and the en face OCT image on the other.
The presence of a complete posterior vitreous detachment on biomicroscopy was noted from the files of the patients or from the surgical report. Visual acuity (VA), as measured on a Snellen chart, was recorded and converted into logarithm of the minimal angle of resolution (logMAR) units. In the cases operated on for ERM, a postoperative OCT image also was analyzed at least 3 months after surgery. Main outcome measures were central macular thickness, the shape of the foveal pit on OCT scans, and initial VA and postoperative VA in patients who had undergone surgery.
Results
The 54 eyes with a macular pseudohole profile had, by definition, a foveal pit that was deeper than normal because of the thickening of the foveal edge. However, 2 different patterns emerged. In 1 group of 24 of 54 (44%) eyes, the foveal pit had vertical, straight, smooth edges on the OCT scan ( Figure 2 ), very comparable with the initial description of such eyes by Allen and Gass. In another group of 30 of 54 (56%) eyes, the foveal pit edge exhibited, at least on some of the scans, an incomplete cleavage between the inner and outer retina, which still were connected by stretched Henle fibers, producing a kind of eversion of the foveal edge. The shape of the edge often was asymmetric between the nasal and temporal or superior and inferior sides ( Figure 3 ). The inner segment and outer segment photoreceptor junction line was interrupted in none of the cases and on none of the 5 high-definition raster lines, spaced out by 75 μm. The results are shown in Table 1 .
| MPH with Straight Edge a | MPH with Stretched Edge a | |
|---|---|---|
| No. of patients (eyes) | 24 (24) | 28 (30) |
| Age (range), y | 70.75 (55 to 81) | 70.92 (51 to 84) |
| Gender, male/female | 10/14 | 5/23 |
| PVD, no. (%) | 19/24 (79.2) | 21/30 (70) |
| VA (range), logMAR | 0.34 (0.1 to 0.7) | 0.36 (0.1 to 1) |
| CMT (range), μm | 415.8 (283 to 615) | 440.2 (284 to 603) |
| CFPT (range) μm | 202.0 (125 to 346) | 206.0 (120 to 404) |
| Retinal folds on en face OCT, no. (%) | ||
| Radial | 18 (75) | 3 (10) |
| Complex | 4 (17) | 4 (13) |
| Smooth | 2 (8) | 23 (73) |
a No statistical differences between the values of the 2 groups.
These 2 different OCT scan profiles had their counterpart on en face OCT images, which exhibited 2 different patterns of retinal folds. In the group with straight foveal edges, 18 of 24 (75%) eyes had a characteristic pattern of a smooth ERM, contracted around the pseudohole, causing radial retinal folds that converged toward the edge of the membrane, thus revealing the centripetal forces of contraction generated by the membrane ( Figure 2 ). Four other eyes had a more complex pattern of folds, and in the 2 remaining eyes, the membrane was smooth with no visible folds. In the group with stretched edges combined with a partial cleavage between the inner and outer retina, 22 of 30 (73%) eyes displayed a characteristic pattern of multiple epicenters of contraction at the peripheral edge of the membrane, which resulted in an asymmetric distortion of the fovea and explained the eversion of the foveal edge on OCT scans ( Figure 3 ). In 4 eyes, the ERM was smooth, with few retinal folds, and in the 4 other eyes, the folds were more or less radial.
There were no statistical differences between the characteristics of macular pseudohole with straight or stretched edges, as shown in Table 1 . Central macular thickness (ie, mean retinal thickness in the central 1000 μm) increased similarly in both groups (415.8 μm in the straight edge group vs 440.2 μm in the stretched edge group; P = .11) for a normal thickness between 262 and 276 μm. Central foveal point thickness was 202.0 μm in the group with straight edges and 206.0 μm in the group with stretched edges ( P = .74). The normal central foveal point thickness for Cirrus OCT has not been published. However, central foveal point thickness was measured at 230 ± 21 μm or 223.8 ± 16.7 μm with the Spectralis OCT (Heidelberg Engineering, Heidelberg, Germany). Because the difference between the retinal thickness measured by the Spectralis and Cirrus OCT devices is between −12 and −14 μm, the normal central foveal point thickness given by the Cirrus should range from 210 to 212 μm. The central foveal point thickness of our patients therefore was not significantly different from normal. One noted the same proportion of complete posterior vitreous detachment cases in the 2 groups. No difference was found in VA: 0.34 versus 0.36 logMAR (Snellen equivalent, 20/40; P = .86).
Thirty-three of the 54 (51%) patients underwent surgery for ERM. They comprised 14 of the 24 eyes with straight foveal edges and 19 of the 30 eyes with stretched edges, that is, 58% and 63%, respectively. The VA of the remaining 11 cases was too good, that is, more than 20/40 or 20/32, and these patients reported few symptoms despite the OCT images. Therefore, they did not undergo surgery during the study period. Surgery was performed in 72% of patients by small transconjunctival sutureless incisions and consisted of core vitrectomy and ERM peeling, combined with additional specific Trypan blue staining, followed by ILM peeling in 23 of the 33 patients. Short-acting gas tamponade (20% SF 6 air) was used only in 4 cases (2 in each group) because of the intraoperative occurrence of a superior peripheral retinal tear.
The results of surgery were assessed at 3 months or more in all patients and are shown in Table 2 . Mean macular thickness decreased equally in the 2 groups, and postoperative thickness was similar (363.8 vs 345.3 μm; P = .12). The macular profile improved in all patients, with the disappearance or attenuation of the verticalization of the foveal edges ( Figure 4 and Supplemental Figure 1 , available at AJO.com ). Of the 19 patients with stretched and cleaved edges, the cleavage completely disappeared in 14 patients, was attenuated in 3 patients, and remained unchanged in the 2 remaining patients ( Figure 5 and Supplemental Figure 2 , available at AJO.com ). En face OCT images showed, in all patients, an alteration of the macular surface known as the dissociated optic nerve fiber layer, commonly seen after ILM peeling ( Figures 4 and 5 ). The mean VA of the 33 eyes that underwent surgery improved from 0.44 logMAR (Snellen equivalent, 20/50) before surgery to 0.28 logMAR (Snellen equivalent, 20/40) after surgery ( P = .001). VA improved in the same proportion in the 2 groups: from 0.41 to 0.23 logMAR (Snellen equivalent, 20/50 to 20/32) in the group of macular pseudohole with straight edges and from 0.47 to 0.32 logMAR (Snellen equivalent, 20/63 to 20/40) in the group with stretched edges. There was no significant difference between the 2 groups in preoperative or postoperative VA ( P = .44 and P = .65, respectively) and no difference in visual gain (−0.16 logMAR; P = .82). No postoperative complications occurred in this particular series of patients.
| MPH with Straight Edge a | MPH with Stretched Edge a | |
|---|---|---|
| Eyes operated on (no.) | 14 | 19 |
| Preoperative VA (range), logMAR | 0.41 (0.2 to 0.7) | 0.47 (0.1 to 1) |
| Postoperative VA (range), logMAR b | 0.23 (0 to 0.6) | 0.32 (0 to 1) |
| Preoperative VA ≥ 20/40, no. | 5 | 11 |
| Postoperative VA ≥ 20/40, no. b | 4 | 12 |
| Preoperative pseudophakic, no. | 4 | 2 |
| Postoperative pseudophakic, no. | 8 | 11 |
| Postoperative CMT (range), μm | 363.8 (324 to 404) | 345.3 (258 to 484) |
| Postoperative variation of CMT (range), μm | −76.86 (−15 to 245) | −107.21 (−26 to 156) |
| Postoperative CFPT (range), μm | 237.9 (136 to 373) | 238.9 (148 to 414) |
a No statistical differences between the values of the 2 groups.


