Purpose
To determine how evaluations of macular structures on spectral-domain optical coherence tomography compare with those of the optic disc and circumpapillary retinal nerve fiber layer (RNFL) in discriminating between highly myopic eyes with and without glaucoma.
Design
Retrospective, comparative study.
Methods
The appearances of ganglion cell layer and RNFL on Spectralis macular scans (Heidelberg Engineering) and optic disc on photographs were evaluated by 2 observers. The receiver operating characteristic regression was conducted for macular ganglion cell complex and circumpapillary RNFL measurements on RTVue-100 (Optovue).
Results
Ninety highly myopic eyes (−6.0 to −15.0 diopters; mean deviation [MD], −5.6 ± 5.1 dB) and 91 non–highly myopic eyes (1.0 to −5.5 diopters; MD, −4.9 ± 5.7 dB) were enrolled. In highly myopic eyes (<−6 diopters), the Cohen κ for qualitative decisions by observers was 0.363 for photographs and 0.946 for Spectralis macular scans, and observers’ evaluations of Spectralis macular scans were more accurate (94.5% and 94.5%, respectively; P < .0001) than their evaluations of photographs (71.4% and 80.2%, respectively). In the receiver operating characteristic regression analyses assessing the influences of age, sex, MD, and axial length, the better MD ( P = .002 to .016) and longer axial length ( P = .031 to .041) were associated significantly with diagnostic performances for all or some spectral-domain optical coherence tomography parameters. The receiver operating characteristic curves of average macular ganglion cell complex and circumpapillary RNFL thicknesses were comparable at low MD.
Conclusions
In high myopes, observers’ assessments of the spectral-domain optical coherence tomography macular scans may agree better and be more accurate than observers’ optic disc assessments. Glaucoma diagnostic performance of the macular ganglion cell complex may be less affected by axial length compared with that of circumpapillary RNFL.
Myopia affects approximately 1.6 billion people worldwide, and the prevalence is expected to increase, particularly in East Aisa, to 2.5 billion by the year 2020. Previous epidemiologic studies identified myopia, especially high myopia, as a risk factor for glaucoma developing, and the risk of glaucoma increases with increasing degree of myopia. Glaucomatous visual field (VF) defects in patients with high myopia may be worse, more likely to threaten fixation, and more likely to progress. Thus, myopic patients are thought to be at greater risk of decreased quality of vision over their lifetime, making early glaucoma screening crucial for these patients. However, it is often difficult to evaluate the myopic optic disc, which often shows deformed shapes—such as tilting, cyclotorsion, pale appearance, and shallow or large cups, or both—and large areas of peripapillary atrophy. Heidelberg Retinal Tomography (Heidelberg Engineering, Heidelberg, Germany) measurements of the optic disc shape are poor discriminators of glaucoma in myopic eyes.
Glaucomatous optic neuropathy results from damage to retinal ganglion cell axons within the optic nerve head. This leads to thinning of the retinal nerve fiber layer (RNFL), the ganglion cell layer, and the optic disc neuroretinal rim. Measurements of circumpapillary RNFL thickness can be made with optical coherence tomography (OCT), and prior studies have shown that decreased average circumpapillary RNFL thickness is a strong indicator of glaucoma. Unfortunately, circumpapillary RNFL thickness is not as useful in highly myopic eyes. This has been attributed to abnormal profiles of the circumpapillary RNFL in highly myopic eyes, including thinning and differences in peripapillary thickness distribution, compared with non–highly myopic eyes. Circumpapillary RNFL profile abnormalities become more prominent with the degree of myopia, axial length, and optic disc tilting.
Macular thickness measurements may well reflect retinal ganglion cell loss because more than 50% of retinal ganglion cell somas are located within the macula. Spectral-domain (SD) OCT allows reproducible thickness measurements of the 3 inner retinal layers, which include retinal ganglion cell somas and axons, also known as the ganglion cell complex. Macular ganglion cell complex parameters were shown to have equal diagnostic value as circumpapillary RNFL thickness measurements in the detection of glaucoma in eyes without high myopia. Importantly, the macular ganglion cell layer and RNFL have symmetrical shapes on cross-sectional images in nonglaucomatous eyes without high myopia, so loss of symmetry on SD OCT images can indicate unilateral damage to the macular ganglion cell layer and the RNFL. Also, because the macula lies along the globe’s optical axis, it may be that the macula is less affected by myopic globe elongation than the optic disc and peripapillary structures.
The current study examined the usefulness of macular retinal ganglion cell layer evaluations in glaucoma screening in highly myopic eyes. We first present SD OCT images illustrating macular symmetry in highly myopic eyes without glaucoma, even in the presence of optic disc and peripapillary deformations. We also present images that illustrate macular symmetry loss in highly myopic eyes with glaucoma. Interobserver agreement was assessed, as was the accuracy of SD OCT image evaluation on macular appearance. The agreement and accuracy also were compared with those of photographic optic disc evaluations used to distinguish between glaucomatous and nonglaucomatous eyes. Finally, we evaluated the influence of demographic and anatomic factors, including axial length, on the ability to detect glaucoma based on OCT measurements of the circumpapillary RNFL and the macular ganglion cell complex.
Methods
The study and data accumulation were carried out with approval from the Institutional Review Board and the Ethics Committee of Kyoto University Graduate School of Medicine, and the study was conducted in adherence to the tenets of the Declaration of Helsinki. Informed consent was obtained from subjects after the nature and possible consequences of study participation were explained. This was a retrospective, cross-sectional, case-control study.
Patients with a glaucoma diagnosis who visited the Glaucoma Service at Kyoto University Hospital between September 2009 and June 2010 were candidates for this study. All patients in the database already had undergone a comprehensive ophthalmic examination, including measurement of best-corrected visual acuity (5-m Landolt chart), refraction, keratometry, slit-lamp examination, axial length measurement (IOL Master 500; Carl Zeiss Meditec, Dublin, California, USA), Goldmann applanation tonometry, gonioscopy, indirect ophthalmoscopy, dilated slit-lamp optic nerve head examination, fundus photography, stereo disc photography (3-Dx simultaneous stereo disc camera; Nidek, Gamagori, Japan), red-free fundus photography (Heidelberg Retina Angiography 2; Heidelberg Engineering), and standard automated perimetry (SAP; Humphrey Visual Field Analyzer; Carl Zeiss Meditec) with the 24-2 Swedish interactive threshold algorithm standard program.
Inclusion criteria included best-corrected visual acuity of at least 20/20, normal open angle on gonioscopy, reliable VF results, and good-quality SD OCT images (clearly delineated macula and circumpapillary RNFL with acceptable signal strength). Patients with diabetes or vision-threatening neurologic disease (eg, pituitary tumor) and eyes with opaque media, intraocular disease (eg, retinal vein occlusion, macular degeneration, epiretinal membrane, retinitis pigmentosa), prior surgery, or pathologic myopia (eg, patchy chorioretinal atrophy, lacquer crack lesions, intrachoroidal cavitation, abrupt scleral curvature change temporal to the optic disc, choroidal neovascularization) were excluded from analyses. When both eyes of a patient were eligible, 1 eye was chosen randomly for the study.
Eyes were classified, according to the spherical equivalent of the refractive error, as either highly myopic (<−6.0 diopters [D]) or non–highly myopic. Eyes in each group were divided further into glaucomatous and nonglaucomatous subgroups. Eyes were assigned to the glaucoma group if the optic disc appeared glaucomatous on stereo disc photographs or if at least 1 localized RNFL defect was evident on red-free fundus photographs. These findings must have corresponded to glaucomatous VF defects, noted on SAP reports. Glaucomatous eyes were classified further as having early (≤−6 dB) or severe (>−6 dB) glaucoma, based on VF findings.
Eyes were assigned to the nonglaucomatous group only if they lacked any glaucomatous appearance of the optic disc, any visible RNFL defect on red-free RNFL photographs, or any VF defect on 2 reliable SAP examinations. Eyes also had to have an IOP of 21 mm Hg or less with no history of increased IOP and no family history of glaucoma in a first-degree relative. Some eyes showed an enlarged blind spot associated with large peripapillary atrophy. These eyes were classified as the nonglaucomatous group.
Eligibility was determined by 3 glaucoma specialists (M.H., H.O.I., T.A.) who evaluated optic disc appearance on stereo disc photographs and RNFL defects on red-free fundus photographs. Evaluators were masked to all other patient and ocular data, and an eye was excluded from analyses if a consensus could not be reached. A glaucomatous appearance of the optic disc was defined as the clear presence of notching or neuroretinal rim thinning in the inferotemporal region, the superotemporal region, or both such that the inferior-superior-nasal-temporal rule was not fulfilled. A localized RNFL defect was classified as glaucomatous when its width at a 1-disc diameter distance from the edge of the disc was larger than a major retinal vessel, it diverged from the edge of the optic disc in an arcuate or wedge shape, and it could not be explained by any cause other than glaucoma.
Visual Field Testing
VF results were considered reliable if they had a fixation loss of 15% or less, a false-positive rate of 15% or less, and a false-negative rate of 15% or less. Anderson-Patella’s criteria were used to define abnormal VF results on SAP and included the following: glaucoma hemifield test results outside normal limits, pattern standard deviation probability of less than 5%, or a cluster of 3 or more adjacent nonedge points in typical glaucomatous locations that did not cross the horizontal meridian, all of which were depressed on the pattern deviation plot at a P < .05, one of which was depressed at a P < .01 level, confirmed on 2 reliable consecutive tests. We excluded eyes with VF defects that did not correspond to typical glaucomatous optic disc appearance and any atypical nonglaucomatous VF defects, such as a superotemporal peripheral defect or a generalized reduction.
Macular Assessment by Spectral-Domain Optical Coherence Tomography
The Spectralis HRA+OCT system (Heidelberg Engineering) produces clear retinal layer images in which the ganglion cell layer and RNFL boundaries are clearly distinguishable ( Figure 1 ). These were used to evaluate the appearance of single retinal layers (eg, ganglion cell layer, RNFL) in the macula. This instrument uses confocal laser scanning ophthalmoscopy, which enables real-time 3-dimensional tracking of eye movements. The eye-tracking system allows accurate averaging of up to 100 B-scans (7-μm axial resolution) acquired at an identical location of interest on the retina, which efficiently reduces speckle noise. However, the software for this instrument does not automatically examine the macular ganglion cell complex. To measure the circumpapillary RNFL and macular ganglion cell complex thickness, the RTVue-100 system (software version 4.0.0.143; Optovue, Fremont, California, USA) was used, which allows reproducible automated measurement of these structures.
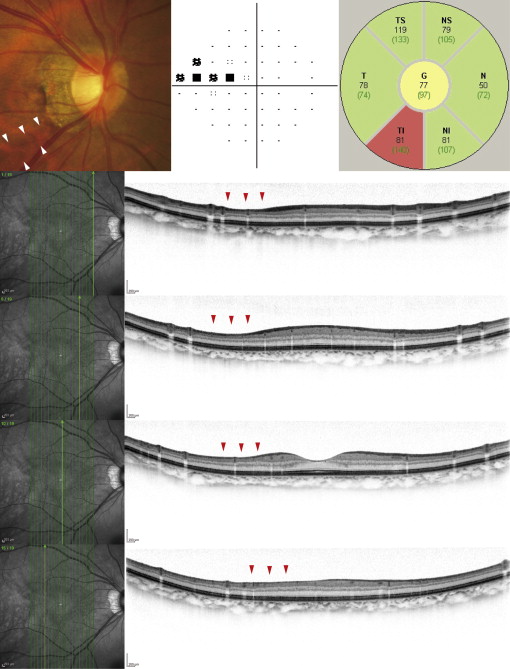
Spectralis Imaging of Macular Layer Structures
Each B-scan consists of 1536 A-scans, providing a digital transverse sampling resolution of 5 μm per pixel. For macular imaging, we performed 19 vertical scans (approximately 9 mm in length) at intervals of 240 μm ( Figure 1 ). For circumpapillary RNFL imaging, we performed a circle scan, consisting of 1536 A-scans, with a diameter of 3.46 mm centered on the optic disc. Fifty scans were acquired along each scan line and were averaged.
Interobserver Agreement and Accuracy of Optic Disc and Macular Evaluations
Stereo disc photographs or color fundus photographs and Spectralis OCT macular images were evaluated separately and independently by 2 glaucoma specialists (SM, MN) in a masked fashion. For photographic evaluations, 2 observers classified each eye into 1 of following 3 categories: nonglaucomatous, glaucomatous, or hard to determine. The hard to determine classification was used only if a glaucomatous-or-nonglaucomatous decision could not made because of severe myopic optic disc deformation.
Macular appearance was evaluated on Spectralis images, as described previously. Briefly, evaluators were asked to compare macular ganglion cell layer and RNFL appearance in the superior and inferior hemispheres for symmetry of shape ( Figure 1 ). The evaluators classified the eyes as not glaucomatous (normal appearance of the macular ganglion cell layer and RNFL with symmetry in the 2 hemispheres), glaucomatous (asymmetrical or diminished macular ganglion cell layer and RNFL), or hard to determine.
Agreement between evaluators was considered to occur if both observers classified the eye as glaucomatous or nonglaucomatous. A disagreement occurred if the classifications did not agree or when both observers could not decide (hard to determine). Classification results were judged to be correct when eyes with a glaucoma diagnosis were classified as glaucomatous and eyes without a glaucoma diagnosis were classified as nonglaucomatous. Classification results were deemed incorrect when the eyes with glaucoma were classified as nonglaucomatous and vice versa. Eyes that were classified as hard to determine also were regarded to be incorrectly classified.
Spectral-Domain Optical Coherence Tomography Measurements
The RTVue-100 SD OCT system has a depth resolution of approximately 5 μm. Imaging was performed by a well-trained examiner after pupillary dilatation, with the examiner rejecting any scans that had motion artifacts (discontinuous jump), poor centration, or poor focus. Images outside of the acquisition frame also were rejected, and only good-quality images (signal strength index [SSI] scores ≥40.0) were accepted, as suggested by the manufacturer.
Circumpapillary RNFL and macular ganglion cell complex thickness were calculated automatically by the RTVue-100’s built-in software. To measure circumpapillary RNFL thickness, the RNFL 3.45 scan mode was used. In this mode, 4 circular scans (1024 A-scans/scan) are acquired 3.45 mm from the center of the optic disc and the results are averaged. To measure macular ganglion cell complex thickness, we used the scan mode for ganglion cell complex analysis, which acquires 14 928 A-scans over a 7-mm square area in 0.58 seconds with 15 vertical scans collected at 0.5-mm intervals. The center of the ganglion cell complex scan was shifted 1.0 mm temporally to improve sampling of the temporal periphery. After scanning in the ganglion cell complex mode, the RTVue-100 software automatically calculates the mean thickness of the ganglion cell complex within the central 6-mm diameter area of the macula.
The focal loss volume and global loss volume, which are new RTvue-100 software ganglion cell complex scan parameters, also were computed. The focal loss volume is the integral of deviation in areas of significant focal ganglion cell complex loss, and the global loss volume is the sum of negative fractional deviations over the entire scan area. The quality of ganglion cell complex and circumpapillary RNFL segmentation in all B-scans was checked with the criteria of Ishikawa and associates. Eyes with segmentation failures were excluded from analyses.
Statistical Analyses
Data for nonglaucomatous, early glaucoma, and severe glaucoma groups were compared using an analysis of variance, followed by the Scheffé test as a post hoc comparison. The Fisher exact test was used to evaluate gender distribution differences between highly and non–highly myopic groups and between nonglaucomatous, early glaucomatous, and severely glaucomatous groups. The Cohen κ was computed to evaluate interobserver agreement in glaucoma versus nonglaucoma classifications in eyes with and without high myopia (<0 indicated no agreement, 0 to 0.20 indicated slight agreement, 0.21 to 0.40 indicated fair agreement, 0.41 to 0.60 indicated moderate agreement, 0.61 to 0.80 indicated substantial agreement, and 0.81 to 1.00 indicated almost perfect agreement). The McNemar test was used to evaluate the statistical significance of differences in the number of eyes classified correctly, based on photographs or OCT images. The above statistical analyses were performed using PASW Statics software (version 17.0; SPSS, Inc, Chicago, Illinois, USA).
A receiver operating characteristic regression analysis was carried out according to the methods of Alonzo and Pepe and of Janes and associates. We considered the following receiver operating characteristic regression model:
Re ceiver operating characteristic ( t ) = ϕ [ α 0 + α 1 ϕ – 1 ( t ) + α 2 Age + α 3 Sex + α 4 MD + α 5 AL + α 6 SSI ]
Stay updated, free articles. Join our Telegram channel

Full access? Get Clinical Tree


