Purpose
To investigate the choroidal thickness/volume of eyes with reticular pseudodrusen using high-penetration swept-source optical coherence tomography (SS-OCT) and to evaluate the choroidal vasculature changes using en face images.
Design
Prospective cross-sectional study.
Methods
Thirty-eight eyes with reticular pseudodrusen and 14 normal eyes were studied with prototype SS-OCT. Eyes with reticular pseudodrusen were classified into 3 subgroups: eyes without late age-related macular degeneration (AMD) (Group1), eyes with neovascular AMD (Group2), and eyes with geographic atrophy (Group3). Mean regional choroidal thickness/volume measurements were obtained by 3-dimensional (3D) raster scanning. The choroidal vascular area was measured using en face images reconstructed from a 3D SS-OCT data set.
Results
Mean age and axial length did not differ between eyes with reticular pseudodrusen and normal eyes. The mean choroidal thickness and volume of each sector was significantly reduced in eyes with reticular pseudodrusen compared with normal eyes ( P < .020 for all). Mean choroidal thickness and volume of each area showed no significant difference between the 3 groups; however, most of them showed decreased thickness compared with normal eyes. En face images through the choroid revealed narrow and sparse choroidal vessels in eyes with reticular pseudodrusen. The area of choroidal vasculature was significantly reduced in eyes with reticular pseudodrusen compared with normal eyes ( P = .037).
Conclusions
In eyes with reticular pseudodrusen, macular choroidal thickness/volume was reduced regardless of choroidal neovascularization/geographic atrophy. Thinned vessels in the choroid suggest choroidal involvement in the pathogenesis of reticular pseudodrusen.
Reticular pseudodrusen were first identified using blue-light fundus photography in 1990. Arnold and associates described reticular pseudodrusen as a yellowish interlacing network of oval-shaped or roundish lesions with a diameter of 125–250 μm that were visible by red-free fundus photography and infrared scanning-laser ophthalmoscopy (SLO). Recently, reticular pseudodrusen have been recognized as an additional distinctive morphologic feature observed in age-related macular degeneration (AMD). Furthermore, existing evidence suggests that reticular pseudodrusen are associated with a high risk of progression to late AMD and reduction in visual function. The development of imaging methods, such as SLO and optical coherence tomography (OCT), has led to additional insight into its pathogenesis.
Several researchers have reported impaired choroidal filling on indocyanine green angiography (IA) in eyes with reticular pseudodrusen. It has been reported that the arrangement and pattern of reticular pseudodrusen may be related to the choroidal stroma and the choroidal vasculature. A histologic study showed that the number of choroidal blood vessels was decreased in an eye with reticular pseudodrusen. These findings suggest that the mechanism underlying the pathogenesis of reticular pseudodrusen may involve changes in the choroidal vasculature.
Imaging of the choroid with commercially available OCT does not allow visualization of the entire choroidal structure, owing to its low penetration and high backscattering at the level of the retinal pigment epithelium (RPE). However, since Spaide and associates introduced enhanced depth imaging OCT(EDI-OCT), an increasing number of investigators have studied choroidal thickness in healthy and diseased eyes. In fact, using the EDI-OCT technique, several researchers have reported that the choroidal thickness was decreased in eyes with reticular pseudodrusen compared with eyes without them. However, EDI-OCT is usually coupled with multiple scan averaging to achieve high contrast and low speckle noise, resulting in less detailed raster scan images. For this reason, previous studies have focused on choroidal thickness at several measurement points.
Recently, other investigators measured the choroidal thickness by using OCT at a longer wavelength. In these more recent studies, higher penetration of the OCT probe light, which uses a center wavelength of approximately 1000 nm instead of the current OCT probing light operated at approximately 800 nm, allows the visualization of the entire choroid without resorting to the EDI system or multi-averaging. Swept-source OCT (SS-OCT) at a longer wavelength is characterized by a high-speed scan rate and a relatively low sensitivity roll-off vs depth compared with the spectral-domain OCT, and it allows a 3-dimensional (3D) high-contrast image of the choroid to be captured.
In this study, we scanned the whole macular area in eyes with reticular pseudodrusen by high-penetration SS-OCT, using a 3D raster scan protocol, and produced a choroidal thickness map of the macular area. By applying the sectors described in the Early Treatment Diabetic Retinopathy Study (ETDRS) to this map, we measured the mean choroidal thickness and volume in each sector. In addition, we evaluated the changes in the choroidal vasculature using en face SS-OCT–derived images.
Methods
All investigations adhered to the tenets of the Declaration of Helsinki, and this study was approved by the institutional review board and the ethics committee of Kyoto University Graduate School of Medicine. After the nature and possible consequences of the study were explained, written informed consent was obtained from all the participating subjects.
Subjects
For this prospective cross-sectional study, we recruited patients with reticular pseudodrusen who visited the Macular Service at Kyoto University Hospital, Kyoto, Japan, between July 1, 2010 and February 14, 2013, as well as age-matched normal controls. To be included in the current study, the patients had to be 50 years of age or above.
All of the patients had already been diagnosed with reticular pseudodrusen based on the appearance of reticular patterns according to at least 2 of the following imaging modalities: color fundus photography (blue channel images), infrared reflectance (IR) imaging, fundus autofluorescence (FAF), spectral-domain OCT (SD-OCT), and IA. Eyes with high myopia (axial length ≥26.0 mm) and eyes with other macular abnormalities (eg, idiopathic choroidal neovascularization, angioid streaks, other secondary choroidal neovascularization, central serous chorioretinopathy, epiretinal membranes, or retinal arterial macroaneurysms); any history or signs of retinal surgery, including laser treatment and photodynamic therapy; or evidence of glaucoma or high intraocular pressure (≥22 mm Hg) were also excluded from this study. Subjects with systemic diseases or conditions that might affect the choroidal thickness were also excluded, such as those with diabetes mellitus or malignant hypertension. Eyes whose fellow eyes had any sign of AMD including drusen were excluded from normal controls.
Eyes with reticular pseudodrusen were classified into 3 subgroups: eyes without late AMD (neovascular AMD and geographic atrophy) (Group 1), eyes with neovascular AMD (Group 2), and eyes with geographic atrophy (Group 3). Neovascular AMD was characterized by choroidal neovascularization (CNV) detected by fluorescein angiography (FA) and IA. Geographic atrophy was detected, using color fundus photography as a sharply delineated area (at least 175 μm in diameter) of hypopigmentation, depigmentation, or apparent absence of the RPE due to which the choroidal vessels were clearly visible.
All subjects underwent a comprehensive ocular examination, including measurement of best-corrected visual acuity (BCVA) with a 5-m Landolt chart, intraocular pressure, autorefractometry (ARK1; Nidek, Gamagori, Japan), axial length measurement using ocular biometry (IOL Master; Carl Zeiss Meditec, Jena, Germany), slit-lamp examination, color fundus photography (TRC-NW8F; Topcon Corp, Tokyo, Japan), and prototype SS-OCT. All patients with macular complications underwent simultaneous FA and IA using HRA+OCT (Spectralis; Heidelberg Engineering, Heidelberg, Germany).
Swept-Source Optical Coherence Tomography System and Scanning Protocols
We used an SS-OCT prototype system (Topcon, Tokyo, Japan) with an axial scan rate of 100 000 Hz operated in the 1-μm wavelength region. The details of this system were described elsewhere.
SS-OCT examinations were performed by trained examiners after pupil dilation. First, horizontal and vertical line scans (12 mm) through the fovea were obtained, and ∼50 B-scan images were averaged to reduce speckle noise. Second, a 3D imaging data set was acquired for each subject with a raster scan protocol of 512 (horizontal) × 128 (vertical) A-scans per data set (total: 65 536 axial scans/volume) in 0.8 s. Each 3D scan covered an area of 6 × 6 mm centered on the fovea, which was confirmed by an internal-fixation and fundus camera integrated in the instrument. To reduce speckle noise, each image was averaged by applying the weighted moving average from 3 consecutive images. Owing to the invisible scanning light and high-speed scanning, eye movement during the 3D scan was minimal.
Choroidal Thickness and Volume Measurement Protocol
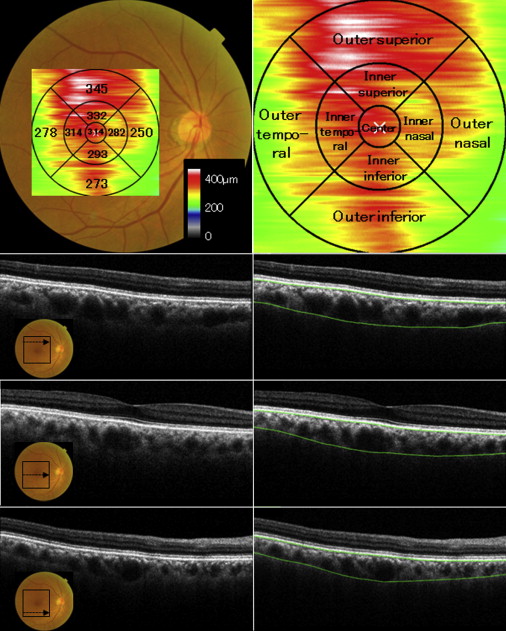
The choroidal thickness was measured as the distance between the Bruch membrane (or the outer border of the RPE–Bruch membrane complex) and the chorioscleral interface ( Figure 1 ). In each image of the 3D data set, both lines were determined manually by a trained ophthalmologist who was masked to the diagnosis, classification, or angiographic findings. Automated built-in calibration software was used to determine the distance between the 2 lines. From all 128 images of each 3D data set, a choroidal thickness map of 6 × 6 mm was created. False color was determined starting from a cool color and progressing to a warm color, at the range of 0–500 μm. After the choroidal thickness map was created, the ETDRS sectors were applied to it ( Figure 1 ). First, the central fovea on each image was manually registered, if necessary, to coincide with the central circle on the ETDRS segmentation diagram. The mean thickness of each sector was measured in the “center” sector within 0.5 mm from the center of the fovea, in 4 “inner ring” sectors (nasal, superior, temporal, and inferior) 0.5–1.5 mm from the center of the fovea, in 4 “outer ring” sectors (nasal, superior, temporal, and inferior) 1.5–3 mm from the center of the fovea, and as a “whole” within 3 mm from the center of the fovea.
In B-scans where it was difficult to identify the whole outer choroid, 7-15 points where the chorioscleral interface could be identified were chosen and connected to create a segmentation line. After creating segmentation lines in all 128 B-scans, the choroidal thickness map was checked. If the thickness differed remarkably between adjoining B-scans, the segmentation lines of the B scans were reexamined and corrected as required.
To examine whether the localization of reticular pseudodrusen affected the focal choroidal thickness, area of reticular pseudodrusen was assessed for Group 1 eyes using IR images. With respect to each ETDRS sector, the eyes were divided into 2 groups according to whether reticular pseudodrusen covered more than half of the area or not. The mean choroidal thickness of each ETDRS sector was compared between the 2 groups. The area of reticular pseudodrusen was assessed using the built-in software of HRA-2 (Heidelberg Engineering, Heidelberg, Germany). The data obtained were analyzed to determine the association between the areas covered by reticular pseudodrusen and mean macular choroidal thickness.
Measurement of Choroidal Vascular Area Using En Face Images
En face images were automatically reconstructed from a 3D data set using software developed by Topcon Corporation, which flattened the images at the level of Bruch membrane. Each en face image was created by averaging the consecutive images of the range of 7 μm. To analyze the area of choroidal vasculature, the en face image was adopted at the intermediate level between the Bruch membrane and the deepest site of the chorioscleral interface on the horizontal B-scan image through the fovea. To measure the area of choroidal vasculature of each adopted image, Image J software (National Institutes of Health, Bethesda, Maryland, USA) was used. In Image J, the command path of Image > Adjust > Threshold > Auto was used to differentiate the vascular area from the nonvascular area. To measure the vascular area, the command path of Analyze > Measure was used. If the adopted image contained the chorioscleral border, the image was trimmed minimally so that it contained the choroidal area only. Then, the ratio of choroidal vascular area to total area was calculated.
Statistical Analysis
Statistical analysis was performed using SPSS statistical software (version 20; SPSS Inc, Chicago, Illinois, USA). All values are presented as mean ± standard deviation (SD). We used the unpaired t test or Welch’s t test to compare the data between 2 groups with normal distribution. The Mann-Whitney U test was used to compare data between 2 groups in which normal distributions were not verified. To compare the data between 3 groups, 1-way analysis of variance and the Tukey-Kramer test were used. P values less than .05 were considered to be statistically significant.
Results
In this study, 75 eyes of 44 patients with reticular pseudodrusen were examined. Among them, 12 eyes were excluded because of poor image quality (owing to unstable fixation or media opacity). Thus, the images obtained for 63 eyes from 38 patients were suitable for analysis. If both eyes were eligible for inclusion, 1 eye was selected randomly. Finally, 38 eyes from 38 patients (19 men and 19 women) with reticular pseudodrusen were included in this study. Fourteen normal eyes in 14 subjects (6 men and 8 women) were included as controls. The male-to-female ratio was not significantly different between the reticular pseudodrusen group and normal group ( P = .648, χ 2 test). The ages of the subjects ranged from 67–91 years (mean ± SD, 79.4 ± 6.6 years) for patients with reticular pseudodrusen and from 69-87 years (mean ± SD, 77.1 ± 5.4 years) for normal controls ( P = .241, unpaired t test). The axial length ranged from 21.8-25.3 mm (mean ± SD, 23.4 ± 0.9 mm) in eyes with reticular pseudodrusen and 22.1-24.8 mm (mean ± SD, 23.3 ± 0.7 mm) in normal eyes ( P = .582, unpaired t test). The mean visual acuity (logarithm of minimal angle of resolution; logMAR) was 0.24 ± 0.38 in the reticular pseudodrusen group and −0.01 ± 0.12 in the normal group, and eyes with reticular pseudodrusen had significantly poorer visual acuity ( P < .001, Welch’s t test) ( Table 1 ).
| Eyes With Reticular Pseudodrusen (n = 38) | Normal Controls (n = 14) | P | |
|---|---|---|---|
| Male-to-female ratio | 19/19 | 6/8 | .648 a |
| Mean age (y) | 79.4 ± 6.6 | 77.1 ± 5.4 | .241 b |
| Mean axial length (mm) | 23.4 ± 0.9 | 23.3 ± 0.7 | .582 b |
| Visual acuity (logMAR) | 0.24 ± 0.38 | −0.01 ± 0.12 | <.001 c |
The mean choroidal thickness and volume of each ETDRS sector was significantly reduced in eyes with reticular pseudodrusen compared with normal eyes ( P < .020 for all, unpaired t test or Welch’s t test) ( Figures 2–4 , Table 2 ). The central choroidal thickness and volume (1 mm diameter) in eyes with reticular pseudodrusen were 143.4 ± 50.2 μm and 0.11 ± 0.04 mm 3 , respectively, which were significantly smaller than those in normal eyes (234.3 ± 75.8 μm and 0.18 ± 0.06 mm 3 ; P < .001, Welch’s t test). Whole macular choroidal thickness and volume (6 mm diameter) in eyes with reticular pseudodrusen were 134.4 ± 39.8 μm and 3.80 ± 1.13 mm 3 , respectively, which were significantly smaller than those in normal eyes (201.2 ± 67.8 μm and 5.69 ± 1.92 mm 3 ; P = .003, Welch’s t test).
| Area a | Mean Choroidal Thickness (μm) | Mean Choroidal Volume (mm 3 ) | P | ||
|---|---|---|---|---|---|
| Eyes With Reticular Pseudodrusen (n = 38) | Normal Eyes (n = 14) | Eyes With Reticular Pseudodrusen (n = 38) | Normal Eyes (n = 14) | ||
| Center | 143.4 ± 50.2 | 234.3 ± 75.8 | 0.11 ± 0.04 | 0.18 ± 0.06 | <.001 b |
| Inner temporal | 150.4 ± 47.1 | 228.6 ± 70.5 | 0.24 ± 0.07 | 0.36 ± 0.11 | <.001 c |
| Inner superior | 144.0 ± 48.2 | 230.7 ± 79.7 | 0.23 ± 0.08 | 0.36 ± 0.13 | .001 b |
| Inner nasal | 127.5 ± 47.1 | 211.8 ± 74.5 | 0.20 ± 0.07 | 0.33 ± 0.12 | .001 b |
| Inner inferior | 136.2 ± 51.1 | 211.2 ± 72.2 | 0.21 ± 0.08 | 0.33 ± 0.11 | <.001 c |
| Outer temporal | 145.7 ± 40.0 | 197.8 ± 65.2 | 0.77 ± 0.21 | 1.05 ± 0.35 | .012 b |
| Outer superior | 142.3 ± 42.9 | 223.0 ± 77.5 | 0.75 ± 0.23 | 1.18 ± 0.41 | .002 b |
| Outer nasal | 106.2 ± 35.6 | 168.1 ± 70.5 | 0.56 ± 0.19 | 0.89 ± 0.37 | .007 b |
| Outer inferior | 136.2 ± 43.6 | 188.0 ± 67.1 | 0.72 ± 0.23 | 1.00 ± 0.36 | .016 b |
| Whole macula | 134.4 ± 39.8 | 201.2 ± 67.8 | 3.80 ± 1.13 | 5.69 ± 1.92 | .003 b |
a Center = within 0.5 mm from the foveal center; Inner = 0.5-1.5 mm from the foveal center; Outer = 1.5–3.0 mm from the foveal center; Whole = within 3.0 mm from the foveal center.
Eyes with reticular pseudodrusen were classified into 3 subgroups: eyes without late AMD (Group 1, n = 20), eyes with neovascular AMD (Group 2, n = 10), and eyes with geographic atrophy (Group 3, n = 8). The mean age was 77.6 ± 6.0, 81.8 ± 7.9, and 81.1 ± 5.9 years in Group 1, Group 2, and Group 3, respectively ( P = .183, 1-way analysis of variance; Supplemental Table 1 , available at AJO.com ). The mean axial length was 23.2 ± 0.9, 23.6 ± 0.7, and 23.8 ± 1.2 mm in Group 1, Group 2, and Group 3, respectively. ( P = .268, 1-way analysis of variance; Supplemental Table 1 ). The mean age and mean axial length of each subgroup were not statistically different compared with normal eyes ( Table 3 ).
| Group 1 a (n = 20) | Group 2 a (n = 10) | Group 3 a (n = 8) | Normal (n = 14) | P b | P c | P d | |
|---|---|---|---|---|---|---|---|
| Mean age | 77.6 ± 6.0 | 81.8 ± 7.9 | 81.1 ± 5.9 | 77.1 ± 5.4 | .813 | .094 | .117 |
| Mean axial length (mm) | 23.2 ± 0.9 | 23.6 ± 0.7 | 23.8 ± 1.2 | 23.3 ± 0.7 | .790 | .290 | .227 |
a Group 1: eyes with reticular pseudodrusen and without late age-related macular degeneration (AMD); Group 2: eyes with reticular pseudodrusen and exudative AMD; Group 3: eyes with reticular pseudodrusen and geographic atrophy.
b Comparison between Group 1 and normal eyes by unpaired t test or Welch’s t test.
c Comparison between Group 2 and normal eyes by unpaired t test or Welch’s t test.
d Comparison between Group 3 and normal eyes by unpaired t test or Welch’s t test.
The mean choroidal thickness and volume of each sector in the ETDRS showed no significant difference among Group 1, Group 2, and Group 3; however, most of them showed decreased thickness compared with normal eyes ( Figures 1–4 , Table 4 , Supplemental Table 2 , available at AJO.com ). Central choroidal thickness and volume were 138.1 ± 52.2 μm and 0.11 ± 0.04 mm 3 in Group 1, 148.0 ± 53.1 μm and 0.12 ± 0.04 mm 3 in Group 2, and 151.2 ± 45.9 μm and 0.12 ± 0.04 mm 3 in Group 3, which were smaller than those of normal eyes ( P < .001, P = .005, P = .011, respectively, unpaired t test). The mean whole macular choroidal thickness and volume was 129.3 ± 40.6 μm and 3.66 ± 1.15 mm 3 in Group 1, 135.8 ± 46.3 μm and 3.84 ± 1.31 mm 3 in Group 2, and 145.4 ± 30.8 μm and 4.11 ± 0.87 mm 3 in Group 3, which were smaller than that of normal eyes ( P = .002, Welch’s t test, P = .015, unpaired t test, P = .016, Welch’s t test, respectively).
| Area a | Mean Choroidal Thickness (μm) | Mean Choroidal Volume (mm 3 ) | P c | P d | P e | ||||||
|---|---|---|---|---|---|---|---|---|---|---|---|
| Group 1 b (n = 20) | Group 2 b (n = 10) | Group 3 b (n = 8) | Normal (n = 14) | Group 1 b (n = 20) | Group 2 b (n = 10) | Group 3 b (n = 8) | Normal (n = 14) | ||||
| Center | 138.1 ± 52.2 | 148.0 ± 53.1 | 151.2 ± 45.9 | 234.3 ± 75.8 | 0.11 ± 0.04 | 0.12 ± 0.04 | 0.12 ± 0.04 | 0.18 ± 0.06 | <.001 | .005 | .011 |
| Inner temporal | 145.9 ± 49.7 | 149.6 ± 47.1 | 162.6 ± 44.0 | 228.6 ± 0.5 | 0.23 ± 0.08 | 0.23 ± 0.07 | 0.26 ± 0.07 | 0.36 ± 0.11 | <.001 | .006 | .027 |
| Inner superior | 138.8 ± 54.3 | 145.5 ± 46.4 | 155.0 ± 36.1 | 230.7 ± 79.7 | 0.22 ± 0.09 | 0.23 ± 0.07 | 0.24 ± 0.06 | 0.36 ± 0.13 | <.001 | .006 | .007 |
| Inner nasal | 121.2 ± 49.2 | 130.9 ± 53.4 | 139.0 ± 34.5 | 211.8 ± 74.5 | 0.19 ± 0.08 | 0.21 ± 0.08 | 0.22 ± 0.05 | 0.33 ± 0.12 | <.001 | .008 | .006 |
| Inner inferior | 129.2 ± 49.0 | 141.0 ± 61.7 | 147.7 ± 45.3 | 211.2 ± 72.2 | 0.20 ± 0.08 | 0.22 ± 0.10 | 0.23 ± 0.07 | 0.33 ± 0.11 | <.001 | .021 | .037 |
| Outer temporal | 140.7 ± 39.2 | 144.9 ± 43.9 | 159.2 ± 38.4 | 197.8 ± 65.2 | 0.75 ± 0.21 | 0.77 ± 0.23 | 0.84 ± 0.20 | 1.05 ± 0.35 | .008 | .037 | .143 |
| Outer superior | 139.2 ± 44.8 | 139.6 ± 46.6 | 153.4 ± 35.9 | 223.0 ± 77.5 | 0.74 ± 0.24 | 0.74 ± 0.25 | 0.81 ± 0.19 | 1.18 ± 0.41 | .002 | .006 | .010 |
| Outer nasal | 101.0 ± 36.6 | 107.5 ± 42.4 | 117.7 ± 22.9 | 168.1 ± 70.5 | 0.53 ± 0.19 | 0.57 ± 0.22 | 0.62 ± 0.12 | 0.89 ± 0.37 | .004 | .025 | .025 |
| Outer inferior | 130.4 ± 38.6 | 141.8 ± 62.4 | 143.6 ± 28.1 | 188.0 ± 67.1 | 0.69 ± 0.20 | 0.75 ± 0.33 | 0.76 ± 0.15 | 1.00 ± 0.36 | .009 | .102 | .044 |
| Whole macula | 129.3 ± 40.6 | 135.8 ± 46.3 | 145.4 ± 30.8 | 201.2 ± 67.8 | 3.66 ± 1.15 | 3.84 ± 1.31 | 4.11 ± 0.87 | 5.69 ± 1.92 | .002 | .015 | .016 |
Stay updated, free articles. Join our Telegram channel

Full access? Get Clinical Tree


