Purpose
To evaluate the learning curve and fatigue effect of flicker defined form (FDF) perimetry.
Design
Prospective cross-sectional study.
Material and Methods
One hundred forty-one eyes of 75 healthy subjects were included in the study. Every subject was measured 3 times on 3 different days within 3 months. Differences among the tests were analyzed for mean sensitivity (MS), mean deviation (MD), pattern standard deviation (PSD), reliability indices, test duration, and test points <5% and <0.5% in 75 right eyes on the basis of linear mixed models for repeated measurements. To assess the effect of fatigue, differences of MS, MD, and PSD values between 66 left and right eyes were evaluated regarding alterations between these 3 examinations.
Results
After 3 test sessions, significant improvements were found in MS and MD among all 3 tests ( P ≤ .01), and in PSD between test 1 and test 3 ( P = .02). Test duration decreased significantly between tests 1 and 3 ( P = .01); fixation-loss errors decreased significantly between tests 2 and 3 and between tests 1 and 3 ( P = .02, respectively). Test points with p < 0.5% decreased significantly between tests 1 and 2 ( P = .04) and 1 and 3 ( P = .01) When comparing both eyes, MS, MD, and PSD were significantly better in first than in second eyes examined.
Conclusions
There exist significant learning and fatigue effects for repeated flicker defined form perimetry. For good and reliable results on FDF perimetry, at least 3 tests should be performed in an individual. Between the tests of both eyes, a rest should be offered.
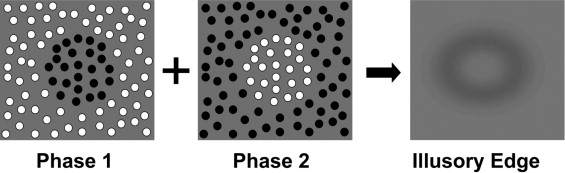
Visual field testing is essential for glaucoma diagnosis and monitoring. For several decades, standard automated perimetry (SAP) has been the gold standard for visual field testing. This method allows clinicians to measure light sensitivity thresholds at various locations across the visual field. Many other perimetric techniques are now available in clinical practice, including frequency-doubling technology perimetry (FDT) and short-wavelength automated perimetry (SWAP). SWAP was designed to measure the sensitivity of the isolated blue cone pathway. FDT was originally designed to detect and evaluate visual field loss, irrespective of the etiology of the visual field defect. Nowadays it is mostly used for detection of functional loss attributable to glaucoma. A more recently introduced perimetric technique is flicker defined form perimetry (FDF). It employs a stimulus in which an array of randomly positioned black and white dots flicker at high temporal frequency in counterphase. The spots reverse polarity without changing their position, which means that white dots are replaced with black dots and black dots are replaced with white dots. At high temporal frequencies subjects cannot see the difference between the flickering dots but they can perceive an illusory circular edge contour, which appears as a gray patch against the mean luminance background ( Figure 1 ).
Variability is an inherent part of any visual field testing and can impact on the diagnostic and monitoring capabilities of perimetry. Factors that contribute to variability (such as fatigue, learning effect, artefacts or measurement errors, and the psychophysical test procedure itself) may make it difficult to detect glaucoma in its earliest stages. The learning effect is a particularly important issue in many psychophysical tests. Although subjects may initially report understanding of the test and try to cooperate, the outcome of further tests is often better than the outcome of the initial test. This means that in perimetry, an improvement of perimetric results can occur with repeated testing in initially inexperienced subjects.
Several studies have demonstrated a learning effect in glaucoma patients, healthy subjects, and subjects with ocular hypertension for SAP, FDT, and SWAP. It has been shown that learning effects do not only affect a subject’s first or second test but that they can be observed from data collected annually over the course of 6 years. As no data on learning or fatigue effects exist for FDF perimetry yet, the aim of the current study is to evaluate the learning effect for flicker defined form perimetry and to assess the fatigue effect when examining the second eye after the first.
Material and Methods
One hundred forty-one eyes of 75 healthy subjects aged between 21 and 75 years were enrolled in this prospective study. Some of the subjects had performed SAP or FDT previously, but none of the participants had prior experience with flicker defined form perimetry.
FDF visual field testing was performed with the Heidelberg Edge Perimeter (HEP, Heidelberg Engineering, Heidelberg, Germany), using the central 24-2 program and standard Adaptive Staircase Thresholding Algorithm (ASTA). The ASTA is based on an up/down staircase procedure and uses likelihood estimates generated from an inbuilt normative database. Sensitivity values are reported in decibels (dB). Seed points in each quadrant are initially measured using a 4-2-2 staircase. The estimated sensitivity is then used as a starting point for neighboring locations that complete a 2-2 staircase. FDF was generated by flickering random dots (target size 5 degrees × 5 degrees) of 0.34 cycles/degree at a rate of 15 Hz against a background with a mean luminance of 50 cdm 2 . Detailed instructions about how to perform the visual field test were given verbally by the examiner, and the test was started after a brief demonstration.
FDF was performed 3 times on 3 different days within 3 months in each individual (in total, every eye was measured thrice). To assess the effect of fatigue, the left eye was always examined following the right eye. The only rest offered between both eyes was the time it took to prepare the device for the second measurement. This did not exceed 2 minutes. Subjects were tested using their own distance glasses or contact lenses, as recommended by the company (user manual of the Heidelberg Edge Perimeter). In cases where distance glasses or contact lenses were unavailable, where subjects used bifocal or progressive power spectacle lenses, or if the subject’s spectacle frame was judged to impinge on the visual field under test, trial lenses for the distance prescription were placed in the lens holder. The distance between the eye and lens holder was approximately 1.5 cm. Before perimetry, each subject underwent a complete ophthalmic examination including slit-lamp examination, Goldmann applanation tonometry, fundus biomicroscopy using a superfield lens (Volk Optical Inc, Mentor, Ohio, USA), and visual acuity testing.
Inclusion criteria were a best-corrected logMAR visual acuity of -0.20 or better, a spherical refractive error between -5.00 and +5.00 diopters (cylinder within ±3.00 diopters), intraocular pressure (IOP) <21 mm Hg, clear ocular media without significant cataract, no history of previous intraocular surgery, absence of glaucomatous optic nerve head abnormalities (optic disc hemorrhages, neuroretinal rim localized or diffuse defects) and retinal nerve fiber layer defects, absence of any significant ocular disease, and absence of other diseases affecting the visual field.
Both eyes fulfilled all inclusion criteria in 66 subjects. In 9 subjects, only the right eye could be included (eg, owing to higher refractive error in the other eye). As there are no generally accepted values for FDF reliability indices to date, all examinations carried out were included in the study, and reliability values were analyzed. According to other perimetry tests, reliability values were considered to be normal with false-positive (FP) errors <20%, false-negative (FN) errors <33%, and fixation loss errors <33%. In FDF, FP errors are recorded when a patient presses the button within the first 200 msec of stimulus onset or when no stimulus is being presented. This can occur at any time during the test. FN errors are recorded when a patient does not respond to a supposedly suprathreshold stimulus at a location with a known threshold. The suprathreshold level is 6 dB brighter than the measured threshold level. FN errors are measured at a predetermined frequency throughout the test, with the standard frequency being 5% of all test presentations. Fixation loss errors are monitored by means of an eye tracker. If the tested eye deviates more than 5 degrees from the central fixation, a fixation loss is recorded.
To assess for learning effects without any influence by fatigue factors, only right eyes (n = 75) were included in this analysis. To exclude any effects based on the order of the eye that is tested first, the test was repeated for a fourth time in 15 subjects, now beginning with their left eyes. In 15 independent subjects, measurements of left eyes were performed with a longer rest time of at least 5 minutes.
The printouts of the HEP perimeter are very similar to those of SAP and Matrix-FDT, containing information about mean deviation (MD), pattern standard deviation (PSD), glaucoma hemifield test (GHT), and plots for sensitivity, total deviation, and pattern deviation. Improvement over time can be seen in increasing mean sensitivity (MS) or MD values and in decreasing PSD values. Learning effect was defined as an improvement in MS, MD, PSD, test duration, reliability indices, glaucoma hemifield test, and the number of test points with a p < 5% and < 0.5% in the pattern deviation maps across all 3 testings. Mean sensitivity was calculated as the average of all 53 threshold values. In contrast to the mean deviation value, which is a comparison against the age-adjusted expected value, as defined by a normative database, it represents the raw decibel threshold. Differences in learning effect were also evaluated by comparing the sensitivities of central, paracentral, and peripheral zones, as well as sensitivities across the 6 visual field sectors described by Garway-Heath and associates.
To assess for fatigue effects, results of left and right eyes (66 subjects) were analyzed. Left eyes were examined immediately after right eyes. The only rest offered between both measurements was the time it took to prepare the device for the measurement of the second eye, which did not exceed 2 minutes. For analysis, threshold levels of left eyes were inverted to right eyes. Results of left and right eyes in MS, MD, and PSD were evaluated among the first, second, and third tests.
Linear mixed models (LMMs) were used to analyze learning and fatigue effects over 3 test sessions. LMMs take into account correlated errors, whereas procedures in the general linear model family (eg, ANOVA, t tests) usually do not. General linear models do support random effects but estimate their parameters as if they were fixed, calculating variance components based on expected mean squares. LMMs, in contrast, use maximum likelihood estimation to estimate these parameters and, therefore, provide the flexibility to model not only the mean of a response variable but its covariance structure as well. Pairwise comparisons were embedded in LMMs to analyze the effects between tests 1 and 2, 2 and 3, and 1 and 3. To evaluate inter-eye differences or differences between visual field zones, interactions were taken into account if P values of the interactions showed significant values. Results with P < .05 were considered significant in the sense of per-comparison error rates. Statistical analyses were performed using PASW Statistics 18 for Windows (SPSS Inc., Chicago, Illinois, USA).
Results
Seventy-five healthy subjects aged between 21 and 75 years (41.5 years ± 14.9 years; mean ± SD ) were included in this prospective study. LogMAR visual acuity was -0.01 ± 0.7 (mean ± SD), refractive error was -0.3 ± 1.7 diopters (mean ± SD) with a cylinder of -0.5 ± 0.6 diopters (mean ± SD), and intraocular pressure was 14.8 ± 2.5 mm Hg (mean ± SD).
Changes in mean sensitivity (MS ± SD), mean deviation (MD ± SD), and pattern standard deviation (PSD ± SD) are shown in Table 1 . MS and MD improved significantly between all 3 tests ( P ≤ .01). There was no significant improvement in PSD when comparing tests 1 and 2 and tests 2 and 3. The improvement seen between the first and the third tests reached statistical significance ( P = .02).
| Results in decibels (dB) | P Value a | |||||
|---|---|---|---|---|---|---|
| Test 1 | Test 2 | Test 3 | Test 1,2 | Test 2,3 | Test 1,3 | |
| MS (SD) | 23.4 (3.1) | 24.1 (2.7) | 24.7 (2.7) | <.001 | .01 | <.001 |
| MD (SD) | −1.4 (2.7) | −0.6 (2.2) | 0.01 (2.3) | .001 | .01 | <.001 |
| PSD (SD) | 2.4 (0.8) | 2.3 (0.8) | 2.2 (0.7) | .14 | .40 | .02 |
a P values < .05 were considered to be significant. Significant P values are indicated in bold font.
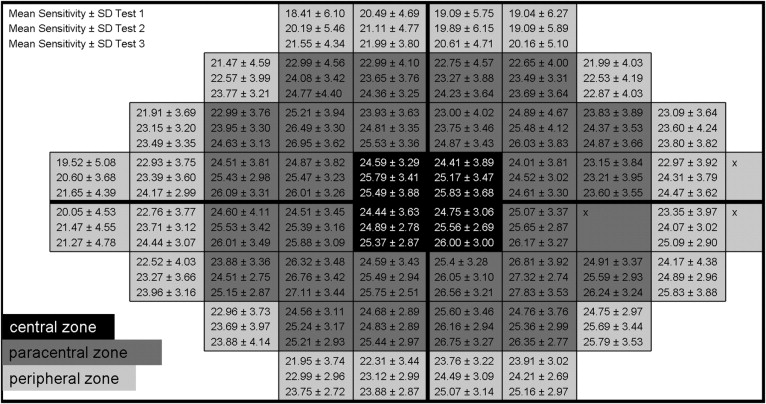
Figure 2 gives an overview of mean sensitivity in each of the 53 visual field test points. In almost all cases mean sensitivity progressively increased when tests were repeated. Mean sensitivity in the central zone of the visual field increased significantly between tests 1 and 2 and between tests 1 and 3 ( P ≤ .001), as shown in Table 2 . In the paracentral and peripheral zones of the visual field, mean sensitivity improved significantly among all 3 test sessions ( P ≤ .01). Differences between the central and peripheral zones reached statistical significance ( P < .01). With regard to the Garway-Heath structure/function map, the highest improvement was seen in the inferonasal sector, followed by the inferotemporal, superonasal, nasal, superotemporal, and temporal visual field sectors.
| Mean Sensitivity (SD) [dB] | P Value a | |||||
|---|---|---|---|---|---|---|
| Test 1 | Test 2 | Test 3 | Test 1,2 | Test 2,3 | Test 1,3 | |
| Sector b | ||||||
| Sector I (ST) | 24.2 (4.0) | 24.9 (3.6) | 25.3 (3.7) | .001 | .06 | <.001 |
| Sector II (SN) | 23.8 (3.6) | 24.5 (3.2) | 25.2 (3.2) | .001 | .002 | <.001 |
| Sector III (N) | 23.4 (4.0) | 24.2 (3.6) | 24.8 (3.7) | <.001 | .01 | <.001 |
| Sector IV (IN) | 20.9 (5.3) | 21.7 (5.1) | 22.4 (4.4) | .01 | .01 | <.001 |
| Sector V (IT) | 23.4 (4.3) | 24.2 (3.8) | 24.9 (3.8) | <.001 | .01 | <.001 |
| Sector VI (T) | 24.5 (3.6) | 25.2 (3.0) | 25.6 (3.3) | .001 | .045 | <.001 |
| Zone | ||||||
| Zone I (CZ) | 24.6 (3.4) | 25.4 (3.1) | 25.7 (3.4) | .001 | .16 | <.001 |
| Zone II (PZ) | 24.4 (3.9) | 25.0 (3.4) | 25.6 (3.5) | .001 | .01 | <.001 |
| Zone III (PEZ) | 22.0 (4.6) | 22.8 (4.3) | 23.5 (4.1) | <.001 | .001 | <.001 |
a Significance levels for pairwise comparisons. P values < .05 were considered to be significant. Significant P values are indicated in bold font.
Mean test duration was 5.7 ± 1.4 minutes at the first examination (mean ± SD; range: 3.9 – 13.7 minutes) and decreased at the second (5.4 ± 0.9 minutes [mean ± SD; range: 3.7 – 8.3]) and third (5.3 ± 0.9 minutes [mean ± SD; range: 4.0 – 8.0]) examinations. Significant differences could only be seen between tests 1 and 3 ( P = .01) but not between tests 1 and 2 ( P = .09) or tests 2 and 3 ( P = .43).
A reduction in FP and FN errors was noticeable between all 3 tests, but this did not reach statistical significance ([mean ± SD], FP test 1: 0.8% ± 1.0%; FP test 2: 0.7% ± 0.9%; FP test 3: 0.7% ± 0.9% [ P 1-2 = .14, P 2-3 = .88, P 1-3 = .10]; FN test 1: 12.1% ± 14.3%; FN test 2: 9.1% ± 11.5%; FN test 3: 9.6% ± 13.2% [ P 1-2 = .15, P 2-3 = .81, P 1-3 = .22]). Fixation-loss errors decreased significantly between tests 2 (10.2% ± 15.7%) and 3 (6.2% ± 9.6%) and between tests 1 (10.0% ± 13.8%) and 3 ( P = .02, respectively). There was no significant reduction between tests 1 and 2 ( P = .94).
In order to investigate if the learning effect was of clinical significance, we also analyzed the average number of depressed locations on the pattern deviation probability map. Test points with p < 5% tended to decline between all tests. Differences were not significant ([mean ± SD], test 1: 1.7 ± 1.6; test 2: 1.3 ± 1.5; test 3: 1.1 ± 2.2 [ P 1-2 = .12, P 2-3 = .60, P 1-2 = .29]). In contrast to these results, there was a significant reduction in the number of test points with p < 0.5% between tests 1 and 2 and 1 and 3 ([mean ± SD], test 1: 1.1 ± 2.2; test 2: 0.6 ± 1.2; test 3: 0.5 ± 1.1; P 1-2 = .04 and P 1-3 = .01).
In 48 of 75 subjects (64%), the glaucoma hemifield test consistently reported results as being “within normal limits” in all 3 tests. In 10 subjects (13%), GHT reported results as being “outside normal limits” at the first test and subsequently changed to “within normal limits” at their second and third tests ( Figure 3 ).


