Purpose
To determine the incidence and characteristics of intrachoroidal cavitations in the macular area of eyes with high myopia.
Design
Prospective, noninterventional case series.
Methods
We evaluated 56 eyes of 44 patients with pathologic myopia (myopic spherical equivalent >8 diopters) and with patchy chorioretinal atrophy using a swept-source optical coherence tomographic (OCT) system with a center wavelength of 1050 nm. We focused on the changes in the scleral curvature in the area of patchy atrophy. The relationship of the macular intrachoroidal cavitation and retinoschisis was also analyzed. Sixty-eight consecutive patients with pathologic myopia but without patchy atrophy were analyzed as controls.
Results
In 31 of 56 eyes (55.4%) with patchy atrophy, the swept-source OCT images showed that the sclera was bowed posteriorly in and around the patchy atrophy compared to neighboring sclera, whereas none of the 68 patients without patchy atrophy showed this finding. Macular intrachoroidal cavitation had OCT features similar to peripapillary intrachoroidal cavitation; the choroid in the macular intrachoroidal cavitation area appeared thickened and the retina was caved into the cavitation. There was a direct communication between the vitreous and intrachoroidal cavitation in 3 eyes. Retinoschisis was observed significantly more frequently in or around the patchy atrophy in eyes with macular intrachoroidal cavitation than in those without cavitation.
Conclusions
These findings suggest that patchy atrophy affects the scleral contour within posterior staphyloma beyond the funduscopically identified patchy atrophy by macular intrachoroidal cavitation. Such deformation of sclera may facilitate the development of retinoschisis in and around the patchy atrophy.
Pathologic myopia is a major cause of visual impairment worldwide. The visual impairment is mainly attributable to the development of myopic macular lesions secondary to the excessive increase of the axial length of the eyes and the development of posterior staphylomas. The myopic macular lesions include myopic choroidal neovascularization (CNV), myopic macular retinoschisis, and myopic chorioretinal atrophy. The myopic chorioretinal atrophies are classified into 2 types based on the funduscopic findings: diffuse chorioretinal atrophy and patchy chorioretinal atrophy. A diffuse chorioretinal atrophy is an ill-defined yellowish-white atrophy and the vision is not severely affected. A patchy chorioretinal atrophy, on the other hand, is a grayish-white lesion with well-defined borders. This appearance is believed to be caused by a complete loss of the choriocapillaris and the subsequent degeneration of the photoreceptors and the retinal pigment epithelium (RPE) because of the loss of the choriocapillaris. This area of patchy atrophy is associated with an absolute scotoma. An enlargement of a patchy chorioretinal atrophy is the main cause of central vision loss in patients with pathologic myopia. The morphology of a patchy chorioretinal atrophy has been studied by conventional ophthalmoscopy.
Spectral-domain optical coherence tomography (OCT) has also been used to study patchy chorioretinal atrophies. However, these instruments are limited to what can be observed at the surface of the tissue. It has not been possible to observe the morphologic structure of the deeper tissues such as the sclera in the area of the patchy atrophy by these conventional methods. Swept-source OCT uses a wavelength-sweeping laser as the light source, and in practice, it has less sensitivity roll-off with tissue depth than conventional spectral-domain OCTs. The current swept-source OCT instruments use a longer center wavelength, generally in the 1-micrometer range, which has improved their ability to penetrate deeper into tissues than the conventional spectral-domain OCT instruments. With the ability of imaging deeper structures in the eye, evaluations of their morphology, such as that of the entire layer of choroid and retrobulbar part of the optic nerve, are potentially possible.
When we examined highly myopic patients with a swept-source OCT, we noticed that the sclera was bowed posteriorly in the area of the patchy atrophy in many of these eyes. This area then resembled the intrachoroidal cavitations that develop adjacent to a myopic conus in highly myopic eyes and are referred to as peripapillary intrachoroidal cavitations. Peripapillary intrachoroidal cavitations are seen as yellowish-orange lesions located inferior to the optic disc and are found in 4.9% of highly myopic eyes. This lesion was originally termed peripapillary detachment in pathologic myopia because the defect was thought to represent an elevation of the retina and the RPE. Toranzo and associates used a Stratus 3000 OCT (Humphrey-Zeiss, Dublin, California, USA) and found that a deep hyporeflectivity area was present in the underlying choroid. They changed the name of the defect to peripapillary intrachoroidal cavitation. We recently examined highly myopic patients with peripapillary intrachoroidal cavitation with a swept-source OCT and found that the sclera was bowed posteriorly under the region of the intrachoroidal cavitation, while the overlying retina-RPE–Bruch membrane complex showed little, if any, deformation.
The purpose of this study was to determine the incidence and morphology of the intrachoroidal cavitations in the macular area in highly myopic eyes with patchy chorioretinal atrophy. The clinical significance of the lesions, especially their association with the development of retinoschisis, was also examined.
Patients and Methods
Forty-four consecutive patients with pathologic myopia and patchy chorioretinal atrophy in the macula were studied. All of the patients were examined with a swept-source OCT from July 22, 2011 to October 14, 2011 in the High Myopia Clinic at Tokyo Medical and Dental University, Tokyo, Japan. The definition of pathologic myopia was a refractive error (myopic spherical equivalent) >8.00 diopters (D) or an axial length >26.5 mm. Sixty-eight consecutive patients with high myopia but without patchy atrophy who visited the High Myopia Clinic between July 22, 2011 and October 14, 2011 were also analyzed as controls. All of the participants had a comprehensive ocular examination including measurements of the refractive error (spherical equivalent), axial length with IOL Master (Carl Zeiss Meditec, Dublin, California, USA), and fundus biomicroscopy.
Patchy chorioretinal atrophy was defined as a well-defined grayish-white retinochoroidal lesion. In the atrophic phase of myopic CNVs, well-defined chorioretinal atrophy can develop that resembles a patchy chorioretinal atrophy. However, the atrophic phase of a myopic CNV is different from patchy atrophy, and the eyes with this lesion were excluded from this study. Also, patients who had undergone vitreoretinal surgeries, had poor fixation attributable to dense cataract, and had myopic macular holes were excluded. The area of patchy chorioretinal atrophy was determined from the color fundus photographs using software of an imaging system (PDT/MPS software; Topcon, Tokyo, Japan) that is based on the axial length, the corneal curvature, and the refractive power of the eye. This software uses Littmann’s formula based on the values of the Gullstrand schematic eye. Vertical and horizontal lines were drawn through the fovea on the photograph of each eye, and the location of patchy atrophy was divided into 4 quadrants: upper nasal, lower nasal, upper temporal, and lower temporal. One author (M.M.) masked to the OCT findings determined the location and measured the area of the patchy atrophy.
Swept-Source Optical Coherence Tomography
All of the eyes were examined by a prototype swept-source OCT instrument manufactured by Topcon Corporation. This swept-source OCT system has an A-scan repetition rate of 100 000 Hz, and its light source operates in the 1-μm wavelength region. The light source is a wavelength-sweeping laser centered at 1050 nm with an approximate 100-nm tuning range. However, the effective bandwidth was approximately 60 nm because of the absorption of the energy by water. The axial resolution was calculated to be 8 μm in tissue with a lateral resolution of 20 μm. The imaging depth was 2.6 mm in tissue, and the lateral scan length was adjustable.
Four scanning protocols were used: 3-dimensional (3D) volumetric scans, line scans, 7-line raster scans, and radial scans. The 3D volumetric data were acquired in 0.8 seconds and each 3D scan covered an area of 6 × 6 mm 2 with a 256 (horizontal) × 256 (vertical) lines A-scan density. To improve the image quality, 3 consecutive B-scan images were averaged by a weighted moving average. The 7-line raster scans and radial scans were performed when necessary. Each scan had a lateral scan length of either 6 mm or 9 mm. A single image was made up of 1024 A lines acquired in 10 ms. Typically, 32 B-scan images were recorded and averaged by post-processing to yield a despeckled B-scan image. The width and depth of the intrachoroidal cavitation was measured with the built-in caliper function of the OCT software by 1 masked author (M.M.).
Statistical Analyses
The patients’ age, axial length, and the size of the patchy atrophy were compared between eyes using Mann-Whitney U tests, paired t tests, and Welch t tests. The sex distribution was analyzed using χ 2 tests. The incidence of peripapillary intrachoroidal cavitations or macular retinoschisis, and the locations of the intrachoroidal cavitations, were analyzed by χ 2 tests. A P value <.05 was considered statistically significant.
Results
Fifty-six eyes of 44 consecutive highly myopic patients with patchy atrophy that were examined by swept-source OCT in the High Myopia Clinic at Tokyo Medical and Dental University between July 22, 2011 and October 14, 2011 were studied. Thirty-two eyes were excluded because of unilateral high myopia, history of vitreoretinal surgery, dense cataracts, and poor fixation. The demographics of the 44 patients and 68 highly myopic patients (113 eyes) without patchy atrophy are shown in Table 1 .
| With Patchy Atrophy | Without Patchy Atrophy | P Value | |
|---|---|---|---|
| Sex, no. eyes (persons) | |||
| Men | 13 (11) | 24 (17) | n.s. |
| Women | 43 (33) | 89 (52) | |
| Age (y), mean ± SD (range) | 60.9 ± 12.8 (30∼85) | 61.3 ± 14.3 (18∼85) | n.s. |
| Refractive error (diopters), mean ± SD (range) | −13.7 ± 4.0 (−8.5∼−20.0) | −13.0 ± 3.6 (−8.5∼−20.0) | n.s. |
| Axial length (mm), mean ± SD (range) | 30.2 ± 1.8 (26.5∼35.3) | 29.3 ± 1.8 (26.5∼35.0) | .003 a |
| Number of patchy atrophy per eye, mean ± SD (range) | 1.9 ± 1.1 (1∼6) | N/A | |
The average number of patchy atrophies was 1.9 ± 1.1/eye. A posterior staphyloma was found in all of the eyes with patchy atrophy and in 108 of 113 eyes without patchy atrophy. There was no significant difference in the age and refractive error between highly myopic eyes with and without patchy atrophy ( Table 1 ). The axial length was significantly longer in eyes with patchy atrophy than in those without patchy atrophy ( P = .003, Student t test and Welch t test).
The examinations of the area of patchy chorioretinal atrophy by swept-source OCT showed that the outer retina, the RPE, and the choroid were absent, and the inner retina appeared to be attached directly to the sclera ( Figure 1 ) . However, the curvature of the inner and outer sclera in the area of patchy atrophy did not differ from that of the neighboring sclera ( Figure 1 ). This type of OCT finding was observed in 23 of 56 eyes (41.1%) with patchy atrophy.
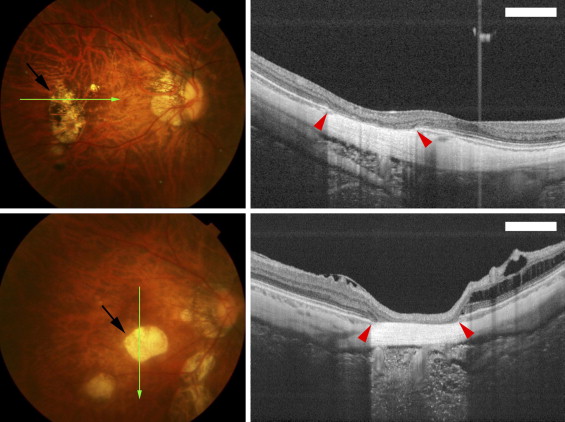
In the remaining 33 eyes with patchy atrophy, swept-source OCT showed that the sclera of these eyes was bowed more posteriorly than the surrounding area in 31 of the 56 eyes (55.4%; Figures 2 through 4 ) . The morphologic appearance of these lesions in swept-source OCT images was strikingly similar to those of the peripapillary intrachoroidal cavitations found in eyes with pathologic myopia. The only difference was in the location, that is, peripapillary vs macular. A macular intrachoroidal cavitation was not observed in the 113 highly myopic eyes without patchy atrophy.
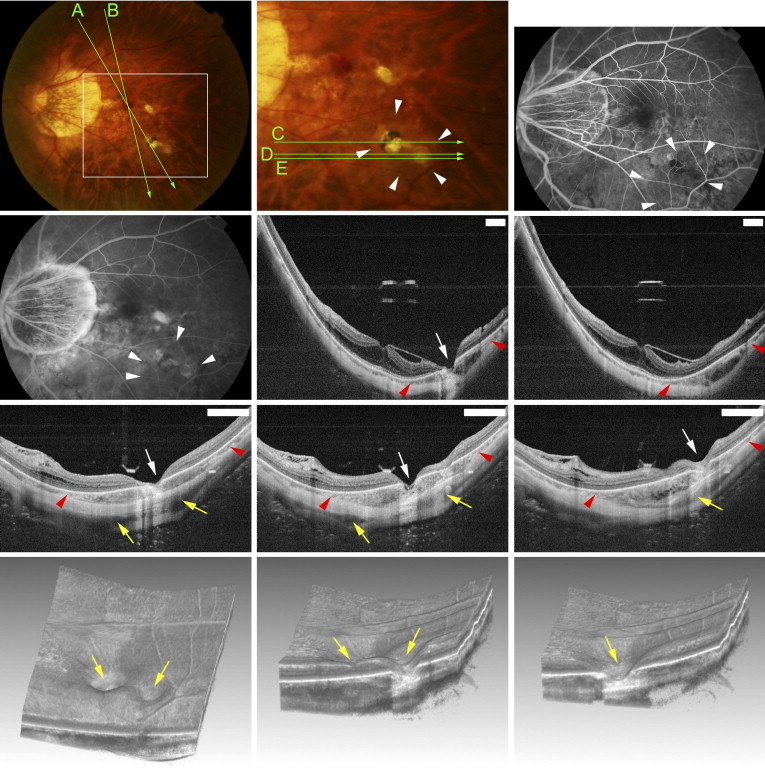
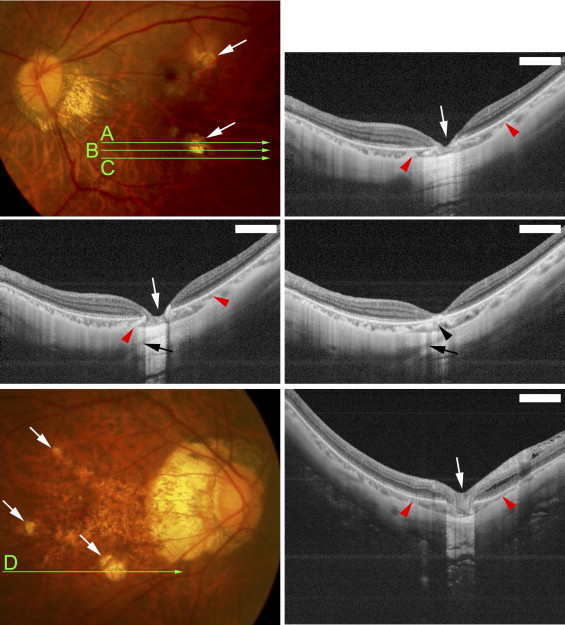
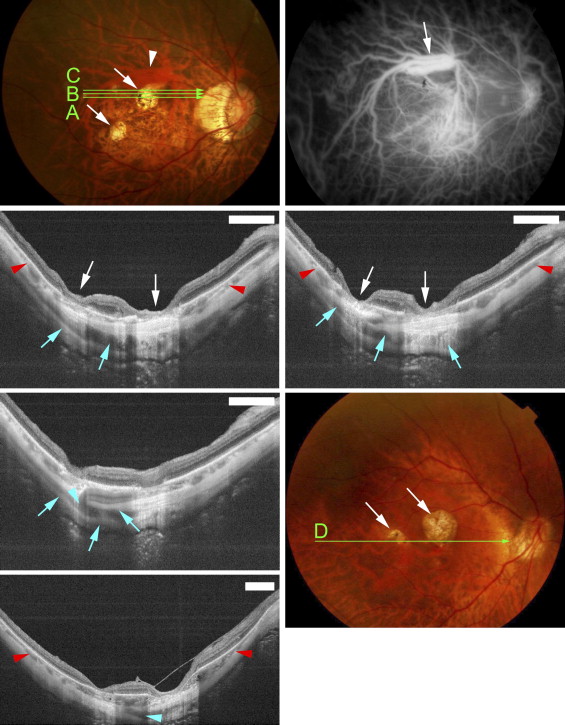
Funduscopic examination showed that the macular intrachoroidal cavitation appeared as an orange-colored lesion with ill-defined borders surrounding the patchy atrophy ( Figures 2 and 3 ) in 14 of 31 eyes (45.2%). The region was mildly hypofluorescent in the early phase and slightly hyperfluorescent in the late phase of fluorescein angiography ( Figure 2 ). The orange color in funduscopic examination and fluorescein angiographic findings were similar to those of peripapillary intrachoroidal cavitation. The retina was sunken into the space of the macular intrachoroidal cavitation in all eyes. Because of the caving-in of the retina, the area of macular cavitation had a dented appearance, and this site resembled a “pseudo-fovea” ( Figures 2 and 3 ). In 3 of the 31 eyes (9.7%) with macular intrachoroidal cavitation, a hyporeflective space suggesting the presence of fluid was detected within the space of the cavitation in the OCT images ( Figure 2 Second row, middle and right; and Third row, right). There was a direct communication between the vitreous cavity and the intrachoroidal cavitation in these 3 eyes ( Figure 2 Third row, middle). In the area of macular intrachoroidal cavitation, the choroid was thicker than that of the surrounding area; however, a close inspection of the OCT images showed a linear reflectivity near the inner surface of the intrachoroidal cavitation that may represent the original thickness of the choroid ( Figure 3 Middle, right). This suggested that the cavitation, at least in some eyes, begins in the suprachoroidal space.
The average number of macular intrachoroidal cavitations/eye was 1.31 ± 0.53, with a range of 1 to 4. The total number of the different types of lesions in highly myopic eyes with patchy atrophy was 104, of which 41 (39.4%) were macular cavitations. In the 104 lesions, 1 of 4 lesions (25.0%) were located in the upper nasal quadrant, 4 of 17 lesions (23.5%) in the lower nasal quadrant, 7 of 27 lesions (25.9%) in the upper temporal quadrant, and 29 of 56 lesions (51.8%) in the lower temporal quadrant. Statistical analyses showed that the intrachoroidal cavitation developed significantly more frequently in the lower temporal quadrant than in the lower nasal or upper temporal quadrants ( P = .04 and P = .02, respectively, by χ 2 tests).
Statistical examinations showed that the patients with macular intrachoroidal cavitations were significantly older and the axial lengths of their eyes were significantly longer than those without these lesions ( Table 2 ). The incidence of peripapillary intrachoroidal cavitations in eyes with macular intrachoroidal cavitations did not differ significantly from that of eyes without macular cavitations. The average size of patchy atrophy in eyes with macular intrachoroidal cavitations was 1.61 ± 1.74 mm 2 , with a range of 0.195 to 8.50 mm 2 , which was not significantly different from that of patchy atrophy without macular cavitation, at 1.53 ± 2.05 mm 2 with a range of 0.03 to 9.08 mm 2 ( P > .05; Mann-Whitney U tests). The width and depth of the macular intrachoroidal cavitation varied; however, the size of the intrachoroidal cavitation was larger than the RPE defects detected by OCT, and the intrachoroidal cavitations were larger than the area of patchy atrophy ophthalmoscopically ( Figures 2 through 4 ). The average width of a macular intrachoroidal cavitation including the posterior displacement of the scleral curvature was 1568.0 ± 776.3 μm, with a range of 611 to 4411 μm. In 3 eyes, 2 separate intrachoroidal cavitations were fused at a deeper level and formed 1 large space ( Figure 4 ). The intrachoroidal cavitation appeared very wide in these 3 eyes (widths of 2574, 3292, and 4411 μm). In 19 of 31 eyes (61.3%) with macular intrachoroidal cavitation, large intrascleral vessels were present very close to the area of the cavitation ( Figures 2 and 4 ). An inner or outer retinoschisis was detected around the patchy atrophy in 22 of 33 eyes with a macular intrachoroidal cavitation (66.7%), which was significantly more frequent than in the 5 of 23 eyes without a cavitation (21.7%; P = .0009, χ 2 test) or the 21 of 113 eyes without patchy atrophy (18.6%; P < .0001, χ 2 test). An epiretinal membrane was found on and around the patchy atrophy in 11 of 22 eyes with retinoschisis and a macular intrachoroidal cavitation, and in 2 of 5 eyes with retinoschisis but without a cavitation. This difference was not significant.


