Purpose
To investigate the choroidal vascular structural changes in eyes with central serous chorioretinopathy (CSC) by using swept-source optical coherence tomography (SS-OCT).
Design
Prospective cross-sectional study.
Methods
We prospectively examined 40 eyes of 34 consecutive patients with CSC. Three-dimensional choroidal images of the macular area, covering 3 × 3 mm and 6 × 6 mm, were obtained with SS-OCT. En face images of the microvasculature of the inner choroid and large choroidal vessel layers were converted to binary images. Choroidal vascular areas were analyzed quantitatively using the binary images.
Results
The choroidal vascular area was larger in eyes with CSC (the microvasculature of the inner choroid: 53.4% ± 2.4%, P = .028; 3 × 3-mm large choroidal vessels: 66.9% ± 7.1%, P < .001; and 6 × 6-mm large choroidal vessels: 64.8% ± 7.3%, P < .001) than in age-matched normal eyes (52.2% ± 1.8%, 54.9% ± 4.4%, and 53.8% ± 4.3%, respectively). The choroidal vascular area at the microvasculature of the inner choroid level was larger in multifocal posterior pigment epitheliopathy (55.8% ± 2.2%) than in classic CSC (53.1% ± 2.1%, P = .038) and in diffuse retinal pigment epitheliopathy (52.9% ± 2.6%, P = .042). The subfoveal choroidal thickness was significantly associated with the choroidal vascular area at the level of large choroidal vessels ( P < .001).
Conclusions
Increased choroidal vascular area was observed in the whole macula area in eyes with CSC. This finding suggests that CSC may originate from a choroidal circulatory disturbance.
Central serous chorioretinopathy (CSC) is characterized by serous retinal detachment (SRD) in the macula accompanied with retinal pigment epithelium (RPE) detachment. Fluorescein angiography (FA) shows a single or multiple points of dye leakage at the RPE and dye pooling into the subretinal space. The subretinal fluid may be derived from the choroidal exudation. In addition, indocyanine green angiography (IA) shows choroidal vascular changes, including delayed filling, vascular congestion, choroidal hyperpermeability, and punctate hyperfluorescent spots. These angiographic findings strongly suggest that the primary mechanism underlying CSC may involve a choroidal vascular abnormality.
Imaging of the choroid with optical coherence tomography (OCT) does not allow visualization of the entire choroidal structure, owing to its low penetration and high backscattering at the level of the RPE. However, since Margolis and Spaide introduced enhanced depth imaging (EDI) OCT, many investigators have studied choroidal thickness in healthy and diseased eyes. In fact, using the EDI-OCT technique, it has been reported that choroidal thickness increased in patients with CSC compared with that in patients with normal eyes. However, EDI-OCT is usually coupled to multiple averaging to achieve high contrast and low speckle noise, resulting in less detailed raster scan images. For this reason, en face imaging of the choroid is difficult using EDI-OCT.
Other investigators reported the measurement of choroidal thickness with the use of OCT at a longer wavelength. Swept-source (SS)-OCT at a longer wavelength, which is characterized by a high-speed scan rate and a relatively low-sensitivity roll-off vs depth compared with the spectral-domain OCT, allows us to obtain a 3-dimensional (3D) high-contrast image of the choroid. In addition, several algorithms were recently developed for SS-OCT, which allows for en face imaging of the choroid. These developments provide the unique opportunity to profile the 3D anatomy of choroidal layers.
The purpose of this study was to objectively assess the choroidal vascular dilation in eyes with CSC using en face SS-OCT imaging. We scanned the whole macular area of healthy subjects and CSC patients by high-penetrating SS-OCT using a 3D scan protocol, and produced en face images of the microvasculature of the inner choroid and large choroidal vessels. We converted en face images obtained by SS-OCT into binary images and assessed the enlarged choroidal vasculature quantitatively.
Methods
The Ethics Committee at Kyoto University Graduate School of Medicine approved this prospective study, which was conducted in accordance with the tenets of the Declaration of Helsinki. Written informed consent was obtained from each subject before any study procedures or examinations were performed.
Subjects
For this prospective cross-sectional study, we recruited consecutive patients with CSC who visited the Macular Service at Kyoto University Hospital between January 2014 and November 2014, as well as age-matched healthy subjects. Healthy eyes were recruited from healthy volunteers and unaffected fellow eyes of patients with unilateral retinal diseases (eg, epiretinal membrane, vitreomacular traction syndrome). All of the subjects underwent a comprehensive ocular examination, including autorefractometry, best-corrected visual acuity measurement with a Landolt C chart, slit-lamp biomicroscopy, intraocular pressure measurement, fundus photography (TRC-NW8F; Topcon Corp, Tokyo, Japan), axial length measurement using ocular biometry (IOLMaster; Carl Zeiss Meditec, Jena, Germany), and SS-OCT imaging (DRI OCT-1; Topcon Corp). All patients with CSC also underwent simultaneous FA and IA using the Spectralis HRA+OCT (Heidelberg Engineering, Heidelberg, Germany). CSC was diagnosed if patients had SRD within the macular area, which was confirmed by OCT, and associated with idiopathic leaks from the RPE during FA/IA, excluding other causes of SRD. The exclusion criteria included other macular abnormalities (eg, retinal vein occlusion, age-related macular degeneration, pathologic myopia, idiopathic choroidal neovascularization [CNV], other secondary CNV, intraocular inflammation, history of ocular trauma, poor image owing to media opacity or poor fixation, or history of vitrectomy, anti–vascular endothelial growth factor administration, and photodynamic therapy).
Classification of Central Serous Chorioretinopathy
Patients with CSC were classified into 3 types: classic CSC, diffuse retinal pigment epitheliopathy (DRPE), and multifocal posterior pigment epitheliopathy (MPPE). Classic CSC was defined as only a few spots of leakage from the RPE. DRPE was defined as broad areas of granular hyperfluorescence during FA associated with many indistinct areas of leakage. MPPE was defined as multiple massive leakages from the choroid.
Each type of CSC was divided into active and resolved eyes. Active eye was indicated when the eye had SRD within the macular area. Resolved eye was indicated as the absence of SRD at the time of SS-OCT measurement, showing SRD at the first visit or at the visit before the time of SS-OCT measurement.
Swept-Source Optical Coherence Tomography
Swept-source OCT examinations were performed by trained examiners after pupil dilation. In each subject, horizontal and vertical line scans (12 mm) were obtained through the fovea. Each 3D volumetric scan covered an area of 3 × 3 mm 2 and 6 × 6 mm 2 , centered on the fovea. Three-dimensional 3 × 3-mm 2 volumetric scans consisted of 512 (horizontal) × 256 (vertical) A-scans and 3D 6 × 6-mm 2 volumetric scans comprised 512 (horizontal) × 128 (vertical).
Measurement of Choroidal Thickness
Choroidal thickness was defined as the distance between the line corresponding to the Bruch membrane beneath the RPE and the chorioscleral interface. The choroidal thicknesses at the center of the fovea were manually measured from vertical and horizontal scans with a built-in caliber tool, and each length was averaged.
En Face Imaging
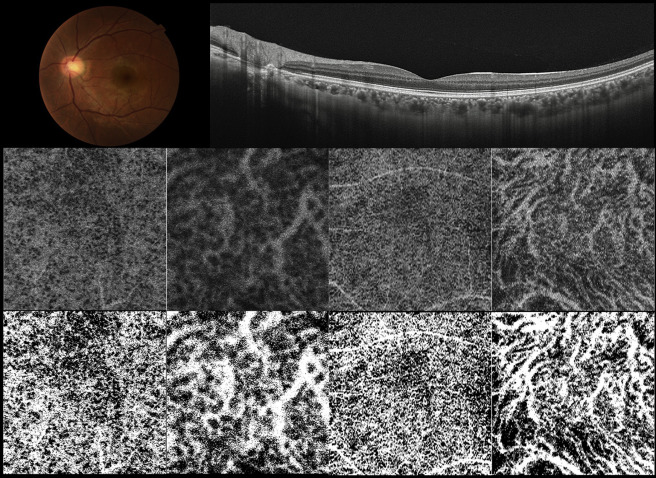
In each B-scan of the 3D data set, the outer surface of the Bruch membrane line was automatically determined by the software, and manual corrections were made as necessary using the built-in segmentation-modifying tool. En face images were automatically reconstructed from the 3D data set using software developed by Topcon Corporation. En face images of the choroid were created by being extracted at varying depths every 2.6 μm from the Bruch membrane and were flattened at the level of the Bruch membrane. In the middle row of Figure 1 , the en face images indicated white region for vascular lumens and black region for the vascular wall and choridal stroma.
Measurement of Choroidal Vascular Area
To evaluate the area of choroidal vasculature, 2 en face images were used: 1 at the level of the microvasculature of the inner choroid (26 μm below the Bruch membrane) and 1 at the level of large choroidal vessels (the intermediate level between the Bruch membrane and the deepest site of the chorioscleral interface through the fovea). It is reported that choriocapillaris is located about 5–10 μm below the Bruch membrane, and its diameter is about 15–20 μm. Each en face image was created by extracting from 3-dimensional raster scans at every 2.6 μm depth. Thus, we decided to measure the choroidal microvascular area 26 μm below the Bruch membrane. The area of choroidal vasculature of the adopted images was measured using ImageJ public domain software (Wayne Rasband, National Institutes of Health, Bethesda, Maryland, USA; available at http://rsb.info.nih.gov/ij/index.html ). In ImageJ, the command path Image > Adjust > Threshold > Auto was used to distinguish the vasculature and the choroidal stroma, and the adopted images were binarized ( Figure 1 , Bottom row). Binarization of an en face image was done by the Otsu method, which is an automatic threshold selection method from gray-level histograms. Next, the area of the portion of vascular lumens was calculated in the pixel value by using the command path Analyze > Measure in ImageJ. In the present study, the choroidal vascular area of the adopted images was defined as the percentage of the portion of vascular lumen area against whole scan area.
Statistical Analysis
All values are presented as mean ± standard deviation. The measured visual acuity was converted to the logarithm of the minimum angle of resolution (logMAR) for statistical analyses. χ 2 Tests were used to compare the distribution of categorical variables. Unpaired t tests were used to compare with control eyes or between states of CSC. Paired t test was used to compare between affected eyes and unaffected fellow eyes in patients with unilateral CSC. One-way analysis of variance (ANOVA) and post hoc Bonferroni test were used to compare among the 3 subtypes of CSC. Bivariate relationships were examined using Pearson product-moment correlation coefficient test. Statistical significance was set at P < .05.
Results
In this study, 40 eyes of 34 patients with CSC and 26 eyes of 26 healthy subjects were included. Twenty-eight patients had unilateral CSC and 6 patients had bilateral CSC.
Central Serous Chorioretinopathy Eyes and Unaffected Fellow Eyes Compared With Control Eyes
CSC patients and healthy subjects were similar in age (55.4 ± 12.1 vs 56.5 ± 20.5, P = .797) and axial length (23.6 ± 1.2 mm vs 24.2 ± 1.2 mm, P = .060). There was no significant difference in sex distribution between the CSC patients and healthy subjects (26 men and 14 women vs 12 men and 14 women, P = .130).
The mean subfoveal choroidal thickness of eyes with CSC (395.9 ± 103.3 μm) was significantly larger compared with control eyes (238.0 ± 81.1 μm). The choroidal vascular area was significantly higher in eyes with CSC than in control eyes both at the level of the microvasculature of the inner choroid (3 × 3 mm: 53.4% ± 2.4% vs 52.2% ± 1.8%, P = .028; 6 × 6 mm: 54.0% ± 1.7% vs 51.9% ± 2.1%, P < .001) and at the level of the large choroidal vessels (3 × 3 mm: 66.9% ± 7.1% vs 54.9% ± 4.4%, P < .001; 6 × 6 mm: 64.8% ± 7.3% vs 53.8% ± 4.3%, P < .001) ( Table 1 , Figures 1 and 2 ).
| Control Eyes (n = 26) | CSC Eyes (n = 40) | Fellow Eyes (n = 28) | P Value a | P Value b | |
|---|---|---|---|---|---|
| Age (y) | 56.5 ± 20.5 | 55.4 ± 12.1 | 54.07 ± 13.0 | .797 | .608 |
| Sex (M/F) | 12/14 | 26/14 | 18/10 | .130 | .180 |
| R/L | 12/14 | 22/18 | 16/12 | .482 | .419 |
| Axial length (mm) | 24.2 ± 1.2 | 23.6 ± 1.2 | 24.1 ± 1.4 | .060 | .690 |
| Subfoveal choroidal thickness (μm) | 238.0 ± 81.1 | 395.9 ± 103.3 | 339.8 ± 101.9 | <.001 | <.001 |
| Vascular area (%) | |||||
| Microvasculature (3 × 3 mm) | 52.2 ± 1.8 | 53.4 ± 2.4 | 52.9 ± 1.9 | .028 | .162 |
| Large choroidal vessels (3 × 3 mm) | 54.9 ± 4.4 | 66.9 ± 7.1 | 62.1 ± 7.1 | <.001 | <.001 |
| Microvasculature (6 × 6 mm) | 51.9 ± 2.1 | 54.0 ± 1.7 | 53.4 ± 1.7 | <.001 | .006 |
| Large choroidal vessels (6 × 6 mm) | 53.8 ± 4.3 | 64.8 ± 7.3 | 61.0 ± 7.1 | <.001 | <.001 |
a P value was compared between the eyes with CSC and normal control eyes.
b P value was compared between the unaffected fellow eyes in patients with unilateral CSC and normal control eyes.
Unaffected fellow eyes and control eyes were similar in age ( P = .608) and axial length ( P = .690). The mean subfoveal choroidal thickness was larger in the unaffected fellow eyes (339.8 ± 101.9 μm) compared with the control eyes ( P < .001). The choroidal vascular area was significantly higher in unaffected fellow eyes with CSC than in control eyes at the level of the microvasculature of the inner choroid (6 × 6 mm: 53.4% ± 1.7%, P = .006), not at the level of the microvasculature of the inner choroid (3 × 3 mm: 52.9% ± 1.9%, P = .162). The choroidal vascular area in the unaffected fellow eyes was larger at the level of the large choroidal vessels (3 × 3 mm: 62.1% ± 7.1%, P < .001; 6 × 6 mm: 61.0% ± 7.1%, P < .001) than in the control eyes ( Table 1 ).
Affected Eyes Compared With Unaffected Fellow Eyes
Comparisons of parametric data of affected eyes and unaffected fellow eyes of the unilateral CSC patients are shown in Table 2 . The mean subfoveal choroidal thickness in the affected eyes was significantly thicker than in the unaffected fellow eyes (384.8 ± 113.8 μm vs 339.8 ± 101.9 μm, P = .005). There was no significant difference in the choroidal vascular area at the level of the microvasculature of the inner choroid. The choroidal vascular area at the large choroidal vessels level was significantly larger in the affected eyes than in the unaffected fellow eyes (3 × 3 mm: 65.5% ± 7.1% vs 62.1% ± 7.1%, P = .012; 6 × 6 mm: 63.2% ± 7.6% vs 61.0% ± 7.1%, P = .030).
| Affected Eyes | Fellow Eyes | P Value | |
|---|---|---|---|
| Axial length (mm) | 23.8 ± 1.2 | 24.1 ± 1.4 | .009 |
| Subfoveal choroidal thickness (μm) | 384.8 ± 113.8 | 339.8 ± 101.9 | .005 |
| Vascular area (%) | |||
| Microvasculature (3 × 3 mm) | 52.8 ± 2.0 | 52.9 ± 1.9 | .890 |
| Large choroidal vessels (3 × 3 mm) | 65.5 ± 7.1 | 62.1 ± 7.1 | .012 |
| Microvasculature (6 × 6 mm) | 53.7 ± 1.6 | 53.4 ± 1.7 | .398 |
| Large choroidal vessels (6 × 6 mm) | 63.2 ± 7.6 | 61.0 ± 7.1 | .030 |
Active Eyes Compared With Resolved Eyes
Thirty-three eyes were active status with SRD involving the macula and 7 were resolved eyes with absence of SRD. Table 3 shows comparative data between active eyes and resolved eyes. There was no significant difference in the subfoveal choroidal thickness and the choroidal vascular area between active eyes and resolved eyes.
| Active (n = 33) | Resolved (n = 7) | P Value | |
|---|---|---|---|
| Age (y) | 55.6 ± 11.2 | 54.3 ± 16.6 | .801 |
| Axial length (mm) | 23.8 ± 1.1 | 23.2 ± 1.2 | .259 |
| Subfoveal choroidal thickness (μm) | 384.8 ± 113.8 | 438.9 ± 101.9 | .229 |
| Vascular area (%) | |||
| Microvasculature (3 × 3 mm) | 53.6 ± 2.5 | 52.6 ± 2.0 | .293 |
| Large choroidal vessels (3 × 3 mm) | 67.0 ± 7.3 | 66.5 ± 6.8 | .871 |
| Microvasculature (6 × 6 mm) | 54.0 ± 1.7 | 53.6 ± 1.8 | .583 |
| Large choroidal vessels (6 × 6 mm) | 64.7 ± 7.4 | 65.7 ± 7.1 | .748 |
Stay updated, free articles. Join our Telegram channel

Full access? Get Clinical Tree


