Purpose
To evaluate the diagnostic performance of a 3-dimensional (3D) neuroretinal rim parameter, the minimum distance band (MDB), using optical coherence tomography (OCT) high-density volume scans for open-angle glaucoma.
Design
Reliability analysis.
Methods
setting : Institutional. study population : Total of 163 patients (105 glaucoma and 58 healthy subjects). observation procedures : One eye of each patient was included. MDB and retinal nerve fiber layer (RNFL) thickness values were determined for 4 quadrants and 4 sectors using a spectral-domain OCT device. main outcome measures : Area under the receiver operating characteristic curve (AUROC) values, sensitivities, specificities, and positive and negative predictive values.
Results
The best AUROC values of 3D MDB thickness for glaucoma and early glaucoma were for the overall globe (0.969, 0.952), followed by the inferior quadrant (0.966, 0.949) and inferior-temporal sector (0.966, 0.944), and then followed by the superior-temporal sector (0.964, 0.932) and superior quadrant (0.962, 0.924). All 3D MDB thickness AUROC values were higher than those of 2D RNFL thickness. Pairwise comparisons showed that the diagnostic performance of the 3D MDB parameter was significantly better than 2D RNFL thickness only for the nasal quadrant and inferior-nasal and superior-nasal sectors ( P = .023–.049). Combining 3D MDB with 2D RNFL parameters provided significantly better diagnostic performance (AUROC 0.984) than most single MDB parameters and all single RNFL parameters.
Conclusions
Compared with the 2D RNFL thickness parameter, the 3D MDB neuroretinal rim thickness parameter had uniformly equal or better diagnostic performance for glaucoma in all regions and was significantly better in the nasal region.
Glaucoma is characterized by the loss of retinal ganglion cells and their axons, resulting in structural changes of the optic nerve head (ONH) and functional visual field (VF) loss. The diagnosis of glaucoma relies on structural and functional assessments, which have traditionally included disc photography and visual field testing. While informative, these methods rely on subjective interpretations, have high interrater variability, and provide little quantitative data.
The introduction of new imaging modalities, such as spectral-domain optical coherence tomography (SDOCT), have enabled more objective, reliable, and quantitative assessments of glaucoma. Measurements of the ONH, peripapillary retinal nerve fiber layer (RNFL), and macular ganglion cell region are useful structural surrogates for glaucomatous nerve loss. Of these parameters, the 2-dimensional (2D) RNFL thickness measurement is the most widely used clinically. Despite its good-to-excellent diagnostic performance, RNFL thickness measurements have limitations, including a high frequency of SDOCT-related imaging artifacts. Furthermore, RNFL thickness testing has high false-positive rates of up to 26.2%–39%, especially in patients with longer axial lengths and smaller disc areas.
Because of the limitations of current 2D glaucoma imaging parameters, novel 3-dimensional (3D) neuroretinal rim parameters have been described and include the minimum distance band (MDB), which is derived from high-density volume scans. The MDB is the 3D region delimited by the shortest distances between the internal limiting membrane (ILM) and the optic disc margin, which is presumed to be the retinal pigment epithelium/Bruch membrane (RPE/BM) complex termination. MDB thinning may be a proxy for nerve loss, since all retinal ganglion axons pass through the MDB to reach the brain and since more than 90% of the tissue in the MDB region is estimated to consist of ganglion cell nerve axons.
The 3D MDB thickness parameter has several advantages over other SDOCT neuroretinal rim parameters. One advantage is that the MDB is measured perpendicular to the trajectory of nerve axons, factoring in the rim tissue’s variable orientation. Second, MDB thickness defines the OCT-derived optic disc margin using the RPE/BM complex termination, an objective and easily identifiable anatomic landmark in OCT. By contrast, traditional neuroretinal rim parameters (eg, cup-to-disc ratio, rim area) define the optic disc margin as the clinical optic disc margin, which is based on a subjective evaluation of the ONH. Reis and associates have shown that the clinical optic disc margin corresponds poorly with a single consistent anatomic structure in SDOCT, such that “current rim measurements lack a solid anatomical foundation.” , a finding that has been supported by other investigators.
Current optic nerve parameters are derived from low-density scan protocols, and to date, no published studies have evaluated the diagnostic accuracy of the MDB thickness parameter using high-density 3D volume scans. Since volume scans enable denser sampling of nerve tissue and 3D reconstruction of neuroretinal rim anatomy compared with conventional 2D scans, we hypothesized that 3D volume scans would have improved diagnostic performance for glaucoma. The aims of this study were to evaluate the diagnostic performance of the 3D MDB thickness parameter using high-density volume scans and to compare the diagnostic performance of MDB thickness with that of 2D RNFL thickness. We also assessed the diagnostic performance of combinations of MDB and RNFL parameters compared with single MDB and RNFL parameters alone.
Methods
Participants and Examinations
The study was approved by the Massachusetts Eye and Ear Infirmary Institutional Review Board. Informed consent was obtained, and all methods adhered to the Health Insurance Portability and Accountability Act. Study participants were recruited from the Massachusetts Eye and Ear Infirmary Glaucoma Service between September 1, 2009 and July 31, 2014. Complete eye examinations were performed by 1 glaucoma specialist (T.C.C.) and consisted of history, visual acuity testing, refraction, Goldmann applanation tonometry, slit-lamp biomicroscopy, gonioscopy, ultrasonic pachymetry, dilated ophthalmoscopy, stereo disc photography (Visucam Pro NM; Carl Zeiss Meditec, Inc., Dublin, California), VF testing (Swedish Interactive Threshold Algorithm 24-2 test of the Humphrey visual field analyzer 750i, Carl Zeiss Meditec, Inc.), and volume scans using Spectralis OCT (HRA/Spectralis software version 5.4.8.0, Heidelberg Engineering GmbH, Heidelberg, Germany).
The study population consisted of participants with and without glaucoma with a spherical equivalent between −5.0 and +5.0 diopters and reliable VF test results with ≤33% fixation losses, ≤20% false-positive results, and ≤20% false-negative results. Exclusion criteria were discernible congenital anomalies of the anterior chamber, corneal scarring or opacities, severe nonproliferative or proliferative diabetic retinopathy, any disease that could independently affect VF, VF loss attributable to a non-glaucoma condition (eg, trauma), or a dilated pupil diameter of less than 2 mm.
Open-angle glaucoma was defined as characteristic optic nerve changes with corresponding VF defects. A VF was abnormal if 3 or more contiguous test locations in the pattern deviation plot were depressed by ≥5 dB. Glaucoma was also diagnosed if 2 or more contiguous test locations had defects with 1 location depressed by ≥5 dB and the other by ≥10 dB. Test locations on the pattern deviation plot’s outer rim were excluded to avoid rim artifacts. Patients with primary open-angle, normal tension, pseudoexfoliation, and pigmentary glaucoma with best-corrected visual acuities of 20/70 or better were included. VF abnormalities were classified as early (mean deviation [MD] >−6 dB), moderate (−12 dB < MD ≤ −6 dB), or severe (MD ≤−12 dB).
Normal subjects had no ocular disease except for mild cataracts, normal VF test results defined by a pattern standard deviation (PSD) of more than 5%, normal glaucoma hemifield test results, best-corrected visual acuities of 20/40 or better, and no cup-to-disc asymmetry of greater than 0.2 between eyes. If both eyes were eligible, 1 eye was selected using a random number generator. Investigators were masked to the OCT results at the time of participant selection.
Image Acquisition and Automated Segmentation
After pupillary dilation, each eye underwent peripapillary RNFL thickness scans and 20 × 20-degree volume scans centered on the ONH using the Spectralis SDOCT machine. For volume scans, 193 frames were taken with the high-speed rate. Three averages were acquired per frame with the automatic real-time function activated, enabling the acquisition of multiple frames at the same scan location and the averaging of the frames to reduce noise and eye motion artifacts. Scans meeting the following criteria were included for analysis: signal strengths of 15 dB or more (range: 0–40 dB), clear fundus images with good optic disc and scan circle visibility before and during image acquisition, visible RNFLs without interruptions, and continuous scan patterns without missing or blank areas. Details of the Spectralis SDOCT technique have been described elsewhere.
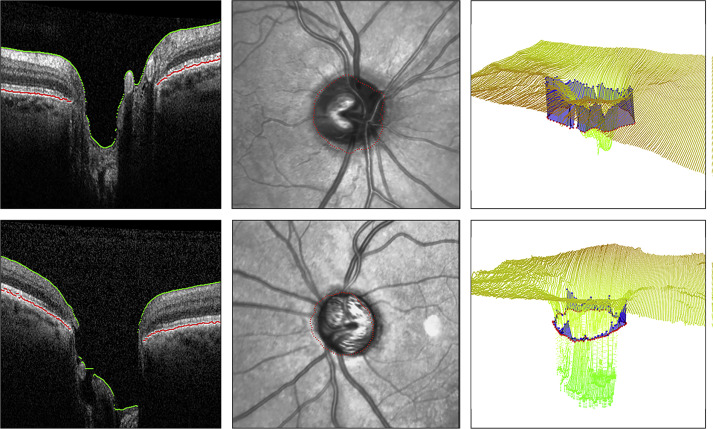
Two-dimensional RNFL thickness values were extracted from Spectralis SDOCT RNFL printouts and calculated globally and sectorally as means. Three-dimensional volumetric data were downloaded as series of images in PNG format. The program to determine the MDB was coded in C++ using the Open Computer Vision (OpenCV, Intel Corporation, Santa Clara, California), Insight Segmentation and Registration Toolkit (ITK, Insight Software Consortium, Clifton Park, New York), and Visualization Toolkit (VTK, Kitware Inc, Clifton Park, New York) libraries (E.T.). The optic disc margin, presumed to be the termination of the RPE/BM complex, was represented by 100 points spaced by 3.6 degrees. Segmented images were manually reviewed. Frames with acquisition artifacts or algorithm errors were discarded. The accuracy of the optic disc rim in OCT images was verified by superimposing the points on an infrared reflectance (IR) image of the ONH. The reconstructed ILM and RPE/BM complex were manually inspected in 3D for errors. Eyes were excluded when the RPE/BM complex was incompletely identified owing to noisy data or prominent blood vessels, leading to more than 5 consecutive errors over the ONH. The optic disc center was automatically determined from IR fundus photographs and OCT scans. Images were automatically segmented with an internally developed program to delineate the RPE/BM complex and the ILM ( Figure ). An internal algorithm calculated MDB thickness values using the distances between points along the RPE/BM complex termination and the closest corresponding points on the ILM. MDB thickness values were calculated for the overall globe (360 degrees), 90-degree quadrants (inferior, superior, nasal, and temporal), and 45-degree sectors (inferior-nasal [IN], superior-nasal [SN], inferior-temporal [IT], and superior-temporal [ST]).
Statistical Analysis
Statistical analyses were performed with SAS 9.4 (SAS Institute Inc, Cary, North Carolina, USA). Descriptive characteristics were reported as mean ± standard deviation for continuous variables and frequency count (%) for categorical variables. Student t tests were used to compare continuous variables and χ 2 tests for categorical variables. P values of <.05 established statistical significance.
The diagnostic performances of 2D RNFL and 3D MDB parameters were determined using receiver operating characteristic (ROC) curves and calculating areas under the ROC curves (AUROC). An optimal cutoff value was selected using the Youden index value that maximized the value of “sensitivity + specificity − 1.” Sensitivity, specificity, positive predictive values (PPV), and negative predictive values (NPV) were calculated using these cutoff values. Pairwise comparisons of AUROC values were performed to compare accuracy between measurements. Diagnostic test performance was classified as excellent (for AUROC values of 0.90–1.00), good (0.80–0.90), fair (0.70–0.80), and poor (0.60–0.70).
Stepwise logistic regression was used to identify the best combinations of MDB and RNFL parameters for glaucoma diagnosis. The combinations of MDB parameters, RNFL parameters, and MDB and RNFL parameters that yielded the highest AUROC values were determined. The AUROC of the best combination of MDB and RNFL parameters was compared with that of the best combinations of MDB parameters and RNFL parameters.
Results
The study consisted of 163 participants, of which 105 were glaucoma patients and 58 were healthy controls ( Table 1 ). Of the 105 glaucoma patients, 70 (66.7%) had primary open-angle glaucoma, 13 (12.4%) had normal tension glaucoma, 14 (13.3%) had pseudoexfoliation glaucoma, and 8 (7.6%) had pigmentary glaucoma. Severity of VF defects was distributed, with 31 of the 105 patients (29.5%) having early VF defects, 31 (29.5%) having moderate VF defects, and 43 (41.0%) having severe VF defects. The glaucoma group and early glaucoma group were significantly older ( P < .0001) and had a smaller proportion of female patients ( P = .004, P = .029) than the control group ( Table 1 ). Compared with the control group, the glaucoma group and the early glaucoma group had significantly thinner MDB values in all quadrants and sectors ( P < .0001; Table 2 ).
| Normal | Glaucoma | P a | Early Glaucoma | P b | |
|---|---|---|---|---|---|
| Number of eyes | 58 | 105 | 31 | ||
| Number of right eyes/left eyes | 32/26 | 53/52 | .566 | 21/10 | .250 |
| Mean age (y) | 54.3 ± 15.5 | 68.0 ± 11.9 | <.0001 | 68.9 ± 9.8 | <.0001 |
| Sex (% female) | 69.0 | 45.7 | .004 | 45.2 | .029 |
| Race (%) | .152 | .107 | |||
| African American | 13.8 | 21.0 | 12.9 | ||
| Asian | 8.6 | 3.8 | 9.7 | ||
| White | 65.5 | 65.7 | 71.0 | ||
| Hispanic | 12.1 | 5.7 | 0 | ||
| Other | 0 | 3.8 | 6.5 | ||
| Refractive error (D) | |||||
| Spherical equivalent | −0.07 ± 1.73 | −0.23 ± 1.71 | .572 | −0.02 ± 1.73 | .899 |
| Visual field | |||||
| Mean deviation (dB) | −1.42 ± 1.93 | −11.89 ± 7.58 | <.0001 | −3.72 ± 1.45 | <.0001 |
| Pattern standard deviation (dB) | 1.52 ± 0.29 | 8.35 ± 3.20 | <.0001 | 4.96 ± 1.74 | <.0001 |
| Neuroretinal Rim Minimum Distance Band (MDB) Location | Normal Mean ± SD (μm) | Glaucoma a Mean ± SD (μm) | Early Glaucoma a Mean ± SD (μm) |
|---|---|---|---|
| Global | 307.5 ± 41.2 | 171.0 ± 51.5 | 203.6 ± 44.3 |
| Inferior | 341.6 ± 52.0 | 167.5 ± 62.0 | 195.3 ± 62.5 |
| Superior | 337.7 ± 53.8 | 178.6 ± 66.2 | 222.1 ± 61.2 |
| Nasal | 312.4 ± 49.5 | 189.7 ± 67.9 | 228.7 ± 63.0 |
| Temporal | 239.4 ± 45.1 | 148.6 ± 50.0 | 168.4 ± 46.4 |
| IN | 359.6 ± 57.4 | 191.9 ± 71.1 | 226.3 ± 64.7 |
| SN | 349.0 ± 59.2 | 192.7 ± 73.3 | 231.2 ± 69.8 |
| IT | 323.5 ± 56.3 | 142.9 ± 63.3 | 163.6 ± 71.9 |
| ST | 335.8 ± 51.5 | 169.7 ± 69.6 | 214.1 ± 65.1 |
The MDB’s diagnostic capability was evaluated by calculating AUROC values for glaucoma and early glaucoma patients ( Table 3 ). For glaucoma, the best diagnostic performances for the MDB were for the overall globe (AUROC 0.969; 95% confidence interval [CI] 0.945–0.993), followed by the inferior quadrant (0.966; 95% CI 0.937–0.995) and IT sector (0.966; 95% CI 0.939–0.994), and then followed by the ST sector (0.964; 95% CI 0.939–0.998) and superior quadrant (0.962; 95% CI 0.936–0.987). Diagnostic cutoff values for the 3 best MDB parameters, as determined by the Youden index, were 233.9 μm for the overall globe, 262.7 μm for the inferior quadrant, and 240.9 μm for the IT sector. For these cutoffs, the respective sensitivities and specificities for the identification of glaucoma were 89.5% and 96.6% for the overall globe, 92.4% and 96.6% for the inferior quadrant, and 91.4% and 96.6% for the IT sector ( Table 4 ).
| Location of Optical Coherence Tomography Parameter | Glaucoma Group (AUROC [SE]) | P a | Early Glaucoma Group (AUROC [SE]) | P b | P c |
|---|---|---|---|---|---|
| MDB thickness from volume scans | |||||
| Global | 0.969 (0.0122) | .313 | 0.952 (0.0209) | .377 | |
| Inferior | 0.966 (0.0146) | .529 | 0.949 (0.0248) | .515 | |
| Superior | 0.962 (0.0131) | .144 | 0.924 (0.0285) | .270 | |
| Nasal | 0.916 (0.0214) | .023 | 0.848 (0.0417) | .084 | |
| Temporal | 0.907 (0.0258) | .177 | 0.870 (0.0427) | .084 | |
| IN | 0.951 (0.0179) | .049 | 0.923 (0.0297) | .084 | |
| SN | 0.942 (0.0176) | .023 | 0.900 (0.0336) | .111 | |
| IT | 0.966 (0.0141) | .529 | 0.944 (0.0287) | .536 | |
| ST | 0.964 (0.0126) | .089 | 0.932 (0.0264) | .084 | |
| RNFL thickness | |||||
| Global | 0.954 (0.0156) | 0.928 (0.0262) | |||
| Inferior | 0.958 (0.0142) | 0.929 (0.0299) | |||
| Superior | 0.936 (0.0181) | 0.882 (0.0364) | |||
| Nasal | 0.820 (0.0329) | 0.711 (0.0607) | |||
| Temporal | 0.858 (0.0294) | 0.756 (0.0593) | |||
| IN | 0.898 (0.0232) | 0.824 (0.0460) | |||
| SN | 0.869 (0.0271) | 0.815 (0.0477) | |||
| IT | 0.958 (0.0150) | 0.924 (0.0345) | |||
| ST | 0.932 (0.0207) | 0.868 (0.0388) | |||
| Best combinations | |||||
| Inferior MDB, ST MDB, SN MDB, and inferior RNFL | 0.984 (0.0091) | ||||
| Inferior MDB, ST MDB, and SN MDB | 0.981 (0.0093) | .319 | |||
| Inferior RNFL and ST RNFL | 0.966 (0.0138) | .018 |
a MDB AUROC value vs. AUROC value of corresponding RNFL thickness measurement in glaucoma.
b MDB AUROC value vs. AUROC value of corresponding RNFL thickness measurement in early glaucoma.
c MDB AUROC value vs. AUROC value of the and-logic combination of inferior MDB, ST MDB, SN MDB, and inferior RNFL.
| Neuroretinal Rim (MDB) Location | Sensitivity (CI) | Specificity (CI) | PPV (CI) | NPV (CI) | Sensitivity at Fixed 95% Specificity |
|---|---|---|---|---|---|
| Global | 89.5 (83.7–95.4) | 96.6 (91.9–100.0) | 98.0 (95.1–100.0) | 83.6 (74.7–92.5) | 89.5 (71.5–96.7) |
| Inferior | 92.4 (87.3–97.5) | 96.6 (91.9–100.0) | 98.0 (95.2–100.0) | 87.5 (79.4–95.6) | 92.4 (76.4–97.8) |
| Superior | 91.4 (86.1–96.8) | 89.7 (81.8–97.5) | 94.1 (89.6–98.7) | 85.3 (76.4–94.2) | 76.2 (53.3–90.0) |
| Nasal | 78.1 (70.2–86.0) | 93.1 (86.6–99.6) | 95.4 (90.9–99.8) | 70.1 (59.9–80.4) | 71.4 (48.0–87.2) |
| Temporal | 86.7 (80.2–93.2) | 89.7 (81.8–97.5) | 93.8 (89.0–98.6) | 78.8 (68.9–88.7) | 65.7 (42.0–83.5) |
| IN | 89.5 (83.7–95.4) | 93.1 (86.6–99.6) | 95.9 (92.0–99.8) | 83.1 (74.0–92.2) | 83.8 (63.0–94.0) |
| SN | 88.6 (82.5–94.7) | 91.4 (84.2–98.6) | 94.9 (90.5–99.3) | 81.5 (72.1–91.0) | 71.4 (47.9–87.2) |
| IT | 91.4 (86.1–96.8) | 96.6 (91.9–100.0) | 98.0 (95.2–100.0) | 86.2 (77.8–94.6) | 91.4 (74.7–97.5) |
| ST | 87.6 (81.3–93.9) | 93.1 (86.6–99.6) | 95.8 (91.8–99.8) | 80.6 (71.1–90.1) | 79.0 (56.8–91.6) |
For early glaucoma, the highest-ranked AUROC values for the MDB were also for the overall globe (0.952; 95% CI 0.911–0.993), followed by the inferior quadrant (0.949; 95% CI 0.900–0.998) and IT sector (0.944; 95% CI 0.888–1.000), and then followed by the ST sector (0.932; 95% CI 0.880–0.984) and superior quadrant (0.924; 95% CI 0.869–0.980; Table 3 ). Optimal early glaucoma diagnostic cutoff values were 270.1 μm for the overall globe, 262.3 μm for the inferior quadrant, and 236.2 μm for the IT sector. For these cutoffs, the sensitivities and specificities for identification of early glaucoma were 96.8% and 84.5% for the overall globe, 87.1% and 96.6% for the inferior quadrant, and 83.9% and 96.6% for the IT sector, respectively ( Table 5 ).
| MDB Location | Sensitivity (CI) | Specificity (CI) | PPV (CI) | NPV (CI) | Sensitivity at Fixed 95% Specificity |
|---|---|---|---|---|---|
| Global | 96.8 (90.6–100.0) | 84.5 (75.2–93.8) | 76.9 (63.7–90.2) | 98.0 (94.1–100.0) | 77.4 (49.4–92.3) |
| Inferior | 87.1 (75.3–98.9) | 96.6 (91.9–100.0) | 93.1 (83.9–100.0) | 93.3 (87.0–99.7) | 87.1 (61.0–96.7) |
| Superior | 93.6 (84.9–100.0) | 82.8 (73.0–92.5) | 74.4 (60.7–88.1) | 96.0 (90.6–100.0) | 48.4 (23.5–74.1) |
| Nasal | 67.7 (51.3–84.2) | 87.9 (79.6–96.3) | 75.0 (59.0–91.0) | 83.6 (74.3–92.9) | 41.9 (19.0–69.0) |
| Temporal | 80.7 (66.7–94.6) | 89.7 (81.8–97.5) | 80.7 (66.7–94.6) | 89.7 (81.8–97.5) | 45.2 (21.2–71.6) |
| IN | 80.7 (66.7–94.6) | 93.1 (86.6–99.6) | 86.2 (73.7–98.8) | 90.0 (82.4–97.6) | 74.2 (45.9–90.7) |
| SN | 80.7 (66.7–94.6) | 91.4 (84.2–98.6) | 83.3 (70.0–96.7) | 89.8 (82.1–97.5) | 48.4 (23.5–74.1) |
| IT | 83.9 (70.9–96.8) | 96.6 (91.9–100.0) | 92.9 (83.3–100.0) | 91.8 (84.9–98.7) | 83.9 (56.9–95.4) |
| ST | 96.8 (90.6–100.0) | 81.0 (71.0–91.1) | 73.2 (59.6–86.7) | 97.9 (93.9–100.0) | 58.0 (31.0–81.0) |
To compare 3D MDB with 2D RNFL, we determined the diagnostic performance of the traditional RNFL thickness parameter for glaucoma ( Table 6 ) and early glaucoma ( Table 7 ). For both glaucoma and early glaucoma, the MDB parameters had AUROC values greater than those of the corresponding RNFL parameters ( Table 3 ). Even though all MDB AUROC values were higher than those of the RNFL thickness parameters, a pairwise comparison of MDB and corresponding RNFL parameters showed that, for glaucoma, the differences were only statistically significant in the nasal quadrant ( P = .023), as well as in the SN ( P = .023) and IN ( P = .049) sectors. The AUROC values of other corresponding MDB and RNFL parameters differed nonsignificantly for glaucoma and early glaucoma ( Table 3 ).


