Purpose
To quantify density of macular vascular networks over regions of interest in healthy subjects using optical coherence tomography angiography (OCTA).
Design
Prospective cross-sectional study.
Methods
Setting was the Retina and Oncology Services of Wills Eye Hospital. Subjects with no known systemic disease and without retinal pathology were included. OCTA was performed on a 3 × 3-mm region centered on the macula and en face angiograms of the superficial and deep vascular networks were acquired. Vascular density was calculated using an automated image thresholding method over regions of interest. Foveal and parafoveal vascular density were calculated. The differences between vascular networks, sexes, and fellow eyes and correlation between vascular density, signal strength, and age, as well as reproducibility of measurements, were evaluated.
Results
A total of 198 healthy eyes were imaged, from which 163 eyes of 122 subjects were included based on image quality criteria. In the parafoveal region, deep vascular density was significantly higher than the superficial (52% ± 2.4% vs 46% ± 2.2%; P < .001), whereas the opposite was found in the foveal region (27% ± 5.2% vs 32% ± 3.2%; P < .001). All vascular density measurements were statistically similar in fellow eyes and there was no sex difference ( P > .05). There was a negative correlation between vascular density and age that persisted upon adjusting for signal strength. Vascular density measurements were highly correlated between separate imaging sessions with intraclass correlation coefficients of over 0.85 for all assessments.
Conclusions
Calculation of vascular density using OCTA is a reproducible and noninvasive method to quantitate individual networks within the macula. Understanding normal values and their correlations could affect clinical evaluation of the macula in healthy patients and disease states.
Histologic and anatomic studies of human retinal vessels have identified morphologically distinct vascular networks. The anatomic configuration of each network may be characterized by the unique metabolic demands of the regional neuronal milieu. Given these differences, the vulnerability of these networks to vascular disease is not uniform, and selective alteration to vascular networks in the perifovea has previously been reported. Spaide and associates speculated that it is possible that certain disease states, particularly those that involve perfusion, could affect one layer differently from the other. Therefore, quantification of vascular networks in healthy eyes is an important initial step for understanding vascular pathobiology with potential clinical implications.
Quantitative measurements of retinal vasculature in the healthy eye have been reported using several in vivo and in vitro techniques, including confocal microscopy, adaptive optics, fluorescein angiography (FA), and speckle-variance (svOCT) and swept-source optical coherence tomography (ssOCT) angiography. Most of these studies have a small sample size and limited age range. In addition, consensus regarding the preferred method to measure and quantify retinal vascular networks remains a matter of debate.
OCT angiography (OCTA) is a new imaging technology that allows for fast, noninvasive assessment of microvascular perfusion across the macular region, offering the potential to perform quantitative assessment. As with all OCT-based technology, 3-dimensional, cross-sectional imaging of the retina is possible with micrometer-scale depth resolution.
In the present study, we used OCTA and the split-spectrum amplitude-decorrelation angiography algorithm to quantify density of retinal vascular networks in a large sample of healthy subjects. Using an automated image thresholding method, foveal and parafoveal vascular density were assessed and compared to prior published values.
Methods
This study was performed at the Retina Service and Oncology Service of Wills Eye Hospital (Philadelphia, Pennsylvania, USA) from November 20, 2014 to July 13, 2015. Eyes of subjects with no known systemic disease and without retinal pathology on fundus examination were included in the study. The Institutional Review Board of Wills Eye Hospital approved the research protocol and written informed consent was obtained.
All eyes underwent imaging with a commercial spectral-domain OCTA system (RTVue-XR Avanti; Optovue, Fremont, California, USA). The device has an A-scan rate of 70 000 scans per second, using a light source centered on 840 nm and a bandwidth of 45 nm. The tissue resolution is 5 μm axially, and there is a 22-μm beam width. The exposure power at the pupil of 750 μW was used in accordance with the safety limits set by the American National Standards Institute. During each imaging session, 2 sets of OCTA scans were obtained from a 3 × 3-mm region centered on the macula. Each set contained a horizontal-priority (x-fast) and vertical-priority (y-fast) raster scan. In each scan direction, the B-scan contained 304 A-scan lines covering 3 mm. Two consecutive B-scans were done at each location to compute inter–B-scan decorrelation with the split-spectrum amplitude-decorrelation angiography algorithm. Altogether, each volumetric scan consisted of 608 B-scans acquired in 2.9 seconds.
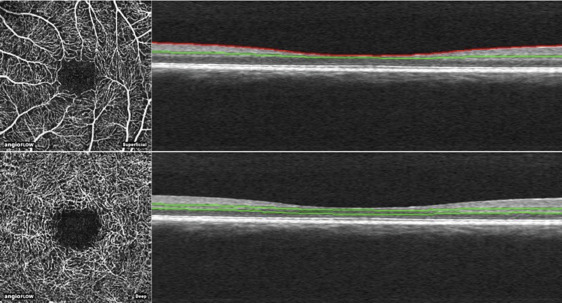
To average the consecutive B-scans, the horizontal-priority and vertical-priority scans were combined using an orthogonal registration algorithm that removes bulk motion and generates a merged OCT image volume with reduced motion artifacts. Using this volumetric information, the retinal layers were segmented between the inner limiting membrane and the retinal pigment epithelium. En face OCT angiograms with 304 × 304-pixel dimensions were produced by maximum decorrelation (ie, flow) projection between the segmentation lines. Automated segmentation was performed using the built-in software offset settings (version 2014.2.0.93). We included images obtained from 2 layers, namely the superficial and deep retinal vascular networks, in our analysis ( Figure 1 ). The boundaries for superficial network extended from 3 μm below the internal limiting membrane to 15 μm below the inner plexiform layer (IPL). The deep capillary network boundaries were from 15 to 70 μm below the IPL.
Two independent graders (A.S., W.S.) reviewed the images. Poor-quality images were identified and excluded based on the following criteria: (1) evidence of poor fixation, including double vessel pattern and motion artifacts; (2) presence of blink artifacts with a width of more than 5 pixels; (3) media opacity, marked by shadowing or obscuration of vessel signal in the field of view or a signal strength index less than 50; (4) segmentation error in outlining vascular networks.
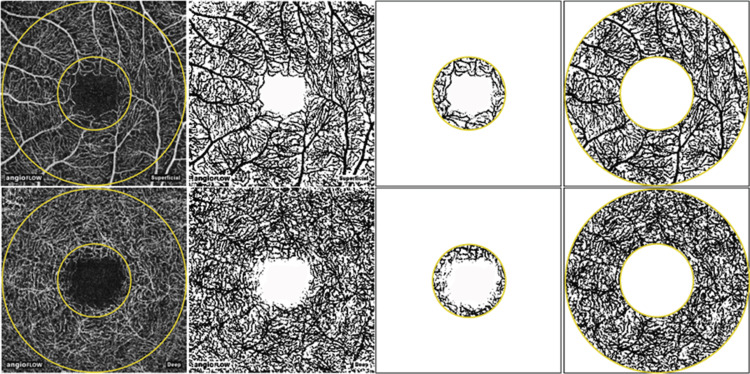
Image processing and vascular density measurement were performed using the public domain ImageJ software, version 1.49 (National Institutes of Health, Bethesda, Maryland, USA). Binary images of vascular networks were created using an automated thresholding algorithm ( Figure 2 ). Vascular density was defined as the percentage area occupied by blood vessels, with the blood vessels being defined as pixels having values above threshold level. This was calculated over 2 regions of interest including the foveal and parafoveal regions. The foveal region was defined as a central circle with a 120-pixel (≈1.2 mm) diameter and the parafoveal region was defined as a ring 91 pixels wide surrounding the foveal region.
Statistical analyses were performed with SPSS, Version 20 (SPSS, Inc, Chicago, Illinois, USA). The independent samples t test was used to determine differences between vascular networks or sexes. Paired samples t test was used to evaluate differences between fellow eyes. Correlation between vascular density and age was determined using the Pearson correlation coefficient. In order to assess reproducibility of measurements, intraclass correlation coefficients with 95% confidence intervals were calculated for subjects that had been scanned on 2 separate sessions. The significance level was set at 5% for all analyses.
Results
A total of 198 eyes were imaged during the study timeframe. Based on the criteria set for image quality, 163 eyes of 122 subjects were included in the study. The mean age of subjects was 41.1 ± 16.46 years (median, 33.5; range, 12-78 years). Our study sample consisted of 46 (37.7%) male and 76 (62.3%) female subjects.
Representative OCT angiograms of the superficial and deep vascular networks and quantification of retinal vascular density as determined by the ImageJ thresholding algorithm are depicted in Figure 2 . Fine capillary details were transformed to black pixel signals and region-specific vascular patterns were observed in accordance with previous qualitative findings.
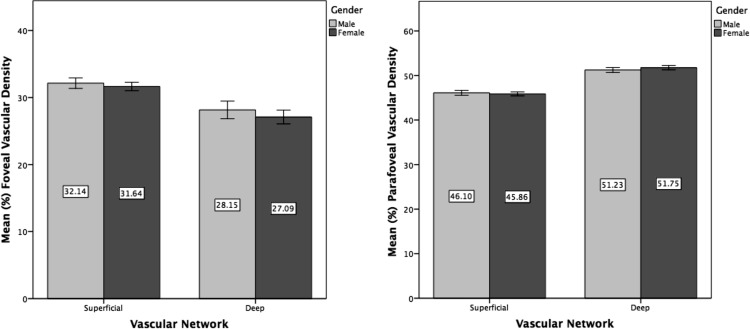
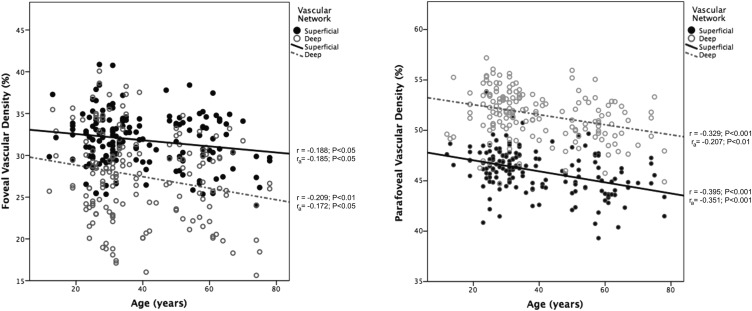
Results of macular vascular density assessment in the foveal and parafoveal regions are summarized in Table 1 . In the parafoveal region, deep vascular density was significantly higher than the superficial (52% ± 2.4% vs 46% ± 2.2%; P < .001), whereas the opposite was found in the foveal region (27% ± 5.2% vs 32% ± 3.2%; P < .001). All vascular density measurements were statistically similar when comparing fellow eyes ( P > .05) ( Table 2 ). There was no sex difference in any of the density indices, as shown in Figure 3 ( P > .05). The signal strength index of obtained scans decreased with increased age, as assessed by the Pearson coefficient (r = -0.353; P < .001). There was a negative correlation between vascular density and age, which persisted after adjusting for signal strength index ( Figure 4 ).
| Superficial Vascular Network | Deep Vascular Network | P Value a | |
|---|---|---|---|
| Foveal vascular density, % ± SD (median, range) | 31.86 ± 3.183 (31.97, 24.00-40.87) | 27.48 ± 5.199 (22.78, 15.63-40.07) | <.001 |
| Parafoveal vascular density, % ± SD (median, range) | 45.96 ± 2.174 (46.21, 39.31-53.85) | 51.57 ± 2.392 (51.78, 44.70-57.20) | <.001 |
| Right Eye | Left Eye | P Value a | |
|---|---|---|---|
| Superficial vascular network | |||
| Foveal vascular density, % (SD) | 31.79 (3.073) | 31.70 (2.95) | .762 |
| Parafoveal vascular density, % (SD) | 46.61 (2.291) | 46.17 (1.552) | .195 |
| Deep vascular network | |||
| Foveal vascular density, % (SD) | 27.48 (5.403) | 27.76 (5.506) | .297 |
| Parafoveal vascular density, % (SD) | 52.26 (2.205) | 52.62 (1.873) | .205 |
Reproducibility of measurements was assessed in 11 subjects who had images from 2 separate sessions. Accordingly, vascular density measurements were highly correlated between separate imaging sessions, with intraclass correlation coefficients of over 0.85 for all assessments ( Table 3 ).


