Fig. 4.1
Corneal layers as imaged with the confocal microscope. Corneal epithelium: seen with bright nuclei, (a); subbasal nerve plexus, (b); corneal stroma with keratocytes, (c); corneal endothelium with hexagonal cell borders, (d)
The depth of each image within the cornea may also be recorded. This can help determine the depth of scars, foreign bodies, or location of infectious agents within the tissue.
Other uses of confocal microscopic imaging of the anterior segment has included imaging of the conjunctiva, lids, and corneoscleral limbus (Pichierri et al. 2008; Patel et al. 2006).
4.2.3 Clinical Uses
One of the major advantages of confocal microscopy is the ability to perform in vivo imaging without the need to mechanically section the cornea or use of stains or dyes (Lemp et al. 1985). The confocal microscopy examination can be performed comfortably on a cooperative patient in the clinical setting. The use of confocal microscopy has been described in many pathological conditions including infection, hereditary disorders (dystrophies), refractive, surgical, and other miscellaneous uses (Cavanagh et al. 1993). In clinical practice, confocal microscopy has been used to identify Acanthamoeba cysts and trophozoites, bacteria, fungi, and other pathogens within the cornea. In clinical research, it can be used for evaluation of responses and complications after refractive procedures, corneal wound healing processes, and a variety of corneal diseases.
Confocal microscopy has been shown to be useful in the diagnosis of Acanthamoeba keratitis (Mathers et al. 2000). The appearance of the cystic form of the organism is distinct using this imaging modality. The cyst is a double-walled hexagonal, hyper-reflective structure measuring approximately 10–30 μm in diameter. There may be a surrounding lucent area, representing a microcavitation of the stroma (Fig. 4.2). The trophozoite form can also be seen; however, it is more difficult to discern from surrounding normal keratocyte nuclei. Uniquely, the organism has been shown to be associated with corneal nerves, representing a radial keratoneuritis (Pfister et al. 1997). Confocal microscopy can also help guide the clinician in the treatment response in this notoriously difficult to treat condition.
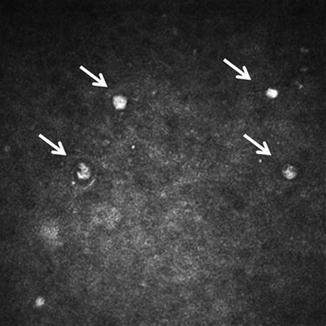
Fig. 4.2
Group of Acanthamoeba cysts in the epithelium (arrows). Note the hyper-reflective Amoeba with a lucent area and a surrounding bright halo
Fungal keratitis has also been explored with the confocal microscope. The organisms are characterized by hyper-reflective filaments or budding forms (Fig. 4.3). The filaments appear to spread parallel to the surface of the cornea, possibly along the lamella of the cornea. There appears to be a role for confocal microscopy for diagnostic purposes (Winchester et al. 1997) especially in cases of deep infection, where a simple culture is not possible.
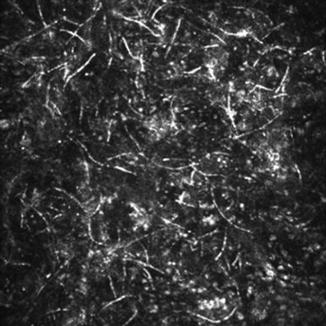
Fig. 4.3
Fungal filaments as imaged by confocal microscopy. Note the hyper-reflective filamentous elements. This fungus was identified as Alternaria species, by culture
Due to the small size, most bacteria types cannot be distinguished by confocal microscopy. On exception is the filamentous bacteria, Nocardia asteroids, which appears as a hyper-reflective beaded, branching filaments. The branching typically occurs at right angles (Vaddavalli et al. 2006). Aggregates of bacteria have also been seen (Kaufman et al. 1996).
Although viruses cannot be visualized, the inflammatory patterns that accompany many such infections have been described. The subepithelial infiltrates seen after epidemic keratoconjunctivitis can be seen as hyper-reflective Langerhans cells in the basal epithelium and anterior stroma. Hyper-reflective fusiform cells (activated keratocytes) and round cells (inflammatory cells) have been reported in herpes simplex keratitis (Rosenberg et al. 2002).
Confocal microscopy has been used to evaluate postoperative complications in ophthalmic surgery. Examples include epithelial downgrowth after penetrating keratoplasty (Chen et al. 2013) and confirmation of retained Descemet’s membrane following penetrating keratoplasty (McVeigh et al. 2013). In epithelial downgrowth, the observer would look for round hyper-reflective nuclei consistent with the epithelium at the level of the endothelium. After penetrating keratoplasty, a decrease in the density of cells at every level of the transplanted cornea has been reported (Niederer et al. 2007).
In the setting of refractive surgery, confocal microscopy has been used to study wound healing as well as surgical complications (Kaufman and Kaufman 2006). Corneal haze after phototherapeutic keratectomy (PRK) has been shown to be correlated with the presence of activated keratocytes (Moller-Pederson et al. 2000). Larger treatments with deeper ablations were noted to have increased numbers of activated keratocytes that remained activated longer. Corneal nerve density has been shown to significantly decrease after PRK but recovered by 24 months to presurgical levels (Erie 2003).
In laser-assisted in situ keratomileusis (LASIK), corneal nerve density has been shown to decrease significantly after 1, 2, and 3 years, not recovering to near preoperative densities until 5 years after surgery (Erie et al. 2005). This may be a significant cause of dry eye experienced after LASIK.
Various corneal dystrophies have been described. Epithelial basement dystrophy, lattice, Schnyder’s crystalline, Thiel-Behnke, Reis-Bucklers, granular, and Fuchs’ endothelial dystrophies are some of those characterized with confocal microscopy (Rosenberg et al. 2000; Kobayashi et al. 2003, 2009; Werner et al. 1999; Kaufman et al. 1993). The appearance of the Fuchs’ endothelial dystrophy on confocal microscopy is similar to the appearance on specular microscopy with polymegathism and pleomorphism. However, one of the advantages of the confocal over specular microscopy in imaging Fuchs’ is the ability to image through an edematous, hazy cornea, whereas with specular microscopy, the image cannot be obtained (Chiou et al. 1999a).
The confocal microscopy appearance of iridocorneal endothelial (ICE) syndrome demonstrates corneal endothelial cells consistent with the appearance of epithelial-like cells (Fig. 4.4) (Chiou et al. 1999b).
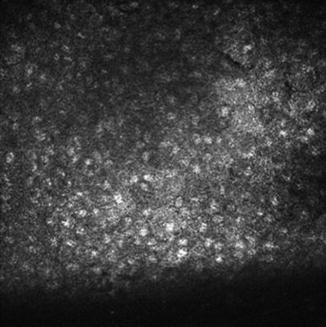
Fig. 4.4
Iridocorneal endothelial syndrome as imaged by confocal microscopy. Note epithelial-like cells with hyper-reflective nuclei at the level of the corneal endothelium
4.3 Specular Microscopy
In 1968, David Maurice developed specular microscopy, which then advanced to clinical use in 1975 with Bourne, Kaufman, and Laing (Maurice 1968; Bourne and Kaufman 1976). Specular microscopy is a technique that images tissue using light reflected from the optical interface of the corneal endothelium and the aqueous humor.
4.3.1 Normal Anatomy
Clinical specular microscopy provides quantitative assessment of endothelial cell density (ECD) and morphology as an indirect measure of function. Change in ECD is more important than an absolute value. Morphometric parameters provide information related to whether a cell population is under stress. The coefficient of variation (CV) measures a change in cell size (polymegathism), while % of hexagonal cells (% HEX) measures a change in cell shape (pleomorphism) (Fig. 4.5).
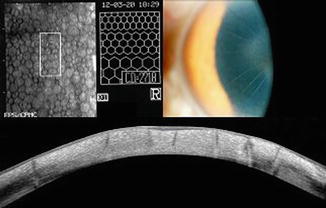
Fig. 4.5
Specular microscopy with anterior segment optical coherence tomography showing the endothelial mosaic after radial keratotomy surgery. Note with OCT the ability to identify the depth of each radial incision with epithelial remodeling
In most individuals, ECD decreases throughout life. Cell loss is most rapid from birth to the first few years of life. After the age of 60 years, ECD decreases significantly in most people, but there is a great degree of variability between individuals. On average, age-related cell loss is approximately 0.5 % per year (Sherrard et al. 1987). Though there is a large variation among age groups, most patients, even those greater than 70 years of age, should have an ECD of at least 2000 cells per mm2, a coefficient of variation less than 0.40, and greater than 50 % hexagonal cells.
4.3.2 Clinical Uses
Specular microscopy is utilized in evaluating donor corneas, in identifying corneal dystrophies, and in providing valuable information for pre- and postsurgical management. Corneal edema is estimated to occur between 300 and 700 cells per mm2 (Mishima 1982). Assuming cell loss in the range of 0–30 % for a given intraocular surgery, a patient should have at least 1,000–1,200 cells per mm2 to safely undergo most anterior segment surgery without an increased risk of permanent postoperative corneal edema. When evaluating early postoperative corneas, imaging both centrally and in the midperiphery will identify regional disparities in ECD and morphology (Glasser et al. 1985). Reports of endothelial cell loss after cataract surgery using a variety of surgical approaches have demonstrated variable cell loss, but following uncomplicated phacoemulsification and posterior chamber intraocular lens implantation using viscoelastic and modern, small-incision techniques is low, ranging from no detectable cell loss to 20 % (Díaz-Valle et al. 1998).
Fuchs’ endothelial corneal dystrophy (FECD) is a progressive, bilateral female predominant, endothelial disease that results in progressive corneal stromal edema and eventually epithelial edema and subepithelial fibrosis. The progressive morphologic changes of corneal guttae in FECD, with increased polymegathism and pleomorphism, initially start centrally (Laing et al. 1981). This has led many surgeons to utilize endothelial imaging to help predict postoperative outcomes.
The iridocorneal endothelial (ICE) syndrome, a unilateral female predominant, nonfamilial, progressive group of disorders, shows rounding of cell angles of the endothelium with a loss of cellular definition and a prevalence of pentagonal cells which are smaller than normal while also showing reversal of reflectivity (Sherrard et al. 1991). In contradistinction, posterior polymorphous corneal dystrophy (PPCD), a bilateral, nonprogressive, autosomal dominant disease, clinically appears similar to ICE syndrome, which complicates the diagnosis. However, using specular microscopy, the vesicles of PPCD have a thick dark border in a doughnut-like appearance with the lesion anterior to the endothelium and can be used to differentiate PPCD from ICE syndrome (Brooks et al. 1989).
Many investigators have studied photorefractive keratectomy (PRK) and laser-assisted in situ keratomileusis (LASIK) effects on the corneal endothelium. Most have shown that neither LASIK nor PRK results in a decreased endothelial density; however, ablation of the stroma within 200 μm of the corneal endothelium results in endothelial structural changes and the formation of the amorphous substance deposited onto Descemet’s membrane (Edelhauser 2000).
In the Specular Microscopy Ancillary Study (SMAS) of the multicenter Cornea Donor Study (CDS) evaluating penetrating keratoplasty, endothelial cell loss from baseline to 5 years reached a staggering 70 % postoperatively. This does not directly correlate with functional status as in the SMAS; 14 % of the subjects with clear grafts had an ECD below 500 cells/mm2. The study did note that cell loss continues throughout the life of the graft with highest correlation of long-term graft success using ECD at 6 months (Lass et al. 2010).
Endothelial keratoplasty (EK) has rapidly become the primary procedure for endothelial dysfunction since 2005 nearly surpassing penetrating keratoplasty in 2011 and increasing the gap in 2012. In 2013, the EBAA reported 24,987 cases of endothelial keratoplasty were performed. The procedure has been applied to all endothelial failure conditions, the cause for 40 % of all corneal transplants in the United States (Eye Bank Association of America 2013). Most authors have reported significantly greater cell loss in the first 6 months after EK compared to PKP. Interestingly, although there is greater loss at 1 year when compared to PKP, the rate of cell loss begins to level off around 6 months, unlike PKP, as observed by several authors. After 1 year, there is minimal loss to the second and third years, 7 % between 6 months and 2 years, and 8 % between 6 months and 3 years, compared with 42 % in the eyes that underwent PKP in the Specular Microscopy Ancillary Study (SMAS) of the Cornea Donor Study (CDS) (Lass et al. 2010; Price and Price 2009).
In type I diabetes the cell density significantly decreases with age. Diabetic corneas also exhibit increased polymegathism and pleomorphism and a decreased percentage of hexagonality (Schultz et al. 1984).
4.4 Anterior Segment Optical Coherence Tomography
Anterior segment optical coherence tomography (OCT) is a high-resolution cross-sectional imaging modality, initially developed for retinal imaging at 830 nm (Huang et al. 1991). Applications for the anterior segment were first described in 1994 by Izatt et al. (1994). Due to limited penetrating through scattering tissue in the anterior segment, a longer wavelength was developed – 1,310 nm.
We have just begun to realize and appreciate the many applications of AS-OCT. Like high-resolution posterior segment OCT, clinicians are now recognizing the significance of AS-OCT for diagnosing, monitoring progression, and clinical decision-making.
4.4.1 Function
The anterior segment OCT is a light-based instrument, based on infrared light that segments ocular structures based on their reflectivity (indexes of refraction) – the ratio between light wave energy reflecting from the surface and light wave energy striking the same interface. Light at 1,310 is strongly absorbed by water. Less than 7 % of light on the cornea reaches the retina resulting in the ability of safely using a much higher power level (15 mW vs. 0.7 mW retina). Using 20× more power for anterior segment scanning equates to 20× faster scanning without sacrificing signal level. The longer wavelength also equals reduced scattering in opaque tissues such as the limbus, sclera, and iris. Also, the longer wavelength allows deeper penetration of the limbus for visualization of the scleral spur and angle recess (Huang et al. 1991).
Concentric or “arc” scanning produces uniformly strong reflections from the anterior and posterior corneal surfaces as well as the stromal collagen lamellae.
This scan maintains nearly perpendicular incidence angle as the OCT beam is scanned in the transverse dimension along collagen lamellae. The strong reflections from these normal structures reduce contrast for corneal scars and LASIK flap interface, making the visualization of these features difficult. Scan width is limited to a fraction of the diameter of the objective lens (Steinert and Huang 2008).
Stay updated, free articles. Join our Telegram channel

Full access? Get Clinical Tree


