Purpose
To determine whether the highly reflective vertical lines seen in spectral-domain optical coherence tomographic (SD OCT) images, which we have termed track lines , after resolution of macular edema associated with branch retinal vein occlusion are related to the integrity of the photoreceptors.
Design
Retrospective, observational, cross-sectional study.
Methods
We reviewed the medical records of 59 eyes with resolved macular edema associated with branch retinal vein occlusion. The eyes were classified by the presence or absence of the track lines in the SD OCT images after the resolution of macular edema. The correlation between the presence of the track lines and the integrity of the photoreceptors was determined.
Results
Twenty-one of 59 (36%) eyes had track lines in the SD OCT images after a resolution of the macular edema during the follow-up period. At the final visit, 17 (81%) of 21 eyes with the track lines had an interrupted ellipsoid zone at the fovea, whereas 3 eyes (14%) had an intact ellipsoid zone and 1 eye (5%) had an absent ellipsoid zone ( P < .0001). The percentage of eyes with a disrupted external limiting membrane at the initial visit was significantly higher in eyes with track lines (90%) than that in eyes without track lines (63%; P = .0324).
Conclusions
The presence of highly reflective vertical lines in the SD OCT image is associated with a disrupted external limiting membrane before the resolution of macular edema and is associated with an interruption of the ellipsoid zone after resolution of macular edema. Thus, the vertical lines are useful markers of damage to the photoreceptors.
Macular edema is a major sequela of a branch retinal vein occlusion (BRVO). The macular edema occasionally resolves spontaneously, but it also can remain for a long period and lead to a reduction in visual acuity. Thus, various treatments have been used to try to reduce the macular edema as soon as possible, for example, grid laser photocoagulation, intravitreal injections of triamcinolone acetonide, intravitreal injections of bevacizumab or ranibizumab, and pars plana vitrectomy combined with internal limiting membrane peeling. However, some patients still have poor visual acuity despite a complete resolution of the macular edema.
Spectral-domain optical coherence tomography (SD OCT) has enabled clinicians to analyze the individual retinal layers qualitatively. In particular, the external limiting membrane (ELM) and ellipsoid zone of the photoreceptors can be delineated clearly and analyzed in the SD OCT images. It has been reported that the integrity of the ELM and ellipsoid zone of the photoreceptors in the SD OCT images was correlated significantly with the visual acuity in eyes with resolved macular edema associated with BRVO. Thus, clinicians have been examining these structures to assess the status of the photoreceptors.
Relevant to this study on macular edema, Tsujikawa and associates reported that a breakdown of the barrier function of the ELM leads to a movement of intraretinal fluid into the subretinal space in eyes with retinal vein occlusion. They also reported the presence of highly reflective vertical lines beneath the cystoid spaces in eyes with macular edema in the SD OCT images. They suggested that these lines represented tracks through which the intraretinal fluid within the cystoid spaces flowed into the subretinal space. Tsujikawa and associates did not comment on whether the lines remained after a resolution of macular edema and whether they were associated with damage of the photoreceptors. We also have observed highly reflective vertical lines beneath the cystoid spaces in the SD OCT images similar to those described by Tsujikawa and associates, but we have noted that the lines were present even after a resolution of the macular edema. The purpose of this study was to determine the characteristics of the highly reflective vertical lines in the outer retina, which we have termed track lines . We also determined whether the presence of track lines was correlated significantly with the integrity of the foveal photoreceptors.
Methods
The Institutional Review Board of the Nara Medical University approved the retrospective review of patient data and the intravitreal injection of bevacizumab (IVB) for eyes with macular edema associated with a BRVO. Informed consent for the IVB was obtained from all of the patients who underwent treatment after an explanation of the procedures to be used and possible complications. This study followed the tenets of the Declaration of Helsinki. This study was a retrospective examination of the medical records of 59 patients with a resolved macular edema associated with BRVO.
Patients and Examinations
All of the patients were examined at the Nara Medical University Hospital between June 1, 2011, and August 31, 2013, and they were followed up for at least 6 months. Eyes with other intraocular diseases, such as those with uveitis, diabetic retinopathy, an epiretinal membrane, or significant media opacities—such as cataracts or vitreous hemorrhages—were excluded. In the end, 59 eyes of 59 patients (33 men and 26 women) with resolved macular edema associated with BRVO were studied. The final visit was defined as the last visit after the macular edema had resolved.
All of the patients underwent a complete ophthalmic examination, including measurements of the best-corrected visual acuity (BCVA); slit-lamp biomicroscopy; fundus examination, including slit-lamp biomicroscopy with a noncontact fundus lens; fundus photography; and SD OCT. Fluorescein angiography was performed on 55 eyes of the 59 patients. Eyes with a distinct area of capillary nonperfusion within 1 disc diameter from the foveal center were considered to have macular ischemia.
Evaluation of Optical Coherence Tomographic Images
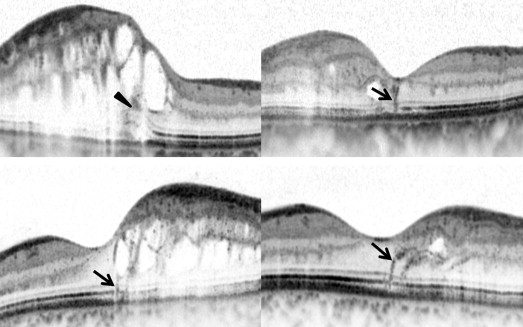
The Spectralis SD OCT (Heidelberg Engineering, Heidelberg, Germany) was used to obtain the SD OCT images. We evaluated the images of horizontal and vertical cross-sectional scans that were recorded at the each visit. We concentrated on the highly reflective vertical lines, or track lines, in the outer retina in the SD OCT images ( Figure 1 ). The eyes that had these track lines after a resolution of the macular edema in at least 1 image during the follow-up period were classified as being track lines (+). The eyes that did not have the track lines after a resolution of the macular edema were classified as track lines (−). To determine the correlation between the presence of track lines after a resolution of the macular edema and the track lines beneath the cystoid spaces, we also determined whether track lines were present beneath the cystoid spaces associated with the macular edema. These evaluations were made by 2 of the authors (T.H. and N.M.) who were masked to the visual acuity and other details of the eyes.
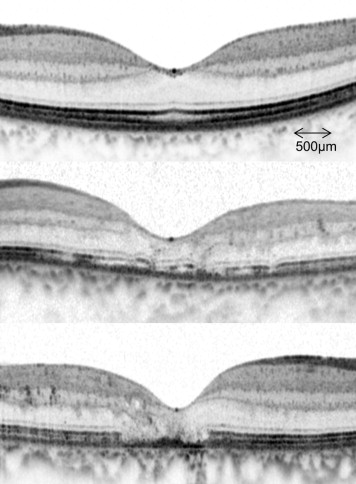
To determine whether the presence of track lines was correlated significantly with the integrity of the foveal photoreceptors, we evaluated the SD OCT images collected at the final visit of patients whose macular edema had resolved. The morphologic classifications of the ELM and the ellipsoid zone of the photoreceptors at the fovea in the SD OCT images were examined. The foveal ELM and ellipsoid zone in the SD OCT images were classified into 3 states—complete, interrupted, or absent—at the final visit, as described ( Figure 2 ). Briefly, eyes with an ELM that appeared to be completely intact within a 500-μm diameter from the fovea in both the horizontal and vertical images were classified as ELM (+); eyes with an interrupted ELM at the fovea in either the horizontal or vertical images were classified as ELM (±); and eyes with an absent ELM of more than a 500-μm diameter centered on the fovea in both the horizontal and vertical images were classified as ELM (−). Each eye was also classified by the status of the ellipsoid zone of the photoreceptors at the fovea using the same criteria described for the ELM: ellipsoid zone (+), ellipsoid zone (±), and ellipsoid zone (−).
We also determined whether the ELM was disrupted and whether a serous retinal detachment (SRD) was present at the fovea in the SD OCT images obtained at the initial visit. These evaluations also were made by the same masked retinal specialists (T.H. and N.M.). The central foveal thickness (CFT) was measured as the distance between the internal limiting membrane and the outer border of the retinal pigment epithelium at the fovea. The CFT was measured automatically with the caliper measurement tool embedded in the SD OCT system. The values obtained by the horizontal and vertical cross-sectional images were averaged for the statistical analyses.
Treatments
Fifty of the 59 eyes received both IVB and a sub-Tenon injection of triamcinolone acetonide (STTA) to treat the macular edema, and 8 eyes received additional grid photocoagulation. The macular edema resolved spontaneously in the other 9 eyes. When macular edema recurred, a reinjection of IVB and STTA was performed after obtaining consent from the patient. Fifteen eyes received IVB plus STTA once, 18 eyes received this treatment twice, 4 eyes received this treatment 3 times, 6 eyes received this treatment 4 times, and 7 eyes received this treatment 5 or more times.
Statistical Analyses
All values are presented as the means ± standard deviations. The BCVA was measured with a Landolt chart, and the decimal acuities were converted to the logarithm of the minimal angle of resolution (logMAR) scale for the statistical analyses. The χ 2 test was used to analyze the relationship between the integrity of the ELM and the ellipsoid zone and the relationship between the integrity of the ellipsoid zone and the presence of track lines. Comparisons of the BCVAs and CFTs of the 3 groups that were classified based on the status of the ellipsoid zone were carried out with the Kruskal-Wallis test, with post hoc comparisons tested with the Scheffe procedures. The significance of differences in the patient characteristics between the track lines (+) group and track lines (−) group were compared by the Mann–Whitney U test, and the Fisher exact probability test was used if the expected cell count was fewer than 5. A P value of less than .05 was considered statistically significant. All analyses, except for the odds ratio, were performed using the StatView software version 5.0 (SAS Institute, Cary, North Carolina, USA). Odds ratio was calculated with JMP software version 10 (SAS Institute).
Results
After a resolution of the macular edema associated with a BRVO, track lines were observed at the fovea in 21 (36%) of the 59 eyes ( Figures 3 and 4 ). These 21 eyes were placed in the track lines (+) group, and the other 38 eyes were placed in the track lines (−) group. The number of eyes with the track lines beneath the cystoid spaces associated with macular edema was 7 (33%) of 21 eyes in the track lines (+) group and 4 (11%) of 38 eyes in the track lines (−) group ( Table 1 ). The percentage of eyes with track lines beneath the cystoid spaces was significantly higher in the track lines (+) group than that in the track lines (−) group ( P = .0419).
| Track Line Beneath the Cystoid Space | After Resolution of Macular Edema, No. (%) | P Value | |
|---|---|---|---|
| Track Line (+) Group (n = 21) | Track Line (−) Group (n = 38) | ||
| Present | 7 (33) | 4 (11) | .0419 |
| Absent | 14 (67) | 34 (89) | |
Association Between Track Lines and Integrity of Photoreceptors at Final Visit
To determine whether there was a significant correlation between the track lines and integrity of the photoreceptors after the resolution of the macular edema, we classified the integrity of the foveal ELM and ellipsoid zones of the photoreceptors at the final visit into 3 categories ( Table 2 ). The mean BCVA in the ellipsoid zone (+) group at the final visit was 0.06 ± 0.12 logMAR units, that in the ellipsoid zone (±) group was 0.28 ± 0.23 logMAR units, and that in the ellipsoid zone (−) group was 0.55 ± 0.34 logMAR units. The BCVA of eyes in the ellipsoid zone (+) group was significantly better than that in the ellipsoid zone (±) group and the ellipsoid zone (−) group ( P = .0041 and P < .0001, respectively). The mean CFT in the ellipsoid zone (+) group at the final visit was 233.9 ± 32.6 μm, that in the ellipsoid zone (±) group was 222.3 ± 34.5 μm, and that in the ellipsoid zone (−) group was 182.1 ± 30.3 μm. The CFT in the ellipsoid zone (−) group was significantly thinner than that in ellipsoid zone (+) group and ellipsoid zone (±) group ( P = .0003 and P = .0061, respectively).
| Final Examination | P Value | |||
|---|---|---|---|---|
| Ellipsoid Zone (+) Group (n = 24) | Ellipsoid Zone (±) Group (n = 24) | Ellipsoid Zone (−) Group (n = 11) | ||
| Final examination | ||||
| LogMAR | 0.06 ± 0.12 | 0.28 ± 0.23 | 0.55 ± 0.34 | < .0001 |
| CFT (μm) | 233.9 ± 32.6 | 222.3 ± 34.5 | 182.1 ± 30.3 | .0011 |
| ELM (+) | 24 | 7 | 1 | |
| ELM (±) | 0 | 17 | 0 | |
| ELM (−) | 0 | 0 | 10 | < .0001 |
| After resolution of macular edema | ||||
| Track line (+) | 3 | 17 | 1 | |
| Track line (−) | 21 | 7 | 10 | < .0001 |
Stay updated, free articles. Join our Telegram channel

Full access? Get Clinical Tree


