Purpose
To detect pathologic changes in retinal nerve fiber bundles in glaucomatous eyes seen on images obtained by adaptive optics (AO) scanning laser ophthalmoscopy (AO SLO).
Design
Prospective cross-sectional study.
Methods
Twenty-eight eyes of 28 patients with open-angle glaucoma and 21 normal eyes of 21 volunteer subjects underwent a full ophthalmologic examination, visual field testing using a Humphrey Field Analyzer, fundus photography, red-free SLO imaging, spectral-domain optical coherence tomography, and imaging with an original prototype AO SLO system.
Results
The AO SLO images showed many hyperreflective bundles suggesting nerve fiber bundles. In glaucomatous eyes, the nerve fiber bundles were narrower than in normal eyes, and the nerve fiber layer thickness was correlated with the nerve fiber bundle widths on AO SLO ( P < .001). In the nerve fiber layer defect area on fundus photography, the nerve fiber bundles on AO SLO were narrower compared with those in normal eyes ( P < .001). At 60 degrees on the inferior temporal side of the optic disc, the nerve fiber bundle width was significantly lower, even in areas without nerve fiber layer defect, in eyes with glaucomatous eyes compared with normal eyes ( P = .026). The mean deviations of each cluster in visual field testing were correlated with the corresponding nerve fiber bundle widths ( P = .017).
Conclusions
AO SLO images showed reduced nerve fiber bundle widths both in clinically normal and abnormal areas of glaucomatous eyes, and these abnormalities were associated with visual field defects, suggesting that AO SLO may be useful for detecting early nerve fiber bundle abnormalities associated with loss of visual function.
Evaluation of the nerve fiber layer (NFL) is important for detecting and managing glaucoma. However, it has been reported that NFL defects could not be visualized until NFL thickness at the center of the NFL defect decreased to less than 50% of the normal value in experimental primates. It also is difficult to obtain fundus photographs with sufficient quality for interpretation, especially for eyes with a hypopigmented fundus or myopia, when background reflection is high and contrast is low. The advent of optical coherence tomography (OCT) enabled cross-sectional imaging of the NFL, improving detection of damage to the NFL and allowing measurement of the NFL thickness. Relatively high diagnostic sensitivity and specificity for glaucoma detection has been demonstrated for circumpapillary NFL thickness using time-domain OCT and spectral-domain (SD) OCT.
The NFL comprises mainly nerve fiber bundles and Müller cell septa. A nerve fiber bundle has the form of a square rod with 3 dimensions: width, height, and length. The NFL thickness measured with OCT represents the height of the nerve fiber bundles, but not their width. Neither red-free fundus photography nor OCT can provide sufficiently clear images of individual nerve fiber bundles. Thus, the width of nerve fiber bundles, particularly the involvement of structural abnormalities in glaucoma, has not been assessed.
The OCT and other imaging methods such as scanning laser ophthalmoscopy (SLO) fail to provide sufficiently detailed images of NFL microstructure, primarily because of aberrations in ocular optics. These aberrations can be compensated for by using imaging systems that incorporate adaptive optics (AO), consisting of a wavefront sensor that measures aberrations in ocular optics and a deformable mirror or a spatial light modulator to compensate for these aberrations in living eyes. Adding AO to imaging systems such as flood-illuminated ophthalmoscopes, SLO equipment, or OCT has allowed researchers to identify individual cone photoreceptors, nerve fiber bundles, and blood flow.
Recently, we demonstrated that AO SLO can depict individual retinal nerve fiber bundles in the macula and around the optic disc in normal eyes; the hyperreflective bundles on AO SLO represent retinal nerve fiber bundles, and the dark lines among the hyperreflective bundles on AO SLO represent Müller cell septa. In the present study, we used an AO SLO system developed by the authors to conduct high-resolution imaging of the NFL around the optic disc in eyes with open-angle glaucoma and healthy controls to identify structural abnormalities in individual retinal nerve fiber bundles and compared the pathologic changes we saw with abnormalities on images obtained by other methods and with abnormalities in these patients’ visual function.
Methods
Participants
Candidates in this prospective, cross-sectional study were patients with open-angle glaucoma who visited the Kyoto University Hospital, Kyoto, Japan, between April 2010 and August 2011 and agreed to participate in the study, as well as healthy volunteers. All the investigations in this study adhered to the tenets of the Declaration of Helsinki, and this prospective study was approved by the Institutional Review Board and the Ethics Committee of Kyoto University Graduate School of Medicine. The nature of the study, participation in its research, and its possible consequences were explained to the study candidates, after which written informed consent was obtained from all participants.
Ophthalmologic Examinations of Glaucoma Patients and Normal Volunteers
All patients and volunteers in this study underwent comprehensive ophthalmologic examinations, including autorefractometry and keratometry, uncorrected and best-corrected visual acuity measurements using a 5-m Landolt chart, intraocular pressure (IOP) using a Goldmann applanation tonometer, axial length assessed using an IOLMaster (Carl Zeiss Meditec, Dublin, California, USA), visual field testing using the Humphrey Field Analyzer (Carl Zeiss Meditec), gonioscopy, dilated funduscopy, stereo fundus photography, red-free SLO fundus imaging, circumpapillary NFL thickness measurement using SD OCT, and AO SLO.
Glaucomatous eyes were defined by the presence of evident diffuse or localized rim thinning on stereo disc photography, regardless of the presence or absence of glaucomatous visual field defects. All of the study eyes already had been classified as glaucomatous during our glaucoma service meeting on the basis of the appearance of the optic discs of both eyes in each patient based on fundus photography, including stereoscopic photography. The optic disc appearance was evaluated independently by 3 glaucoma specialists (M.H., T.A., A.N.) who were masked to all other information about the eyes. Eyes were classified as having glaucoma if the examiner identified either diffuse or localized rim thinning. If all 3 examiners did not agree with the classification of an eye, the group reviewed and discussed the fundus color photographs and stereo photographs until a consensus was reached.
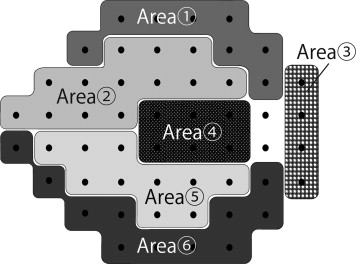
Visual field defects resulting from glaucoma were defined according to the Anderson and Patella criteria using standard automated perimetry and the 24-2 Swedish interactive threshold algorithm standard as follows: (1) abnormal range on the glaucoma hemifield test or (2) pattern standard deviation of less than 5% of the normal reference value confirmed on 2 consecutive tests considered reliable based on fixation losses of less than 20%, false-positive results of less than 20%, and false-negative results of less than 20%. The 2 consecutive visual field tests were performed within 1 month of each other, and when the results of these did not agree, a third test was performed in another month. A visual field focal defect was defined as the depression of 3 points to an extent present in less than 5% of the normal population. At least 1 point of these 3 should be depressed to an extent found in less than 1% of the normal population. The sectoring method of Garway-Heath and associates was used for analysis of correlations between visual field indices and nerve fiber bundle widths ( Figure 1 ). Area 2 and area 5, corresponding to the nerve fiber bundles running through the areas extending from 271 to 310 degrees (inferior temporal) and 41 to 80 degrees (superior temporal), respectively, were used for the analysis. The mean deviation (MD) for each area was calculated by averaging anti-log values of total deviation values of each point.
Eyes with a normal open angle but with glaucomatous optic disc appearance were included in this study. Exclusion criteria were as follows: (1) contraindication to dilation; (2) Snellen equivalent best-corrected visual acuity worse than 20/40; (3) spherical equivalent refractive error of more than 5.0 or less than −6.0 diopters or cylindrical refractive error of less than −3.0; (4) unreliable Humphrey Field Analyzer results (fixation loss of ≥20%, false-positive or false-negative results of ≥20%); (5) nonglaucomatous visual field defects suggesting brain diseases; (6) history of intraocular surgery; (7) evidence of vitreoretinal diseases; or (8) evidence of brain diseases, diabetes mellitus, or other systemic diseases that may affect the eye.
Adaptive Optics Scanning Laser Ophthalmoscopy System
The usefulness of incorporating a wide-field SLO with an AO SLO was reported by Burns and associates and Ferguson and associates. We designed and constructed our AO SLO system based on the same scheme with certain simplifications. The AO SLO system comprises 4 primary optical subsystems, the AO subsystem including the wavefront sensor, the high-resolution confocal SLO imaging subsystem, the wide-field imaging subsystem, and the pupil observation subsystem for initial alignment of the subject’s pupil with the optical axis of the AO SLO system by adjusting the chin rest. The details of the current AO SLO system are described in the Supplemental Material (available at AJO.com ).
Measurement of Widths of the Hyperreflective Bundles
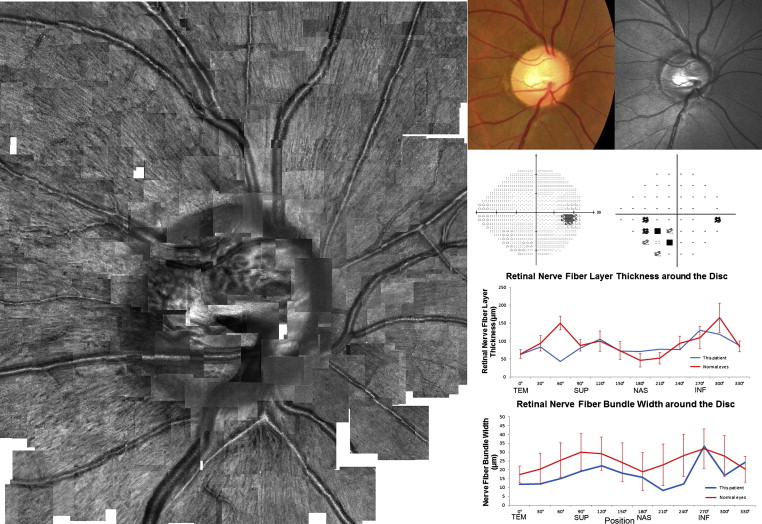
Methods for measuring hyperreflective bundle widths using AO SLO imaging have been described elsewhere. For each eye, AO SLO images (3.0 × 1.9 degrees) were obtained at multiple locations around the optic disc (4.5 × 4.5 mm). All eyes were dilated for examination, and AO SLO imaging was performed by focusing on the surface of the NFL. A montage of AO SLO images then was created offline by selecting the area of interest and generating each image to be included in the montage from a single frame, without averaging. The degree of correspondence of each montage to the area of interest was verified by comparing the AO SLO image with the wide-field images for that eye. To create a large-scale montage of AO SLO images ( Figure 2 and Supplemental Figure ), an automated image-stitching algorithm was applied.
To measure the width of individual hyperreflective bundles, several bundles were chosen from an AO SLO image. We analyzed avascular areas, because vessels can obscure underlying nerve fiber bundles in AO SLO images. The digital caliper tool built into ImageJ (National Institutes of Health, Bethesda, Maryland, USA) was used to measure the width at 3 points in each bundle by 2 independent experienced graders (S.O. and N.U.-A.) who were masked to the bundle location and other clinical information regarding the eyes. For each area of each eye, 13.2 ± 4.0 points were measured. To obtain accurate scan lengths, we corrected for the magnification effect in each eye using the adjusted axial length method devised by Bennett and associates. The width of each hyperreflective bundle was determined as the mean width acquired from these images. If the values were different significantly between the graders, a third grader (K.T.) was invited, and the value closest to that determined by the third grader was selected. The mean value of the 2 independent graders was used as each bundle width.
Measurements of hyperreflective bundle width were performed in 12 AO SLO images obtained at 0, 30, 60, 90, 120, 150, 180, 210, 240, 270, 300, and 330 degrees from the temporal horizontal (clockwise in the right eye and counterclockwise in the left eye) along a circle with a diameter of 3.4 mm.
Only eyes for which adequate image quality was obtained were included in this study, and if both eyes were eligible, 1 eye was randomly selected for the analysis.
Circumpapillary Nerve Fiber Layer Thickness Measurement
The SD OCT examinations were performed on all eyes using the Spectralis HRA+OCT (Heidelberg Engineering, Dossenheim, Germany). We exported the raw data from the Spectralis HRA+OCT and calculated the mean NFL thickness for each of the 12 areas (0, 30, 60, 90, 120, 150, 180, 210, 240, 270, 300, and 330 degrees from the temporal horizontal midline [clockwise in the right eye and counterclockwise in the left eye]) along a 3.4-mm diameter circle centered on the optic disc.
Statistical Analyses
The best-corrected visual acuity measured using the Landolt chart was expressed as the logarithm of the minimum angle of resolution. For comparing bundle width variables among areas, Bonferroni correction was used. Variables were compared between normal eyes and glaucomatous eyes using a t test. For interobserver measurements, 2-way mixed, average measure intraclass correlation coefficients (ICC [3, K]) were obtained. For intraobserver measurements, 1-way random, average measure ICCs (ICC [1, K]) were obtained. Relationships between nerve fiber bundle widths and the visual field tests or circumpapillary NFL thickness were assessed using Pearson correlation analysis. Statistical analyses were performed using the SPSS statistics software program version 17 (SPSS Inc, Chicago, Illinois, USA). A P value less than .05 was considered statistically significant.
Results
Eighty-four eyes from 42 patients with open-angle glaucoma were examined. Among them, 28 eyes were excluded because of the poor image quality (because of media opacity, insufficient dilation, poor fixation, or a combination thereof), and 3 eyes were excluded because of unreliable Humphrey Field Analyzer results. Ultimately, the images obtained for 53 eyes from 28 patients were suitable for analysis. If both eyes were eligible for inclusion, 1 eye was selected randomly. Thus, 28 eyes from 28 patients were included in this study. Twenty-one normal eyes in 21 subjects were included as control. The ages of the subjects ranged from 31 to 73 years (mean ± standard deviation, 58.9 ± 9.4 years) for patients with glaucoma and from 26 to 83 years (mean ± standard deviation, 51.4 ± 16.4 years) for normal volunteers ( P = .051, t test). The axial length ranged from 22.5 to 27.2 mm (mean ± standard deviation, 25.1 ± 1.4 mm) in eyes with glaucoma and 22.0 to 27.1 mm (mean ± standard deviation, 24.5 ± 1.4 mm) in normal eyes ( P = .114, t test).
Twenty-four (85.7%) eyes had glaucomatous visual field defects corresponding to the evident optic disc rim thinning (perimetric glaucoma), and 4 (14.3%) eyes did not have glaucomatous visual field defects (preperimetric glaucoma). Nineteen (67.9%) eyes had a mean deviation (MD) of −6 dB or more, and 9 (32.1%) eyes had an MD of less than −6 dB. The median MD was −3.77 dB, the first interquartile was −7.79 dB, and the third interquartile was −1.12 dB. The distribution of focal defects in the visual field was as follows: 14 eyes had visual field defects in area 2, and 16 eyes had visual field defects in area 5. In area 2, the median MD was −3.79 dB, the first interquartile was −5.82 dB, and the third interquartile was −0.875 dB. In area 5, the median of MD was −2.47 dB, the first interquartile was −4.87 dB, and the third interquartile was −1.53 dB.
In all of the eyes, the AO SLO images showed many hyperreflective bundles aligned with the striations on SLO red-free images ( Figure 2 ), suggesting that these structures represent nerve fiber bundles in the NFL. However, the resolution was much higher in the AO SLO images than in fundus photography or red-free SLO images ( Figure 2 ). The visibility of nerve fiber bundles was not associated with disc size.
The reproducibility of the nerve fiber bundle width measurements was evaluated through an interobserver ICC; the ICC was 0.867 for measurement of nerve fiber bundle width in eyes with glaucoma and 0.877 in normal eyes. The 95% confidence interval for ICC values were 0.833 to 0.894 in glaucoma eyes and 0.863 to 0.889 in normal eyes. The ICCs of each quadrant around the disc (temporal, superior, nasal, and inferior) are shown in Table 1 .
| Area | ICC (95% CI) | |
|---|---|---|
| Interobserver | Intraobserver | |
| Normal eyes | ||
| Total | 0.877 (0.863 to 0.889) | 0.944 (0.929 to 0.955) |
| Temporal | 0.878 (0.834 to 0.911) | 0.835 (0.746 to 0.893) |
| Superior | 0.896 (0.849 to 0.929) | 0.915 (0.868 to 0.945) |
| Nasal | 0.880 (0.824 to 0.919) | 0.933 (0.893 to 0.959) |
| Inferior | 0.925 (0.892 to 0.948) | 0.963 (0.936 to 0.978) |
| Glaucomatous eyes | ||
| Total | 0.867 (0.833 to 0.894) | 0.881 (0.857 to 0.902) |
| Temporal | 0.843 (0.779 to 0.889) | 0.892 (0.847 to 0.923) |
| Superior | 0.826 (0.735 to 0.886) | 0.774 (0.655 to 0.852) |
| Nasal | 0.882 (0.837 to 0.915) | 0.907 (0.872 to 0.933) |
| Inferior | 0.943 (0.908 to 0.965) | 0.838 (0.738 to 0.900) |
The mean widths of the nerve fiber bundles along a circle with a diameter of 3.4 mm centered on the optic disc are shown in Figure 3 . In normal eyes, the nerve fiber bundles in the temporal and nasal quadrants of the optic disc were narrower than those above and below the optic disc ( P < .001, Kruskal-Wallis test). Thus, the bundle width around the optic disc had a double-humped shape ( Figure 3 ). Circumpapillary NFL thickness as measured by SD OCT around the optic disc exhibited a similar double-humped shape ( Figure 3 ). The circumpapillary NFL thickness was correlated with corresponding nerve fiber bundle widths on AO SLO images ( P < .001, r = 0.374, Pearson correlation coefficient). In eyes with glaucoma, the nerve fiber bundles were narrower than in normal eyes, especially at 60, 240, and 300 degrees ( P = .014, P = .035, and P < .001, respectively; Figure 3 and Table 2 ). There were significant differences in bundle width at 60, 90, 120, 150, 240, 270, and 300 degrees as compared with the value measured at 0 degrees from the temporal pole of the optic disc in normal eyes ( P < .001, P < .001, P < .001, P = .035, P < .001, P < .001, and P < .001, respectively). There were significant differences in bundle width at 60, 90, 120, and 270 degrees compared with that measured at 0 degrees from the temporal pole of the optic disc in glaucoma eyes ( P = .040, P < .001, P = .026, and P < .001, respectively). The circumpapillary NFL thickness was correlated with the corresponding nerve fiber bundle widths on AO SLO ( P < .001, r = 0.351, Pearson correlation coefficient) in eyes with glaucoma.
| Mean (Standard Deviation) Bundle Width (μm) | Position (Degrees) | |||||||||||
|---|---|---|---|---|---|---|---|---|---|---|---|---|
| 0 | 30 | 60 | 90 | 120 | 150 | 180 | 210 | 240 | 270 | 300 | 330 | |
| Normal eyes | 17.5 (2.4) | 20.5 (4.4) | 25.5 (4.9) | 30.1 (5.2) | 29.2 (4.7) | 24.2 (5.5) | 19.0 (5.4) | 22.8 (5.9) | 28.1 (5.9) | 31.9 (5.6) | 27.9 (5.8) | 20.4 (3.6) |
| Glaucomatous eyes | 17.7 (5.1) | 19.8 (4.9) | 20.3 (6.6) | 26.8 (4.5) | 26.8 (5.5) | 21.5 (4.3) | 18.3 (5.2) | 18.8 (5.9) | 22.3 (6.5) | 30.9 (5.7) | 19.3 (8.2) | 20.8 (2.9) |
| P value a | .878 | .658 | .014 | .166 | .349 | .397 | .784 | .198 | .035 | .695 | <.001 | .771 |
Changes in the NFL on fundus photography or red-free SLO images (NFL defect) were detectable in 28 areas of 19 eyes. In 3 of these areas, the nerve fiber bundles were invisible on the AO SLO images ( Figure 4 ). However, AO SLO revealed the nerve fiber bundles remaining in 25 areas (89%) showing NFL defects on fundus photography or red-free SLO imaging ( Figures 5 and 6 ). In the NFL defect area as imaged on fundus photography or red-free SLO imaging, nerve fiber bundle width as measured using the AO SLO (19.2 ± 5.1 μm) was narrower than that observed in normal eyes (27.4 ± 5.5 μm; P < .001, t test). There were more hyporeflective areas between the nerve fiber bundles in the NFL defect area in glaucomatous eyes as compared with normal eyes ( Table 3 ). In contrast to glaucoma eyes, there was no focal bundle thinning in any normal eyes.


