Purpose
To characterize microaneurysm closure following focal laser photocoagulation in diabetic macular edema (DME) using simultaneous fluorescein angiography (FA) and spectral-domain optical coherence tomography (SD-OCT).
Design
Retrospective observational case series.
Methods
Leaking microaneurysms (n = 123) were analyzed in eyes (n = 29) with nonproliferative diabetic retinopathy (NPDR) that underwent navigated focal laser photocoagulation in DME and were followed at 3, 6, and 12 months. Closure of diabetic microaneurysms was characterized in detail following focal laser using SD-OCT.
Results
Closure rate of microaneurysms by both FA and SD-OCT was 69.9% (84/123), 79.7% (98/123), and 82.9% (102/123) at 3, 6, and 12 months, respectively. Microaneurysm closure rate increased at 6 and 12 months compared to 3 months ( P < .003, P < .001). Over half of closed microaneurysms (45/86, 52.3%) left hyperreflective spots while the remaining half (41/86, 47.7%) disappeared without any hyperreflectivity by SD-OCT at 3 months. Hyperreflective spots decreased at 6 (36/99, 36.4%) and 12 months (17/102, 16.7%) with a concomitant increase in complete loss of reflectivity at 6 (63/99, 63.6%) and 12 months (85/102, 83.3%). Smaller outer and inner diameters and heterogeneous lumen reflectivity were positively associated with microaneurysm closure at 12 months ( P < .0001, P < .001, P < .03).
Conclusions
Characterization of microaneurysms following focal laser photocoagulation resulted in hyperreflective spots and complete resolution of all reflectivity using SD-OCT. Smaller microaneurysms and those with heterogeneous lumen were positively associated with microaneurysm closure. These findings provide greater understanding of localized retinal changes following focal laser photocoagulation in DME treatment.
Diabetic macular edema (DME) is the most common cause of moderate vision loss in patients with diabetic retinopathy (DR). Vision loss is a result of the leakage of blood constituents from microaneurysms into the surrounding intraretinal space, which leads to retinal thickening and macular edema with image distortion.
Histologic findings of microaneurysms in DR include pericyte loss, endothelial proliferation and apoptosis, and remodeling of basement membranes. These microaneurysms are found in close association with focal areas of capillary nonperfusion, with a majority in the inner nuclear layer but also occasionally the outer plexiform layer, seen by electron microscopy.
Since the Early Treatment Diabetic Retinopathy Study (ETDRS) for diabetic macular edema, focal/grid laser photocoagulation has been the mainstay of treating DME with fluorescein angiography (FA) guidance. More recently, the additional therapy with intravitreal anti–vascular endothelial growth factor (VEGF) antibody has increased treatment efficacy.
Focal laser photocoagulation is thought to close microaneurysms directly, which subsequently stops leakage of blood constituents into retinal space. Focal treatment is associated with reduction of macular edema in the occurrence of retinal thickening involving the center of macula. However, recurrence of DME is not uncommon and can be very difficult to treat despite multiple sessions of focal/grid laser photocoagulation. Difficulty in managing DME reflects our limited understanding of the pathophysiology of regressing microaneurysms following treatment. For decades, clinical evaluations of microaneurysms in DME were confined to fundus photography and FA. Even with the development of time-domain optical coherence tomography, individual details could not be appreciated.
More recently, visualization of diabetic microaneurysms has been characterized using spectral-domain optical coherence tomography (SD-OCT). Characterization of individual microaneurysms in DME following focal laser photocoagulation may increase our understanding of microaneurysm regression and provide insight to improve treatment approaches. In this study, we characterized individual microaneurysms in DME using simultaneous FA and SD-OCT following navigated focal laser photocoagulation.
Methods
Study Design
We retrospectively assessed 123 microaneurysms by simultaneous FA and SD-OCT in 21 consecutive patients with nonproliferative diabetic retinopathy (NPDR) treated with navigated laser photocoagulation for DME at a single institution from November 2009 to January 2011. All treated microaneurysms that were visualized by FA and transected by a raster scan using SD-OCT were included in this study. Patients included 18 male and 3 female subjects with an average age of 61.0 ± 14.5 years. A total of 29 eyes with mild (6/29), moderate (13/29), and severe (10/29) NPDR were followed at 3, 6, and 12 months following a single session of navigated laser photocoagulation performed within 7 days of baseline examination. At each visit, all patients underwent an ophthalmologic examination with imaging studies including simultaneous FA and SD-OCT. Patients with proliferative diabetic retinopathy (PDR), poorly controlled diabetes (Hgb A1 C > 8.0%), or poorly controlled hypertension (BP > 140/90) were excluded. Eyes that did not undergo simultaneous FA and SD-OCT for all time points or received conventional laser photocoagulation were also excluded. Eyes that received any intravitreal steroid injection in the study eye or any intravitreal anti-VEGF in the study eye or contralateral eye within 6 months prior to receiving navigated laser photocoagulation or during the follow-up period were also excluded. This study adhered to the tenets of the Declaration of Helsinki for research involving human subjects and was performed in compliance with the Institutional Review Board of the University of California, San Diego.
Simultaneous Fluorescein Angiography and SD-OCT
Simultaneous FA and SD-OCT images were acquired using the Spectralis HRA2 (Heidelberg Engineering, Carlsbad, California, USA) at each time point using the TruTrack Active Eye Tracking software of the device to co-localize angiographic findings with SD-OCT images. On FA, microaneurysm leakage was defined as a hyperfluorescent spot seen in early phase with increasing hyperfluorescence in late phase. Extent of microaneurysm leakage was graded as mild (score = 1), moderate (score = 2), or severe (score = 3) leakage at each time point by 2 masked retina specialists. Closed microaneurysms by FA following laser photocoagulation were defined as an absence of focal hyperfluorescence in both early and late phases.
High-resolution SD-OCT images were acquired using a raster scan mode (20 × 20 degrees, 97 horizontal B-scans) during simultaneous FA imaging. Microaneurysms were detected as circular structures on SD-OCT that coincided with leakage on FA images. The follow-up scanning feature permitted reproducible SD-OCT image localization to characterize each microaneurysm over time. The follow-up feature has been validated by Spectralis HRA2 (Heidelberg Engineering) using retinal vessel landmarks to determine tracking information. SD-OCT images through the center of the microaneurysms were used to characterize leaking microaneurysms by 2 masked retina specialists.
Microaneurysm size was characterized by averaging the horizontal and vertical diameters of the outer and the inner wall (lumen) of each microaneurysm. Wall thickness was calculated as: wall thickness = (outer diameter of microaneurysm − inner diameter of microaneurysm)/2. All direct measurements were made using an internal caliper from the Spectralis HRA2. Central macular thickness within 500 μm of the fovea and retinal thickness (RT) through the center of each microaneurysm were calculated from software in SD-OCT after localizing the center of fovea and the center of each MA. We determined the retinal layer in which the center of the microaneurysm was located. Reflectivity within the lumen of each microaneurysm was also determined to be heterogeneous or homogeneous based on the presence or absence of hyperreflective spots on SD-OCT. Using SD-OCT, a closed microaneurysm following laser photocoagulation was defined as a microaneurysm with an absence or disappearance of a previously open lumen.
Navigated Focal Laser Photocoagulation
To maximize treatment accuracy, leaking diabetic microaneurysms (n = 123) were treated with focal laser photocoagulation (532 nm) using Navilas (OD-OS, Teltow, Germany) within 7 days of examination at baseline. The navigated retinal laser photocoagulator has been used to increase accuracy to targeting microaneurysms and higher hit rate was reported. Multimodality imaging (infrared, color, fluorescein angiography) integrated with a laser allowed planning and recording of treated areas. Eye-tracking registration linked to the laser photocoagulator ensured accurate delivery of laser pulses in coordination with patient eye movements. In the present study, planning and treatment delivery of laser photocoagulation was performed by a single retina specialist who did not participate in the masked observations. Laser photocoagulation was performed with the following parameters: spot size = 100-130 μm, duration = 100 ms, power = 70-150 mW. Laser burn intensity was adjusted to achieve a gray-white burn by looking interchangeably at both real-time infrared and color images during treatment.
Statistical Analysis
Statistical analysis was performed using SAS statistical software (Version 9.2, SAS Inc, Cary, North Carolina, USA). Continuous variables were expressed as mean ± standard deviation (SD). A paired t test or t test, and McNemar test or χ 2 test, were used to compare continuous and categorical variables, respectively. Pearson correlations were also performed among baseline characteristics. Since more than 1 microaneurysm was studied per eye, microaneurysm closure was used as a binary variable and analyzed using generalized estimation equations (GEE) to find significant predictors and to avoid any bias due to intrapatient or intra-eye correlations. Microaneurysm characteristics and microaneurysm closure by FA and SD-OCT were assessed by 2 masked retina specialists who did not perform laser photocoagulation. Agreement between 2 masked observers was assessed by calculating the concordant efficiency (Cohen’s kappa coefficient). A P value < .05 was considered to be statistically significant.
Results
Baseline Characteristics of Diabetic Microaneurysms
Leaking microaneurysms (n = 123) were characterized in 29 eyes (21 patients) with DME at baseline using simultaneous FA and SD-OCT ( Table 1 ). Microaneurysms included those of mild (29/123, 23.6%), moderate (49/123, 39.8%), and severe (45/123, 36.6%) NPDR. All microaneurysms (123/123) were noted to have leakage, with a moderate mean leakage score (2.3 ± 0.6) by FA. Using SD-OCT, mean central macular thickness within 500 μm of the fovea was found to be 361 ± 133 μm. Most of the studied microaneurysms were located in the inner nuclear layer (INL)/inner plexiform layer (IPL) (94/123, 76.4%). A small number of microaneurysms were found in the retinal nerve fiber layer (RNFL)/ganglion cell layer (GCL) (11/123, 8.9%) and outer nuclear layer (ONL)/outer plexiform layer (OPL) (18/123, 14.6%). Microaneurysm size was characterized by their outer and inner diameters and wall thickness, which resulted in sizes of 95 ± 27 μm, 59 ± 21 μm, and 18 ± 6 μm, respectively. Retinal thickness through the center of each microaneurysm averaged 422 ± 89 μm. Using SD-OCT, reflectivity within leaking microaneurysms was also characterized ( Figure 1 ). Almost three-quarters of all microaneurysms (91/123, 74%) had a lumen with homogeneous reflectivity compared to one-quarter (32/123, 26%) with heterogeneous reflectivity.
| Baseline Characteristic | |
|---|---|
| FA leakage score, mean (μm) ± SD (range) | 2.3 ± 0.6 (1-3) |
| Outer diameter, mean (μm) ± SD (range) | 95 ± 27 (60-186) |
| Inner diameter, mean (μm) ± SD (range) | 59 ± 21 (25-152) |
| Wall thickness, mean (μm) ± SD (range) | 18 ± 6 (5-36) |
| Retinal thickness, mean (μm) ± SD (range) | 422 ± 89 (285-725) |
| Retinal layer, n (%) | |
| RNFL/GCL | 11 (8.9) |
| INL/IPL | 94 (76.4) |
| ONL/OPL | 18 (14.6) |
| Lumen reflectivity, n (%) | |
| Homogeneous | 91 (74.0) |
| Heterogeneous | 32 (26.0) |
| Grade of DR, n (%) | |
| Mild NPDR | 29 (23.6) |
| Moderate NPDR | 49 (39.8) |
| Severe NPDR | 45 (36.6) |
As expected, increased FA leakage was associated with increased central macular thickness ( P < .05) and increased retinal thickness through the center of leaking microaneurysms ( P < .05) at baseline. Additionally, increased retinal thickness through the center of microaneurysms also correlated with increased central macular thickness ( P < .001). Interestingly, increased FA leakage was associated with increased microaneurysm outer and inner diameter ( P < .0001, P < .0001) as well as increased wall thickness ( P < .001). Not surprisingly, increased outer diameters of microaneurysms also correlated with an increased inner diameter ( P < .0001) and increased wall thickness ( P < .0001).
Closure Rate of Microaneurysms
Microaneurysm closure following navigated laser photocoagulation at 3, 6, and 12 months was assessed using simultaneous FA and SD-OCT by 2 masked retina specialists ( Table 2 ). The microaneurysm closure rate was increased at 6 and 12 months compared to 3 months by FA alone, SD-OCT alone, and both FA and SD-OCT. By FA alone, the microaneurysm closure rate was 72.4% (89/123), 83.7% (103/123), and 84.6% (104/123) at 3, 6, and 12 months, respectively. A significant increase in microaneurysm closure was observed at 6 and 12 months compared to 3 months ( P < .003, P < .002). However, no significant increase in microaneurysm closure was observed at 12 months compared to 6 months ( P > .05).
| Assessment | 3 Months N (%) | 6 Months N (%) | 12 Months N (%) |
|---|---|---|---|
| FA alone | 89 (72.4) | 103 (83.7) | 104 (84.6) |
| SD-OCT alone | 86 (70.0) | 99 (80.5) | 102 (82.9) |
| Both FA and SD-OCT | 84 (69.9) | 98 (79.7) | 102 (82.9) |
Similarly, evaluation by SD-OCT alone resulted in a microaneurysm closure rate of 70.0% (86/123), 80.5% (99/123), and 82.9% (102/123) at 3, 6, and 12 months, respectively. A significant increase in microaneurysm closure was also observed at 6 and 12 months compared to 3 months ( P < .004, P < .003), with no difference in microaneurysm closure rate at 12 months compared to 6 months ( P > .05). Overall, there was no difference in microaneurysm closure rate between FA alone and SD-OCT alone at all time points ( P > .05).
Microaneurysm closure rate seen using both FA and SD-OCT similarly paralleled FA alone and SD-OCT alone. The microaneurysm closure rate seen by both FA and SD-OCT was 69.9% (84/123), 79.7% (98/123), and 82.9% (102/123) at 3, 6, and 12 months, respectively. A significant increase in microaneurysm closure by both FA and SD-OCT was observed at 6 and 12 months compared to 3 months ( P < .003, P < .001). No difference in microaneurysm closure at 12 months compared to 6 months was observed using FA and SD-OCT together ( P > .05). Microaneurysm closure agreement between the 2 masked observers was 81.2%-83.2% (Kappa = 0.85, P = .25).
Retinal Thickness Changes and Closed Microaneurysms Characterized by SD-OCT
Decreased central macular thickness and retinal thickness was seen following navigated focal laser photocoagulation at 12 months. Mean central macular thickness decreased by 49 ± 133 μm (13.7%), from 361 ± 133 μm (225-638 μm) at baseline to 311 ± 90 μm (214-604 μm) at 12 months after laser photocoagulation ( P < .0001). Retinal thickness also decreased by 71 ± 82 μm (16.8%), from 422 ± 89 μm (285-725 μm) at baseline to 352 ± 78 μm (242-605 μm) at 12 months following laser photocoagulation ( P < .0001).
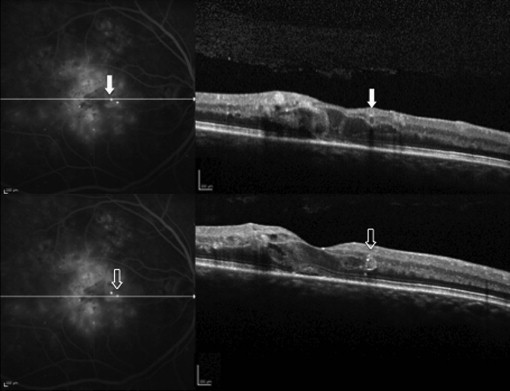
Characterization of closed microaneurysms only using SD-OCT revealed that over half of the closed microaneurysms (45/86, 52.3%) left hyperreflective spots in their original location, whereas the remaining half (41/86, 47.7%) disappeared without any hyperreflectivity on SD-OCT at 3 months ( Figures 2 and 3 ). Consistent with baseline distribution of microaneurysms, a majority of hyperreflective spots (37/45, 82.2%) were found in INL/IPL and less frequently in ONL/OPL (6/45, 13.3%) and RNFL/GCL (2/45, 4.4%). Similarly, a majority of closed microaneurysms that left no reflectivity were found in INL/IPL (31/41, 75.6%), while the remainder were found in ONL/OPL (6/41, 14.6%) and RNFL/GCL (4/41, 9.8%). Interestingly, microaneurysms that left hyperreflective spots decreased at 6 months (36/99, 36.4%) and 12 months (17/102, 16.7%) compared to 3 months (45/86, 52.3%) ( P < .03, P < .003). A part of these hyperreflective spots underwent complete loss of reflectivity at 6 (16/45, 35.6%) and 12 months (21/36, 58.3%). Conversely, the absence of reflectivity was increased at 6 months (63/99, 63.6%) and 12 months (85/102, 83.3%) compared to 3 months (41/86, 47.7%) ( P < .03, P < .001).


