Purpose
To determine whether monoscopic vs stereoscopic viewing impacts evaluation of optic disc photographs for glaucoma diagnosis in an expert population.
Design
Prospective observational study.
Methods
Twenty pairs of high-quality monoscopic and stereoscopic photographs of similar size and magnification (ie, 40 images), were selected to demonstrate a range of optic disc features from a total of 197 eyes of 197 patients with glaucoma and normal subjects recruited from a tertiary clinic. These were presented in randomized order via an interactive platform ( http://stereo.gone-project.com/ ). Participants assessed 9 topographic features and estimated glaucoma likelihood for each photograph. Main outcome measures were intra- and inter-observer agreement.
Results
There was good intra-observer agreement between monoscopic and stereoscopic assessments of glaucoma likelihood (κ w = 0.56). There was also good to substantial agreement for peripapillary atrophy (κ w = 0.65), cup shape (κ w = 0.65), retinal nerve fiber layer loss (κ w = 0.69), vertical cup-to-disc ratio (κ w = 0.58), and disc shape (κ w = 0.57). However, intra-observer agreement was only fair to moderate for disc tilt, cup depth, and disc size (κ w = 0.46–0.49). Inter-observer agreement for glaucoma likelihood in monoscopic photographs (κ w = 0.61, 95% confidence interval [CI] = 0.55–0.67) was substantial and not lower than in stereoscopic photographs (κ w = 0.59, CI = 0.54–0.65). Monoscopic photographs did not lead to lower levels of inter-observer agreement compared to stereoscopic photographs in the assessment of any optic disc characteristics, for example disc size (mono κ w = 0.65, stereo κ w = 0.52) and cup-to-disc ratio (mono κ w = 0.72, stereo κ w = 0.62).
Conclusions
For expert observers in the evaluation of optic disc photographs for glaucoma likelihood, monoscopic optic disc photographs did not appear to represent a significant disadvantage compared to stereoscopic photographs.
Accurate, reproducible assessments of the optic disc and retinal nerve fiber layer (RNFL) are fundamental to glaucoma diagnosis. Clinical examination under mydriasis has been recommended as this offers a stereoscopic view of the optic disc and is associated with higher levels of agreement among examiners. The value of stereoscopic vs monoscopic optic disc photographs is less clear.
Monoscopic optic disc photography has some practical advantages relating largely to convenience, cost, and the fact that special stereoscopic viewers or screens are not required. Few studies have directly compared monoscopic to stereoscopic optic disc photographs. Some demonstrated a small but significant increase in the levels of agreement for specific optic disc features such as vertical cup-to-disc ratio, but this was not confirmed in additional studies.
Further, a systematic evaluation of the influence of other important features of the optic disc during clinical examination has not been conducted. This study therefore aimed to compare intra- and inter-observer agreement for a wide range of optic disc parameters pertinent to glaucoma diagnosis using mono- and stereoscopic optic disc photographs.
Methods
Approval from the Royal Victorian Eye and Ear Hospital’s institutional review board was obtained for this project (approval number 09/920H), and the research was conducted in accordance with the Declaration of Helsinki.
Optic Disc Assessment
An Internet-based system was used for the delivery of optic disc images and data acquisition, similar to the Glaucomatous Optic Neuropathy Evaluation (GONE) system previously described. Twenty pairs of monoscopic and stereoscopic optic disc images (ie, 40 images in total) were presented in randomized order via 2 viewing conditions.
A convenience sample of 197 eyes from 197 patients with glaucoma was recruited from a tertiary referral glaucoma clinic. Glaucomatous optic disc photographs were captured as part of routine disease monitoring. Normal subjects were also invited to participate. Informed consent for the use of images was obtained. The main exclusion factors were other known ophthalmic conditions and lack of patient time to participate. Monoscopic (mono) photographs were taken first with a Kowa VX-10 camera (Kowa, Tokyo, Japan) at a 25-degree field of view, followed by stereoscopic (stereo) images taken with a Nidek 3-DX camera (Nidek, Gamagori, Japan) at 25-degree field of view. All images were acquired following pharmacologic mydriasis. Images were originally shot in TIFF (monoscopic) and JPEG (stereoscopic) formats, as per accompanying software. All images were compared to ensure similar magnification and then stored as high-quality (low-compression) JPEG images of similar size. Images were screened for quality and 67 high-quality pairs of a total of 197 pairs were included. Sixty-four of these had concurrent visual fields, which were used to stratify into groups according to disease severity. Optic discs were classified as normal or glaucomatous based on clinical examination and visual field testing (Humphrey Field Analyzer HFA II 745i; Carl Zeiss Meditec AG, Jena, Germany). Mean deviation (MD) on visual fields was used to further stratify glaucomatous optic discs into mild (MD 0 to −6 db), moderate (MD −6 to −12 db), and severe glaucoma (MD >−12 db) using a modified Hodapp-Anderson-Parrish severity scale. Within each group, 5 pairs were randomly selected for inclusion, giving a final set of 20 paired monoscopic and stereoscopic images that adequately represented varying levels of disease severity.
Images were uploaded to http://stereo.gone-project.com/ and presented to all participants in batches of 10, with randomization to determine whether mono or stereo images were presented first, so that half of graders viewed the following order: 10 mono, 10 stereo, 10 mono, 10 stereo; while the other half viewed the reverse order: 10 stereo, 10 mono, 10 stereo, 10 mono. Photographs in each batch of 10 were randomly selected from the image set until there were no further images, and order within each batch was randomized, such that the grader’s current image and its order within the batch was unlikely to be influenced by the preceding 10 images. Photographs were shown individually at a recommended screen resolution of 1290 × 680 pixels at 32-bit color to participants who were provided identical pairs of 3D prism viewers (Berezin Inc, Mission Viejo, California, USA).
Data Collection
Twenty-two glaucoma subspecialists and glaucoma fellows were invited to participate. Sixteen agreed and completed the full series of photographs online. Graders comprised 14 consultants and 2 glaucoma fellows. They were asked to grade 9 morphologic features of the optic disc, which included: optic disc size, shape, and tilt; the degree of peripapillary atrophy (PPA); vertical cup-to-disc ratio (CDR); cup shape; cup depth; RNFL loss; and presence or absence of optic disc hemorrhage ( Table 1 ). Participants were asked to grade their clinical impression of glaucoma likelihood based on the optic disc appearance alone (no visual field testing or ancillary information was provided). Responses were captured on screen using multiple-choice format. All variables were graded on ordinal or nominal scales as detailed in Table 1 .
| Disc Characteristics | Categories |
|---|---|
| Disc size a | Hypo | Small | Medium | Large | Macro |
| Disc shape | Regular shape | Ovoid vertical | Ovoid horizontal |
| Disc tilt | No tilt | Tilt vertically | Tilt horizontally |
| Peripapillary atrophy a | Mild | Moderate | Extensive |
| Vertical cup-to-disc ratio a | <0.5 | 0.5 | 0.6 | 0.7 | 0.8 | 0.9 | >0.9 |
| Cup shape | No rim loss | Superior rim loss | Inferior rim loss | Superior & inferior rim loss | Temporal rim loss | Nasal rim loss | Concentric rim loss |
| Cup depth a | Shallow | Moderate | Deep | Undermined |
| Retinal nerve fiber layer loss | No loss | Focal loss superiorly | Focal loss inferiorly | Focal loss temporally | Focal loss nasally | Indeterminant |
| Hemorrhage | Absent | Present |
| Glaucoma likelihood a | 1 Unlikely | 2 Unlikely | 3 Possible | 4 Possible | 5 Possible | 6 Probable | 7 Probable | 8 Probable | 9 Certain | 10 Certain |
Statistics
Statistical analysis was similar to that described in detail in our previous study. Briefly, the levels of inter-observer agreement for each optic disc characteristic were calculated using kappa statistics (κ) for nominal variables (shape, tilt, cup shape, RNFL, and hemorrhage) and weighted kappa (κ w ) for ordinal variables (size, PPA, CDR, cup depth, and glaucoma likelihood). κ is a numerical value that ranges from −1 (complete disagreement) to +1 (total agreement), where 0 represents chance agreement. The agreement can be described as slight if κ is 0–0.20, fair if κ is 0.21–0.40, moderate if κ is 0.41–0.60, substantial if κ is 0.61–0.80, and very good if κ is 0.81–1.00.
Intra-observer agreement was computed by comparing responses of each observer, for all discs, under monoscopic to stereoscopic conditions. Inter-observer agreement was calculated by comparing each participant‘s responses to the “reference” answers for monoscopic as well as for stereoscopic viewing conditions. Modes of the answers for each optic disc parameter and glaucoma likelihood, for all discs, under stereoscopic viewing conditions were taken as reference answers. The average of individual agreements (κ) was taken as the overall level of agreement. Overall levels of agreement with 95% confidence intervals (CI) were calculated for all disc parameters and glaucoma likelihood.
Data for glaucomatous and nonglaucomatous optic discs were analyzed separately. Optic discs were grouped as glaucomatous or nonglaucomatous based on the consensus of a panel of 5 glaucoma subspecialists who assessed disc photographs in conjunction with clinical details, including visual fields and intraocular pressure. The probability of participants choosing a particular answer (unlikely, possible, probable, or certain) for both normal and glaucomatous discs was studied for monoscopic and stereoscopic conditions. Two-way analysis of variance (ANOVA) was used to compare distributions of answers in monoscopic and stereoscopic conditions.
To explore differences between mono and stereo assessment of optic disc parameters in detail, under- and overestimation of glaucoma likelihood was assessed. Underestimation was defined as rating glaucoma likelihood more than 1 scale point lower than the “reference” answer and overestimation was defined as rating glaucoma likelihood as more than 1 scale point higher. Factors contributing to increased risk of under- or overestimation were assessed using multivariate regression analysis.
The values κ and κ w were calculated using MedCalc (MedCalc Software, Mariakerke, Belgium). All other statistical analysis was performed with SPSS software (SPSS v15.00; SPSS Inc, Chicago, Illinois, USA).
Results
Intra-observer Agreement Between Monoscopic and Stereoscopic Assessments of Key Optic Disc Parameters
Intra-observer agreement was computed by comparing monoscopic assessment answers of each observer, for all discs, to the observer’s own stereoscopic assessment answers. There was good intra-observer agreement between monoscopic and stereoscopic estimates of glaucoma likelihood (κ w 0.56, CI 0.52–0.61). There was also good to substantial agreement for optic disc parameters of PPA (κ w 0.65, CI 0.59–0.71), cup shape (κ w 0.65, 0.58–0.72), RFNL loss (κ w 0.69, 0.57–0.80), CDR (κ w 0.58, 0.53–0.63), and disc shape (κ w 0.57, 0.53–0.62). However, intra-observer agreement was only fair to moderate for disc tilt (κ w 0.49, 0.40–0.58), cup depth (κ w 0.47, 0.39–0.54), and disc size (κ w 0.46, 0.38–0.54). Intra-observer agreement for hemorrhage (κ w 0.23, 0.03–0.43) was poor ( Table 2 ).
| Characteristic | Mean κ | 95% CI |
|---|---|---|
| Glaucoma likelihood a | 0.56 | 0.52–0.61 |
| Vertical cup-to-disc ratio a | 0.58 | 0.53–0.63 |
| Disc size a | 0.46 | 0.38–0.54 |
| Disc shape | 0.57 | 0.53–0.62 |
| Disc tilt | 0.49 | 0.40–0.58 |
| Peripapillary atrophy a | 0.65 | 0.59–0.71 |
| Cup shape | 0.65 | 0.58–0.72 |
| Cup depth a | 0.47 | 0.39–0.54 |
| Retinal nerve fiber layer loss | 0.69 | 0.57–0.80 |
| Hemorrhage | 0.23 | 0.03–0.43 |
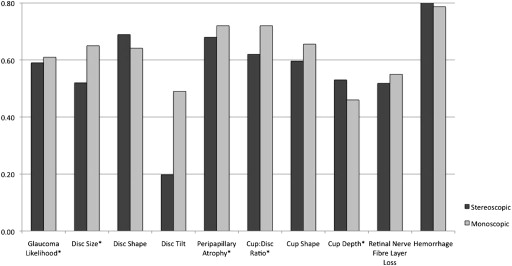
Inter-observer Agreement Among Monoscopic Assessments of Glaucoma Likelihood Not Worse Than Inter-Observer Agreement Among Stereoscopic Assessments
Inter-observer agreement was calculated by comparing each participant’s answers to the group mode for the variable, for monoscopic as well as for stereoscopic viewing conditions. The level of inter-observer agreement for monoscopic assessments of glaucoma likelihood (κ w 0.61, CI 0.55–0.67) was substantial and was not significantly lower than the level of inter-observer agreement for stereoscopic assessments (κ w 0.59, CI 0.54–0.65). Monoscopic viewing did not lead to significantly lower levels of inter-observer agreement compared to stereoscopic viewing in the assessment of any optic disc characteristics, in particular disc size (mono κ w 0.65, CI 0.58–0.71 vs stereo κ w 0.52, CI 0.44–0.60), disc tilt (mono κ w 0.49, CI 0.36–0.61 vs stereo κ w 0.20, CI 0.10–0.29), and CDR (mono κ w 0.72, CI 0.65–0.79 vs stereo κ w 0.62, CI 0.54–0.69) ( Figure 1 , Table 3 ). In monoscopic assessments, inter-observer agreement was lowest for cup depth (κ w 0.46, CI 0.36–0.56), although this was not significantly lower compared to stereoscopic assessment (κ w 0.53, CI 0.45–0.61).
| Disc Characteristics | Stereoscopic View | Monoscopic View | ||
|---|---|---|---|---|
| Mean | 95% CI | Mean | 95% CI | |
| Glaucoma likelihood a | 0.59 | 0.54–0.65 | 0.61 | 0.55–0.67 |
| Disc size a | 0.52 | 0.44–0.60 | 0.65 b | 0.58–0.71 |
| Disc shape | 0.69 | 0.61–0.77 | 0.64 | 0.56–0.72 |
| Disc tilt | 0.20 | 0.10–0.29 | 0.49 b | 0.36–0.61 |
| Peripapillary atrophy a | 0.68 | 0.60–0.76 | 0.72 | 0.64–0.78 |
| Vertical cup-to-disc ratio a | 0.62 | 0.54–0.69 | 0.72 b | 0.65–0.79 |
| Cup shape | 0.60 | 0.52–0.67 | 0.66 | 0.58–0.73 |
| Cup depth a | 0.53 | 0.45–0.61 | 0.46 | 0.36–0.56 |
| Retinal nerve fiber layer loss | 0.52 | 0.42–0.62 | 0.55 | 0.47–0.63 |
| Hemorrhage | 0.81 | 0.72–0.91 | 0.79 | 0.69–0.89 |
a Linear weighting was used for ordinal variables.
b Optic disc parameters for which inter-observer kappas for monoscopic viewing lie outside the 95% confidence interval for stereoscopic viewing.
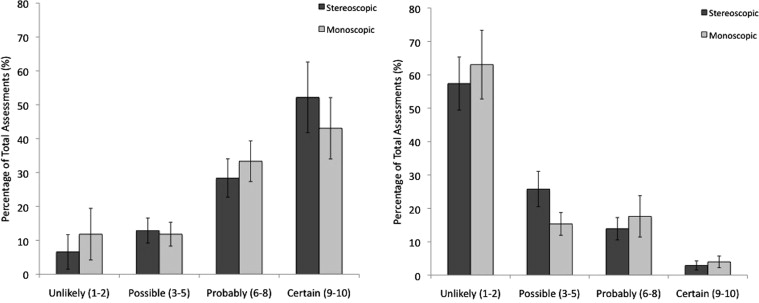
No Statistical Difference in the Distribution of Answers Between Monoscopic and Stereoscopic Assessments of Glaucoma Likelihood
When glaucomatous and nonglaucomatous optic discs were analyzed separately, there was no significant difference in either group in the distribution of answers for estimated glaucoma likelihood when viewed under monoscopic or stereoscopic conditions (ANOVA glaucomatous P = .688, nonglaucomatous P = .502) ( Figure 2 ). The assessment of glaucoma likelihood was not significantly influenced by viewing conditions. Of the glaucomatous optic discs, 81% ± 8% of responses to stereoscopic photographs and 76% ± 10% of responses to monoscopic photographs ( P = .37) were graded as probable or certain glaucoma. Of the nonglaucomatous optic discs, 83% ± 4% of responses to stereoscopic photographs and 78% ± 8% of responses to monoscopic photographs ( P = .44) were graded as unlikely or possible glaucoma.