Purpose
To analyze the repeatability of measuring the thickness of the ganglion cell–inner plexiform layer using spectral-domain optical coherence tomography by auto-segmentation in various retinal diseases.
Design
Test-retest reliability analysis.
Methods
A total of 180 patients who visited our clinic between April and December 2013 were included. An experienced examiner obtained 2 consecutive measurements from a macular cube 512 × 128 scan. The patients were divided into 3 groups according to central macular thickness. Repeatability was determined by comparing the average, minimum, and 6 sectoral ganglion cell–inner plexiform layer thickness values among groups.
Results
Data from 165 of the 180 patients were included in the analysis. Measurement errors occurred in 3 patients (6%) in the macular atrophy group and 12 (20%) in the edema group. The measurement repeatability for ganglion cell–inner plexiform layer thickness was high in the normal eye group (average intraclass correlation coefficient [ICC], 0.994; coefficient of variation [COV], 0.7%; and test-retest variability, 1.1 μm), relatively low in the macular edema group (average ICC, 0.845; COV, 18.7%; and test-retest variability, 27.8 μm), and lowest in the macular atrophy group (ICC, 0.610; COV, 30.4%; and test-retest variability, 29.2 μm) compared to the normal eye group.
Conclusions
The repeatability of ganglion cell–inner plexiform layer thickness measurements was lower in the macular edema and atrophy groups. The impact of changes in macular shape caused by various retinal diseases should be taken into consideration when measuring ganglion cell–inner plexiform layer thickness in other diseases such as glaucoma and neuro-ophthalmology.
Optical coherence tomography (OCT) is a noninvasive diagnostic tool used for the quantitative measurement of retinal conditions. OCT allows light to penetrate into tissues, which creates time-delay differences in the intensity of the reflected light; these are transformed into high-resolution images by an optical interferometer. Spectral-domain OCT (SD OCT) is more sensitive and has finer resolution than time-domain OCT (TD OCT) and is widely used to measure the microstructure the retinal layers.
SD OCT is useful for the diagnosis and monitoring of retinal disease over time because it allows for precise measurement of macular thickness and volume, has high repeatability and reproducibility, and is readily used in the clinical setting.
Recently, as interest in the ganglion cell–inner plexiform layer has grown, SD OCT has been found to be useful for the investigation of glaucoma and optic nerve and macular diseases. The ganglion cell–inner plexiform layer thickness can be measured directly using a manual method or automatically using auto-segmentation to measure the thickness of each layer of the OCT images.
Auto-segmentation may be affected by retinal elevation or atrophy, and the repeatability also could be affected. The low repeatability of measurements means that values are not reliable. Therefore, we investigated the repeatability of measurements of ganglion cell–inner plexiform layer thickness using SD OCT auto-segmentation software in patients with macular aberrations caused by various retinal diseases.
Methods
The institutional review board of Chungnam National University Hospital in South Korea approved this prospective study. All participants provided written informed consent and the study adhered to the tenets of the Declaration of Helsinki.
Subjects
The test-retest reliability analysis included 180 patients who visited our retinal clinic between April 1, 2013 and December 31, 2013. All subjects underwent uncorrected and best-corrected visual acuity examinations, refraction measured using an automatic refractometer, an intraocular pressure test using a noncontact tonometer, slit-lamp biomicroscopy, funduscopy, fundus photography, and OCT imaging.
We included patients with no history of ophthalmic surgery including refractive surgery; no history of being previously diagnosed with an ophthalmic condition such as an optic nerve disease, glaucoma, dry eye syndrome, media opacity, or cataract; and intraocular pressure <21 mm Hg. We also excluded patients whose signal strength was under 5, so we could exclude other possible factors that affect the measurement.
Optical Coherence Tomography Measurement
An experienced examiner obtained 2 consecutive measurements from a macular cube 512 × 128 scan using SD OCT (Cirrus HD OCT; Carl Zeiss Meditec, Inc, Dublin, California, USA) at the same setting. The patients were divided into 3 groups based on central macular thickness: the macular atrophy group, <200 μm; normal macular group, 200–300 μm; and the macular edema group, >300 μm. Then we analyzed the ganglion cell–inner plexiform layer thickness of each group based on an algorithm obtained using the “Ganglion Cell Analysis” module of Cirrus version 6 software.
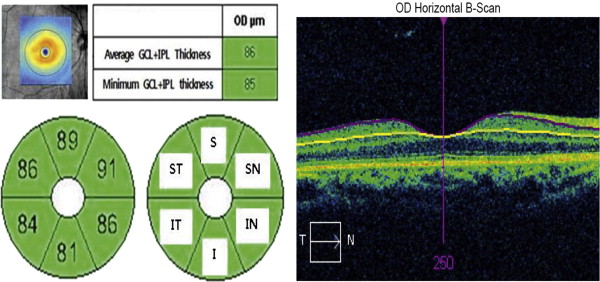
The ganglion cell analysis algorithm automatically measured ganglion cell–inner plexiform layer thickness by identifying the outer boundaries of the retinal nerve fiber layer (RNFL) and inner plexiform layer of the macula using 3-dimensional information from the macular cube. The ganglion cell–inner plexiform layer was measured in a 3-dimensional oval annulus corresponding to the anatomic structure of the macula. The annulus comprised a vertical inner and outer diameter of 1.0 and 4.0 mm and horizontal inner and outer diameter of 1.2 and 4.8 mm, respectively, and corresponded to the thickest portion of the ganglion cell layer in a normal eye so ganglion cell–inner plexiform layer thickness could be accurately measured.
Repeatability was determined by comparing the average, minimum, and 6 sectoral (superior, superotemporal, superonasal, inferior, inferonasal, and inferotemporal) ganglion cell–inner plexiform layer thickness values among groups ( Figure 1 ).
Statistical Analysis
Central macular thickness and ganglion cell–inner plexiform layer (average, minimum, and the 6 sectoral values) were analyzed. Repeatability of the 2 consecutive measurements of ganglion cell–inner plexiform layer thickness was assessed using the intraclass correlation coefficient (ICC), coefficient of variation (COV), and test-retest variability.
ICC is the correlation between 2 variables measured at different time points ( t ) with values ranging from 0 to 1. As the ICC value approaches 1, the repeatability of the measurement increases proportionally. COV is the ratio of the standard deviation and the mean expressed as a percentage, and the closer the value is to 0, the higher the repeatability. Test-retest variability (μm), as indicated by the coefficient of repeatability, was calculated by multiplying the standard deviation of the difference between the measurements by 2. High repeatability was indicated by test-retest variability values close to 0.
The agreement between the 2 measurements was assessed using Bland-Altman plots, and P values < .05 were deemed to indicate statistical significance.
Results
Demographics
Of the 180 patients, 165 (80 male and 85 female) were included in the analysis; 15 patients (3 in the macular atrophy and 12 in the macular edema group) were excluded owing to measurement error. The macular atrophy group included 51 patients with such diagnoses as geographic atrophy in age-related macular degeneration, macular atrophy associated with retinal vein occlusion, and myopic maculopathy. The macular edema group comprised 49 patients with diabetic macular edema, central serous chorioretinopathy, and macular edema secondary to retinal vein occlusion. A total of 65 patients were in the normal eye group ( Table 1 ).
| CMT < 200 μm (n = 51) | 200 μm < CMT < 300 μm (n = 65) | CMT ≥ 300 μm (n = 49) | P Value a | |
|---|---|---|---|---|
| Mean age (y) | 70.8 ± 9.3 | 58.8 ± 8.9 | 56.2 ± 13.3 | .026 |
| Sex (male:female) | 23:28 | 35:30 | 22:27 | .352 |
| Laterality (OD: OS) | 24:27 | 34:31 | 26:23 | .540 |
| Refractive error (diopters) | 1.5 ± 2.5 | 0.5 ± 1.5 | −0.5 ± 2.0 | .052 |
| BCVA (Snellen) | 20/50 | 20/20 | 20/63 | .015 |
| Diagnosed disease (number of patients) | ||||
| AMD | 27 | – | 4 | – |
| Myopic maculopathy | 12 | – | – | – |
| RVO | 8 | – | 16 | – |
| CSC | 4 | – | 13 | – |
| DME | – | – | 14 | – |
Optical Coherence Tomography Measurement
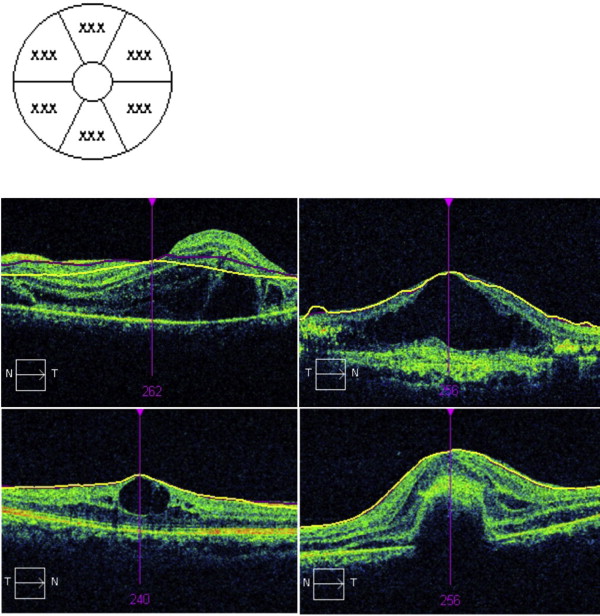
Cases of algorithm segmentation failure owing to severe macular elevation or atrophy were considered measurement errors and excluded from the analysis. We defined measurement error if the retinal thickness was not indicated as the number in the map. Measurement errors occurred in 3 patients (6%) in the macular atrophy group and 12 patients (20%) in the edema group. Every patient with measurement error was excluded from further analyses.
The average central macular thickness was 162.6 ± 8.1 μm, 247.8 ± 0.9 μm, and 402.7 ± 13.4 μm in the atrophy, normal eye, and edema groups, respectively. The average ganglion cell–inner plexiform layer thickness was 47.1 ± 19.5 μm, 82.4 ± 6.5 μm, and 72.7 ± 22.1 μm in the atrophy, normal eye, and edema groups, respectively ( Figure 1 ). The ganglion cell–inner plexiform layer was significantly thinner in the atrophy and edema groups than in the normal group ( P = .001) ( Figure 2 ).
Repeatability of Ganglion Cell–Inner Plexiform Layer Thickness Measurement
The ICCs of central macular thickness in the atrophy, normal eye, and edema groups were 0.998, 0.985, and 0.903, respectively, indicating high repeatability for all groups. However, the degree of repeatability differed among the groups, being highest in the normal eye group (average ICC, 0.994; COV, 0.7%; and test-retest variability, 1.1 μm; Table 2 ), lower in the macular edema group (average ICC, 0.845; COV, 18.7%; and test-retest variability, 27.8 μm), and lowest in the macular atrophy group (ICC, 0.610; COV, 30.4%; and test-retest variability, 29.2 μm) ( Tables 3 and 4 ). We assessed the same data using Bland-Altman plots; repeatability was considerably lower in the macular edema and atrophy groups than in the normal eye group in terms of the lower and upper limits of agreement (respective lower and upper limits: edema group, −23.7 to −53.5 μm and 21.9∼52.2 μm; atrophy group, −32.7 to −43.7 μm and 33.7–39.8 μm; normal eye group, −1.81 to 0.98 μm and 1.24–1.85 μm).
| First Measured Value (μm) | Second Measured Value (μm) | ICC | COV (%) | TVR (μm) | |
|---|---|---|---|---|---|
| CMT | 248.0 ± 18.9 | 247.7 ± 18.9 | 0.998 (0.996–0.999) | 0.4 | 0.1 |
| GCIPL | |||||
| Average | 82.4 ± 6.5 | 82.3 ± 6.6 | 0.996 (0.994–0.998) | 0.5 | 0.9 |
| Minimum | 78.3 ± 7.9 | 78.3 ± 7.8 | 0.995 (0.992–0.997) | 0.7 | 1.1 |
| Superior | 82.7 ± 7.5 | 82.6 ± 7.6 | 0.994 (0.990–0.996) | 0.7 | 1.2 |
| Superotemporal | 81.9 ± 7.3 | 81.7 ± 7.2 | 0.993 (0.989–0.996) | 0.7 | 1.2 |
| Inferotemporal | 82.9 ± 6.8 | 82.8 ± 7.0 | 0.993 (0.988–0.996) | 0.7 | 1.1 |
| Inferior | 79.9 ± 6.4 | 79.8 ± 6.3 | 0.990 (0.984–0.994) | 0.8 | 1.2 |
| Inferonasal | 82.6 ± 6.3 | 82.8 ± 6.4 | 0.992 (0.986–0.995) | 0.7 | 1.3 |
| Superonasal | 84.3 ± 7.7 | 84.2 ± 7.6 | 0.996 (0.993–0.998) | 0.6 | 1.0 |
| First Measured Value (μm) | Second Measured Value (μm) | ICC | COV (%) | TVR (μm) | |
|---|---|---|---|---|---|
| CMT | 400.1 ± 110.4 | 400.7 ± 108.4 | 0.985 (0.975–0.992) | 3.3 | 32.3 |
| GCIPL | |||||
| Average | 69.2 ± 23.1 | 77.5 ± 22.4 | 0.878 (0.796–0.929) | 11.1 | 16.1 |
| Minimum | 32.6 ± 22.6 | 77.5 ± 22.4 | 0.844 (0.742–0.908) | 26.0 | 21.3 |
| Superior | 72.2 ± 37.1 | 86.1 ± 41.3 | 0.869 (0.781–0.923) | 18.4 | 30.2 |
| Superotemporal | 71.9 ± 37.3 | 82.6 ± 36.3 | 0.893 (0.819–0.937) | 16.1 | 28.0 |
| Inferotemporal | 70.0 ± 36.5 | 81.6 ± 36.5 | 0.866 (0.776–0.921) | 17.9 | 30.5 |
| Inferior | 54.9 ± 26.2 | 65.3 ± 30.8 | 0.851 (0.753–0.912) | 18.9 | 24.6 |
| Inferonasal | 63.4 ± 26.8 | 72.6 ± 27.6 | 0.835 (0.727–0.902) | 16.7 | 26.4 |
| Superonasal | 70.1 ± 32.3 | 84.1 ± 38.0 | 0.726 (0.565–0.834) | 24.5 | 45.4 |
Stay updated, free articles. Join our Telegram channel

Full access? Get Clinical Tree


