Purpose
To estimate the prevalence, genotype, and clinical spectrum of Best vitelliform macular dystrophy (Best disease).
Design
Retrospective epidemiologic and clinical and molecular genetic observational study.
Methods
setting: National referral center. participants: Forty-five individuals diagnosed with Best disease. observation procedures: Retrospective review of patients diagnosed according to clinical findings and sequencing of BEST1 . Patients with recently established molecular genetic diagnosis were followed up including multifocal electroretinography (mfERG), spectral-domain optical coherence tomography (SD-OCT), and fundus autofluorescence (FAF) imaging. main outcome measures: BEST1 mutations, SD-OCT and FAF findings, mfERG amplitudes, prevalence estimate of Best disease.
Results
BEST1 mutations described previously in Danish patients with Best disease are reviewed. In addition, we identified a further 8 families and 1 sporadic case, in whom 6 BEST1 missense mutations were found, 4 of which are novel. The mutation c.904G>T (p.Asp302Asn) was identified in members of 4 unrelated families. Structural alterations ranged from precipitate-like alterations at the level of the photoreceptor outer segments (OS) to choroidal neovascularization. The extent of the former correlated with the reduction of retinal function. A prevalence estimate of Best disease in Denmark based on the number of diagnosed cases was 1.5 per 100 000 individuals.
Conclusions
Our data expand the mutation spectrum of BEST1 in patients with Best disease. Alterations of the OS overlying lesions with subretinal fluid are similar to those seen in central serous retinopathy and may indicate impaired turnover of OS. Our frequency estimate confirms that Best disease is one of the most common causes of early macular degeneration.
Heterozygous mutations in the Bestrophin 1 gene ( BEST1) are the molecular basis of Best vitelliform macular dystrophy, also known as Best disease, which is inherited mainly in an autosomal dominant mode. Autosomal recessive BEST1 mutations are usually associated with more severe retinal dystrophies, such as autosomal recessive bestrophinopathy (ARB) and retinitis pigmentosa. Best disease is considered a rare genetic disease, but the prevalence in still unknown. A previous estimate of its prevalence, carried out in northern Sweden, arrived at 2 persons per 10 000.
The typical manifestations and progression of Best disease through different clinical stages based on ophthalmoscopic fundus appearance have been known for decades, describing the pattern and evolution of vitelliform alterations ranging from stage 0, with a normal fundus, to stage 4, with fibrosis or atrophy. Further characterization of microstructural alterations by optical coherence tomography, fundus autofluorescence imaging, and histopathology has revealed lipofuscin accumulations in and around the retinal pigment epithelium, subretinal fluid, and varying amounts of photoreceptor atrophy. In a recent paper, we found a relationship between the degree of preservation of the photoreceptor inner segment–outer segment junction in the central retina and visual function. Further understanding of the relationship between structure and function in Best disease is spurred by the recent work aiming at developing gene therapy (Guziewicz K, et al. IOVS 2011;52:ARVO E-Abstract 4378) for canine multifocal retinopathy, an animal model for Best disease. More specifically, there will probably exist a therapeutic window for successful gene therapy. Obviously, by the time that stage 4 has been reached, gene therapy will most likely fail to produce any effect on vision. Thus a more nuanced understanding of the relationship between structure and function in Best disease may be useful in determining which patients may be eligible for future gene therapy.
This study was initiated to estimate the prevalence of Best disease in the Danish population, and to describe its mutation spectrum. We also present a detailed analysis of retinal function and structure among Danish patients with Best disease in whom a molecular genetic diagnosis was established in the present study.
Patients and Methods
Probands were identified from the files of the National Low Vision Eye Clinic, which offers specialized diagnostics and optical rehabilitation and is a national referral center. This retrospective study comprised all patients examined between 1980 and 2006 including children 0 to 18 years of age with Snellen visual acuities 0.3 or less reported to a compulsory national registry at the clinic. Additional patients were identified in a national family archive for genetic eye diseases at the national low vision eye clinic. Patients in whom a molecular genetic diagnosis was recently established (10 patients in the present study) were offered a clinical follow-up examination.
Clinical and Statistical Methods
Danish patients with Best disease who have not been described previously and in whom we recently identified causative mutations (presented herein) in BEST1 were offered a follow-up examination including a standard clinical examination, including multifocal electroretinography (mfERG) with infrared fundus camera to monitor fixation during the recording, fundus autofluorescence imaging, and spectral-domain optical coherence tomography (SD-OCT) as described previously. Measures of foveal thickness and maximum height of subfoveal fluid were obtained manually using calipers and were measured on horizontal transfoveal line scans.
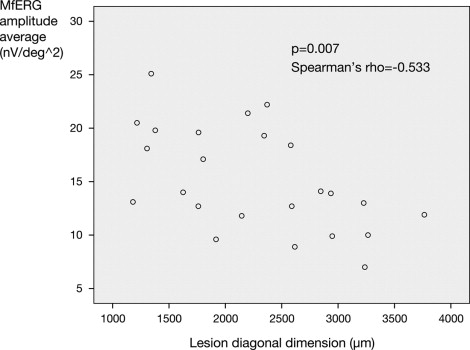
To explore the consequences of the precipitate-like alterations at the level of the photoreceptor outer segments in terms of retinal function, we measured the extent of these changes, which coincided with the extent of subretinal fluid, along the 2 diagonal axes for each lesion, using manual caliper measurement on the Spectralis (Spectralis OCT; Heidelberg Engineering, Heidelberg, Germany) infrared fundus images obtained simultaneously with the SD-OCT ( Figure 1 ) . These SD-OCT-guided fundus photographic caliper measurements of lesion size were obtained in duplicate by 2 independent observers. The described measures of lesion size (2 for each lesion) were correlated with the extent of reduction of mfERG amplitude averages along the corresponding diagonal axes ( Figure 1 ). The latter were obtained as follows.
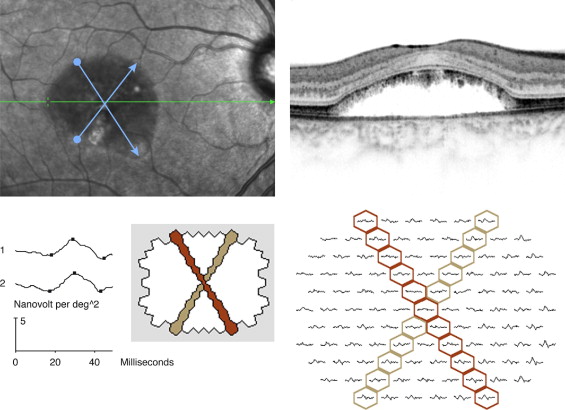
With the mfERG VERIS software (VERIS 5; EDI, San Mateo, California, USA), it is possible to average any combination of the 103 local responses. This is done by selecting each required local response to be included in the averaging. A common mode of presentation is amplitudes in concentric rings around the center (ring averages). For this analysis, we chose to average the amplitudes for all local responses along diagonal axes, corresponding to the diagonal axes of the extent of subretinal fluid for a given lesion.
Lesion size was measured with calipers on the fundus photography, which was obtained simultaneously with the SD-OCT recording. The extent of subretinal fluid along each diagonal axis defined lesion size. In all patients thus analyzed, the constant OCT findings along these diagonals were: 1) subretinal fluid; and 2) precipitate-like abnormalities at the level of the photoreceptor outer segments. With the Spectralis SD-OCT software, there is a point-to-point correspondence between the SD-OCT scan and the fundus image. The fundus diagonal was measured across the area that featured precipitate-like abnormalities at the level of the outer segments and subretinal fluid, crossing the point of fixation (fovea). Thus for each lesion, we obtain 2 SD-OCT-guided fundus photographic measures of lesion size and 2 mfERG measures, 1 for each diagonal. The principles of measurement of lesion diagonal and corresponding mfERG averaging are presented in Figure 1 .
To validate that the diagonal measurements between the extent of subretinal fluid (lesion size) and the mfERG measurements were in accordance (ie, at the same anatomic location), we used infrared camera fundus monitoring during the mfERG recording, a relatively recent feature of the mfERG VERIS equipment. Thus fixation could be assessed during the recording, and segments of the recordings that featured poor fixation were discarded and rerecorded. Furthermore, there is only 1 way to obtain a linear diagonal of adjacent hexagons crossing and including the central hexagon; that is, these diagonals will be given unambiguously ( Figure 1 ). The OCT-guided fundus photographic measurements of lesion size were subsequently obtained across the foveal fixation point, at axes corresponding to those defined by the mfERG diagonals, as judged from anatomic landmarks (eg, blood vessels) present on the fundus infrared camera monitoring during mfERG registration. The OCT-based fundus photographic measurements of lesion size were obtained manually with calipers by 2 observers, independently, according to the above.
The analysis included both eyes of 5 patients (age range 38-55 years) with the genotypes p.Asn99His, p.Asp302Asn (2 patients), p.Leu20Val, and p. Asn296Ser, resulting in a total of 10 eyes or 20 points of measurement (corresponding to the 2 diagonal axes for each lesion). A further 2 right eyes of 2 patients aged 25 and 54, with mutation p.Asn296Ser, were also included. These patients were the ones in whom we had data from both modalities (mfERG and SD-OCT) and in whom subretinal fluid was found along with photoreceptor abnormalities. Most of these eyes were in a clinical stage equivalent to the vitelliruptive stage, and all demonstrated variable amounts of subretinal fluid accumulation.
As a secondary outcome measure, mfERG central amplitudes (rings 1-2), lesion size, electro-oculography (EOG) value, foveal thickness, height of subretinal fluid, and age were analyzed for correlation with visual acuity.
Statistical analysis of correlation was carried out with Spearman rank correlation (SPSS 16 [originally, Statistical Package for the Social Sciences; IBM, Armonk, New York, USA]).
Molecular Genetic Methods
DNA was extracted from the peripheral blood samples collected from members of 8 families and 1 isolated case. BEST1 exons as well as the flanking intronic regions were amplified by standard polymerase chain reaction followed by direct sequencing of the corresponding fragments. Primer sequences for BEST1 amplification from genomic DNA were previously reported as follows: exons 2-3 and 5-11 6 and exon 4.
To estimate the pathogenicity of novel missense changes, we used the following in silico tools: Polyphen-2 ( http://genetics.bwh.harvard.edu/pph2/index.shtml ) and MutationTaster ( http://neurocore.charite.de/MutationTaster/index.html ).
Results
Minimum Prevalence Estimate of Best Disease in Denmark
In all, we identified 45 individuals with Best disease born between 1924 and 2002 and living on January 1, 2011, in whom a BEST1 mutation was found previously or in the present study. The corresponding prevalence rate was 0.8:100 000. Selecting individuals born in the 25-year period 1961 through 1985, in which the registration was most complete, corresponded to a birth prevalence rate of 1.5:100 000 (26 cases in 1 726 407 live births). Most cases (43 out of 45) belonged to families with 2 to 8 affected individuals; 15 such families were identified ( Table 1 ).
| BEST1 Mutation (Protein Affected) | Exon | Polyphen-2 Prediction (Score) a | MutationTaster Prediction (Probability) b | Family | Reference |
|---|---|---|---|---|---|
| c.58C>G (p.Leu20Val) | 2 | Probably damaging (0.999) | Disease causing ( P = .999) | VMD20110 | This study, novel |
| c.244C>G (p.Leu82Val) | 3 | Probably damaging (1.000) | Disease causing ( P = .771) | VMD20108 | 8,11 (family DIV) |
| c.253T>C (p.Tyr85His) | 4 | Probably damaging (1.000) | Disease causing ( P = .596) | VMD200014 | 8 (family DI) |
| c.275G>A (p.Arg92His) | 4 | Probably damaging (1.000) | Disease causing ( P = .999) | VMD200034 | 8 (family DIII) |
| c.287A>G (p.Gln96Arg) | 4 | Probably damaging (1.000) | Disease causing ( P = .979) | VMD24003 c | Bakall B, 1999 d |
| VMD20112 | This study, novel | ||||
| c.295A>C (p.Asn99His) | 4 | Benign (0.329) | Polymorphism ( P = .783) | VMD24004 c | This study, novel |
| c.652C>T (p.Arg218Cys) | 6 | Probably damaging (1.000) | Disease causing ( P = .999) | VMD20101 | 12 |
| c.728C>T (p.Ala243Val) | 7 | Probably damaging (1.000) | Disease causing ( P > .999) | VMD200022 | 13 |
| c.887A>G (p.Asn296Ser) | 8 | Probably damaging (0.992) | Disease causing ( P = .989) | VMD20107 | 14 and this study |
| c.904G>T (p.Asp302Asn) | 8 | Probably damaging (1.000) | Disease causing ( P = .999) | VMD20102 | This study, novel |
| VMD20105 | This study | ||||
| VMD20106 | This study | ||||
| VMD200035 | This study | ||||
| c.905A>C (p.Asp302Ala) | 8 | Probably damaging (1.000) | Disease causing ( P = .999) | VMD20109 | 15, this study |
| c.936C>A (p.Asp312Glu) | 8 | Probably damaging (1.000) | Disease causing ( P = .987) | VMD200038 | 8,16 (family DII) |
a Polyphen-2 predicts the functional significance of an allele replacement from its individual features by Naïve Bayes classifier trained using supervised machine learning with a score ranging from 0 to 1.00.
b MutationTaster employs a Bayes classifier to eventually predict the disease potential of an alteration. The P value is the probability of the prediction (ie, a value close to 1 indicates a high “security” of the prediction).
Mutation Analysis
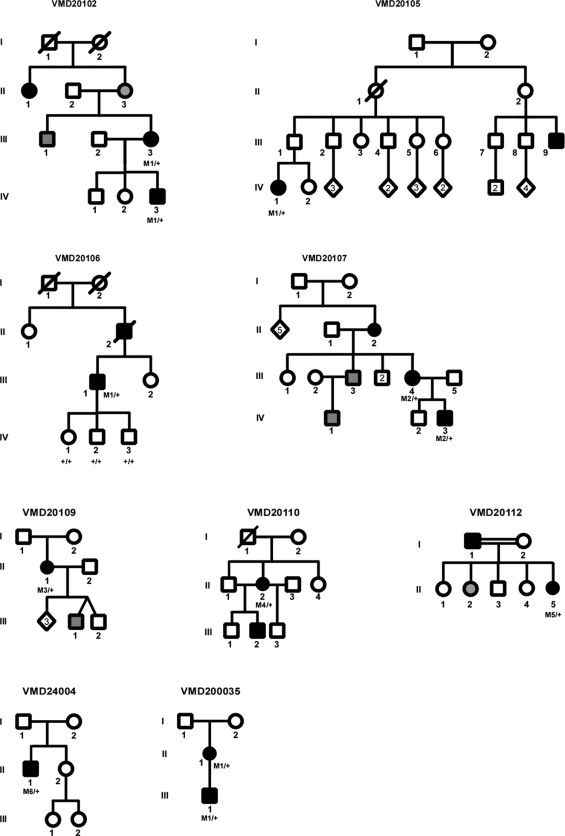
Mutations in BEST1 identified in Danish families in the present study and in previous studies are summarized in Tables 1 and 2 . In the present study, sequencing analysis of all BEST1 exons revealed heterozygous missense changes that are likely pathogenic in all 8 analyzed families as well as 1 sporadic case ( Figure 2 ; Supplemental Figure 1 , available at AJO.com ; Table 1 ). Two of the 6 mutations we identified have been previously described in patients with Best disease: p.Asn296Ser, which was reported in 1 patient and was identified in this study in an index patient and her affected son (family VMD20107), and p.Asp302Ala, which we identified in an index patient and her affected son (family VMD20109). The remaining 4 mutations were not reported thus far ( Table 1 , which includes Danish families and mutations reported earlier): p.Leu20Val (in the index case of VMD20110), p.Gln96Arg (in the index case of VMD20112, a father of Turkish descent and his daughter). The p.Gln96Arg mutation was also found in an unrelated sporadic case, VMD24003, but never published (Bakall B, personal communication, 1999); p.Asn99His in an isolated case from family VMD24004; and p.Asp302Asn identified in 4 apparently unrelated families: VMD20102, VMD20105, VMD20106, and VMD24005 ( Table 2 ). Genealogical tracing of ancestors back to about the year 1800 did not show any links between these 4 families, which, however, clustered around a few neighboring parishes, thus making it possible that p.Asp302Asn is indeed a founder mutation.
| Patient (Family) | Sex/Age | BEST1 Mutation (Protein Affected) | Clinical Findings OD/OS | Age at Onset (Age First Documented, VA OD/VA OS) | VA Recent Exam, OD/OS | Lesion Size, a OD/OS (μm) | EOG, OD/OS Arden Ratio |
|---|---|---|---|---|---|---|---|
| 76968 (VMD20102) | M/35 | c.904G>T (p.Asp302Asn) | Atrophic/Atrophic | 16 (16, 0.1/0.4) | N/A | N/A | 2.8/2.8 |
| 76970 (VMD20105) | F/35 | c.904G>T (p.Asp302Asn) | Atrophic/Vitelliruptive | 23 (23, 0.3/0.4) | N/A | N/A | 1.7/1.4 |
| 76971 (VMD20106) | M/66 | c.904G>T (p.Asp302Asn) | Vitelliruptive/Atrophic | 9 (9, 0.08/0.4) | 0.1/0.05 | 2462/3496 | 1.1/1.1 |
| 76972 (VMD20107) | F/54 | c.887A>G (p.Asn296Ser) | Vitelliruptive/Vitelliruptive | 54 (54, 0.9/0.2) | 0.9/0.2 | 2718/4597 | 1.1/1.3 |
| Son of 76972 (VMD20107) | M/25 | c.887A>G (p.Asn296Ser) | Vitelliruptive/Vitelliruptive | 10 (10, 0.2/0.2) | 0.6/0.7 | 2285/1637 | N/A |
| 76973 (VMD20109) | F/61 | c.905A>C (p.Asp302Ala) | Vitelliruptive/Vitelliruptive | 15 (45, 0.4/0.4) | 0.3/0.4 | 3251/2031 | 1.0/1.0 |
| 76976 VMD20110) | F/50 | c.58C>G (p.Leu20Val) | Fibrotic/Fibrotic | 36 (36, 1.0/0.8) | 0.05/0.7 | 2348/1261 | N/A |
| 56691 (VMD24004) | M/41 | c.295A>C (p.Asn99His) | Fibrotic/Vitelliruptive | 16 (16, 1.0/0.5) | 0.8/0.8 | 1403/2782 | 1.5/1.6 |
| 78502 (VMD200035) | F/37 | c.904G>T (p.Asp302Asn) | Vitelliruptive/Vitelliruptive | 37 (37, 0.8/0.4) | 0.9/0.8 | 1360/1783 | N/A |
| 78503 (VMD200035) | M/10 | c.904G>T (p.Asp302Asn) | Fibrotic/Vitelliform | 10 (10, 0.2/0.2) | 0.2/0.2 | 1963/1165 | N/A |
a Average of the 2 diagonal lesion dimensions for each eye, as measured by calipers in the Spectralis fundus image.
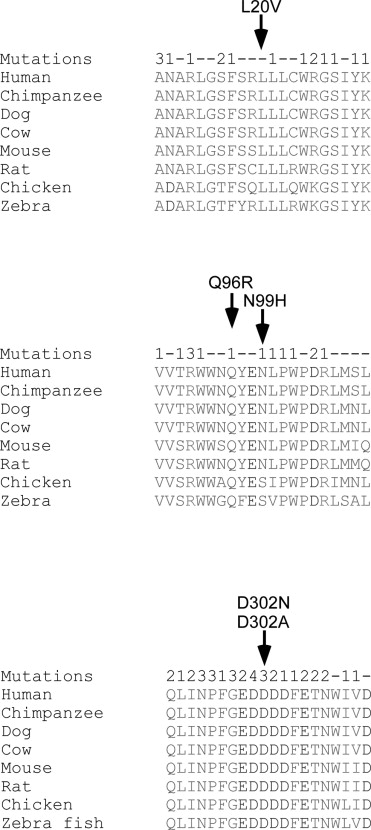
To estimate the pathogenicity of these missense changes, we evaluated the conservation of the affected residues during evolution, the presence of mutations affecting adjacent residues or even the same residue, and we performed an in silico analysis using Polyphen-2 and MutationTaster ( Table 1 ). Three of the 4 residues affected by the novel mutations are perfectly conserved during evolution ( Figure 3 ) , while Asn99 is moderately conserved, but never replaced by histidine. In addition, mutations were already reported to affect many amino acid residues that are adjacent to the 4 residues affected by novel missense mutations that we describe here ( Figure 3 ). Moreover, mutations are already known to affect 2 of the 4 residues (Asn99 by 1 mutation and Asp302 by 3 different missense mutations). Analysis by Polyphen-2 and MutationTaster revealed a high score for the effect on protein function for 3 of the 4 mutations, while a low score was obtained for p.Asn99His ( Table 1 ). We therefore suggest that 3 (p.Leu20Val, p.Asp302Asn, and p.Asp302Ala) of the 4 mutations are likely pathogenic, while p.Asn99His is possibly pathogenic. No family members were available to verify the segregation of this mutation in the corresponding families.
Clinical Evaluation
Clinical data in patients with Best disease identified in the present study are presented in Table 2 . Considering all identified patients including previous studies, we found a median age of onset in Best disease of 19 years (range 4-65). In the present study, the size of the vitelliform lesion exceeded half a disc diameter in all patients except in 2 patients in whom both eyes had lesions smaller than a half disc diameter.
We aimed at clinical follow-up in the 10 patients in whom a molecular genetic diagnosis was confirmed only recently by us (as presented in this paper in Table 2 ). Eight of these accepted a follow-up examination, including optical coherence tomography, fundus autofluorescence imaging, and mfERG. Thus, 16 eyes of 8 patients were examined by these modalities at follow-up, except for mfERG, which was not possible in the youngest patient (Patient 78503, age 10) and was performed only in the right eye of Patient 76972 and her son, thus resulting in a total of 12 eyes examined by mfERG.
Best-corrected visual acuities in the best eye ranged between 0.1 and 0.9 and in the worst eye between 0.05 and 0.8 ( Table 2 ). All but 2 patients demonstrated stability or decline of visual acuity over follow-up (follow-up range 10-55 years, Table 2 ). The 2 exceptions in whom a seeming improvement of vision was seen included a boy in whom the first examination was performed at the age of 10 (son of Patient 76972, with the p.Asn296Asr mutation) and whose results may thus have been flawed by problems with cooperation, and a woman (Patient 78502, age 37, p.Asp302Asn) in whom the follow-up period was only a few months, giving the impression of measurement error ( Table 2 ). However, it has been recently demonstrated that relatively short-term fluctuations in visual function may occur in Best disease or in ARB, in association with subretinal fluid accumulation.
A clinical analysis of retinal function and structure at recent follow-up revealed variable degrees of central dysfunction and structural alterations ranging from abnormalities of photoreceptor outer segments, the extent of which corresponded to subretinal fluid accumulation, and inferior accumulation of subretinal hyperautofluorescent alterations ( Supplemental Figures 2 and 3 , available at AJO.com ), to choroidal neovascularization with cystoid macular edema. The latter was found in the right eye of a 10-year-old patient, family VMD200035, heterozygous for BEST1 p.Asp302Asn. The choroidal neovascularization was treated with a single intravitreal injection of 0.5 mg ranibizumab and photodynamic therapy with verteporfin, leading to resolution of macular edema and improvement of vision ( Table 2 ). The mother of the patient (Patient 78502, Table 2 ) carried the same mutation in BEST1 and was asymptomatic with normal visual acuity and normal amplitudes of the mfERG despite multifocal vitelliform changes in the retina.
In the other families that have been described previously, the phenotypes were compatible with earlier descriptions of the phenotype. None of the patients had angle-closure glaucoma, which may be associated with Best disease or ARB. The youngest individual presenting with subtle retinal structural alterations attributable to Best disease was 4 years of age, described by us previously.
Fundus autofluorescence demonstrated hyperautofluorescence of accumulated material on the Bruch membrane and of the precipitate-like alterations at the level of the photoreceptor outer segments that were found to be associated with subretinal fluid ( Supplemental Figures 2 and 3 , available at AJO.com ). Autofluorescence in the left eye of the youngest patient, aged 10 years, was relatively homogeneous; however, SD-OCT demonstrated accumulation of subretinal material in an inferior location, which corresponded to localized inferior hyperautofluorescence. In all other patients, autofluorescence was granular with predominantly inferior accumulation of hyperautofluorescence, corresponding to hyperreflective subretinal accumulation at the level of the photoreceptor outer segments and on the Bruch membrane, as imaged by SD-OCT, similar to that presented in Supplemental Figures 2 and 3 (available at AJO.com ).
There was a significant negative correlation between the extent of photoreceptor abnormalities (that coincided with the extent of subretinal fluid) and retinal function ( P = .007, Spearman rho correlation coefficient = −0.533, 2-tailed Spearman rank correlation, Figure 4 ) . To correct for a possible bias attributable to correlation between the lesion diagonal diameters for a given lesion, we averaged these as a single estimate of lesion size for a given lesion (presented explicitly in Table 2 ) and tested for correlation with an average of the 2 mfERG measures for a given lesion, described above. This resulted in correlation P = .013, rho = −0.692. The same measurements were repeated with SD-OCT-guided measurements of lesion size obtained by caliper measurement by a second observer, with similar significant results ( P < .05 for both measures). Finally, to correct for a possible bias attributable to correlation between paired eyes, we analyzed only right eyes of patients, with similar findings for both observers ( P = .026 and P = .05, respectively for the 2 observers).