Purpose
To determine the 4-year incidence of visual impairment (VI) and blindness and worsening of visual acuity in adult Latinos and Hispanics aged 40 years and older.
Design
Population-based, longitudinal study.
Methods
Participants underwent a detailed ophthalmologic examination including assessing both presenting binocular visual acuity (PVA) and best-corrected distance visual acuity (BCVA) in both eyes using a standard Early Treatment Diabetic Retinopathy protocol. The main outcome measures are 4-year incidence of visual impairment and blindness based on PVA or BCVA in the better-seeing eye and defined as (1) baseline visual acuity (PVA or BCVA) of 20/40 or better and a follow-up PVA or BCVA of less than 20/40 but better than 20/200, and (2) baseline PVA better than 20/200 and a follow-up PVA of 20/200 or less, respectively. Monocular worsening was defined as a decrease of 5 or more, 10, and 15 letters in either eye.
Results
Four thousand six hundred fifty-eight participants were examined at baseline and the 4-year follow-up. The 4-year incidence of presenting binocular VI and blindness was 2.9% and 0.3%. The 4-year incidence of best-corrected VI and blindness was 1.2% and 0.3%. The 4-year incidence of monocular worsening by 5 or more, 10, and 15 letters was 24.8%, 8.5%, and 3.1%, respectively. The incidence of VI and blindness increased with age at baseline ( P < .01). The incidence of VI in the second eye (12.2%) was significantly higher than the incidence of VI in the first eye (2.9%; P < .001).
Conclusions
Overall, the annual incidence of VI in Latinos and Hispanics was higher than that reported in non-Hispanic white persons and the highest reported in a population-based study in the United States. Screening and intervention programs to reduce visual impairment and blindness should focus on the older Latino population.
Latinos and Hispanics, the largest minority and the fastest growing segment of the United States population, are a racial and ethnic population with unique demographic, socioeconomic, mortality, morbidity, and ocular disease characteristics. According to the 2000 United States Census, 12.5% of residents, or 35 million people, are Latino or Hispanic. This number is expected nearly to double to 61.4 million by the year 2025. Given this growth in the Latino population, the burdens of eye disease in Latinos are increasingly becoming a public health concern.
There are few population-based epidemiologic studies focusing on visual impairment rates in Latinos. Previous studies have estimated prevalence and incidence rates of visual impairment on persons of European ancestry and African ancestry. However, most published studies of visual impairment have focused on obtaining prevalence estimates, and only a select few have gathered follow-up data from their original cohort to obtain incidence estimates of visual impairment. No previous study has examined the incidence of visual impairment and eye disease in a Latino or Hispanic population. Both the Proyecto Ver study and the Los Angeles Latino Eye Study (LALES) have provided prevalence estimates of visual impairment in population-based samples of adult Latinos. In the LALES, it was noted that the age-specific prevalence of visual impairment in the better-seeing eye in Latinos was higher than that noted in studies of persons of European ancestry. The age-specific prevalence also showed a significant trend, with older persons having higher rates of visual impairment. However, although suggestive, these data did not provide clear evidence that older Latinos were more likely to become visually impaired and blind compared with younger Latinos. This emphasized the importance of obtaining incidence rates in an aging Latino cohort.
Furthermore, most incidence studies provide estimates of visual impairment in one eye, typically the worse eye. However, as we have shown previously, persons with bilateral visual impairment have worse health-related quality of life than those with unilateral visual impairment. Thus, to gain an accurate assessment of the burden of visual impairment particularly from a quality-of-life perspective, it is important to obtain incidence rates of unilateral and bilateral visual impairment particularly in persons with existing unilateral visual impairment. No previous epidemiologic study has reported these results.
Finally, although the prevalence of both visual impairment and blindness (severe visual impairment) in Latinos is higher than in non-Hispanic whites in both the Beaver Dam Eye Study (BDES) and Blue Mountains Eye Study (BMES) and is similar to that of Afro-Carribeans in Barbados, no comparison data are available on the incidence rates of visual impairment and blindness. The LALES provides the first opportunity to compare the incidence of visual impairment in Latinos and persons of African and European ancestry.
Methods
Population
Details of the baseline LALES study design have been reported elsewhere. In summary, the data collection for the baseline population-based prevalence study was conducted from 2000 to 2003. Of the 7789 eligible residents (aged 40 years and older and self-identified Latinos) in 6 census tracts in La Puente, California, who were invited to participate, 6357 (82%) completed an in-home questionnaire and a clinical examination. All living eligible individuals from the baseline LALES were invited to participate in the 4-year follow-up incidence study. Data collection for the incidence study began in 2004 and was completed in 2008.
Incidence Study Procedures
An in-home interview was conducted (including sociodemographic, medical, and ocular history and use of health care). Details of the interview are available elsewhere. Participants were scheduled for a detailed eye examination conducted at the LALES local eye examination center. The visit included a visual field evaluation and a slit-lamp and dilated fundus examination performed by an ophthalmologist. Visual acuity (VA) was determined for each eye with the presenting correction, if any, using the revised Early Treatment Diabetic Retinopathy charts 1, 2, and 3; Lea symbol charts were used for illiterate participants. Visual acuity was measured at 1 m for those who read fewer than 20 letters at 4 m. Automated refraction with a Humphrey Automatic Refractor (model 599; Carl Zeiss Meditec, Dublin, California, USA) was performed if the participant could not read 55 letters or more at 4 m in either eye; this was followed by a subjective refraction using standard protocols. These protocols were identical to the ones in the baseline assessment. As in the baseline study, individuals who did not complete a clinical examination at the examination center were asked to undergo an in-home examination by an ophthalmologist and a trained technician using the Early Treatment Diabetic Retinopathy protocol. Visual acuity was scored as the total number of letters read correctly and was converted to a logarithm of the minimal angle of resolution score. The 4-year incidence of visual impairment and blindness was calculated, and estimates were made of percentages of individuals with worsening improvement of vision from baseline to follow-up.
Multiple quality control measures were implemented throughout the study. These measures included validation of at least 5% of each interviewer’s work, validation of 10% of in-clinic questionnaires, and repeat measurement of several variables during the clinical examination by more than 1 technician. In addition, data checks were incorporated into the data management program, and the supervising technician reviewed participant information in the database for completeness and accuracy.
Definitions
There are no universally accepted criteria for visual impairment, blindness (severe visual impairment), or changes in visual impairment. The criteria that we used in this study are summarized in Figure 1 .
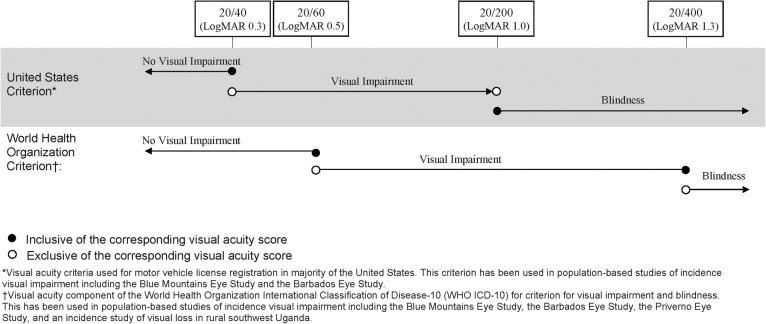
For most of the analysis, we used United States (US) and World Health Organization (WHO) criteria for visual impairment and blindness. Based on previous convention, the criteria for incidence of visual impairment and blindness using standard US and WHO criteria include in their baseline at-risk cohort only those persons with no visual impairment or blindness in their better-seeing eye (no bilateral visual impairment at baseline). Modifications to the US and WHO criteria were made to redefine the at-risk cohort to include those who at baseline had no unilateral or bilateral visual impairment to provide data on the incidence of visual impairment and blindness in the first and second eye.
Presenting binocular visual impairment and blindness
A novel aspect of our incidence study was the assessment of binocular VA (with both eyes open), a better measure of functional vision than monocular visual acuity in the better-seeing eye. Using the US criteria, persons at risk for binocular visual impairment had a baseline presenting binocular VA (PVA) of 20/40 or better; visual impairment at follow-up was PVA worse than 20/40 but better than 20/200. Those at risk for binocular blindness had a baseline PVA better than 20/200; blindness at follow-up was PVA 20/200 or worse. Using the WHO criteria, persons at risk for binocular visual impairment had a baseline PVA of 20/60 or better; visual impairment at follow-up was PVA worse than 20/60 but no worse than 20/400. Those at risk for binocular blindness had a baseline PVA of 20/400 or better; blindness at follow-up was PVA worse than 20/400.
Visual impairment and blindness in the best-corrected better-seeing eye
The standard criterion for visual impairment and blindness in the US and the WHO criteria refers to the best-corrected visual acuity (BCVA) in the better-seeing eye. For United States incidence analyses, persons at risk for visual impairment had a baseline presenting BCVA of 20/40 or better in the better-seeing eye. Persons were identified as having incident visual impairment if at follow-up they had a BCVA worse than 20/40 but better than 20/200 in the better-seeing eye. Those at risk for blindness had a baseline BCVA of better than 20/200 in their better-seeing eye. Persons were identified as having incident blindness if at follow-up they had a BCVA of 20/200 or worse in their better-seeing eye. For WHO analyses, persons at risk for visual impairment had a baseline presenting BCVA of 20/60 or better in the better-seeing eye. Persons were identified as having incident visual impairment if at follow-up they had a BCVA worse than 20/60 but no worse than 20/400 in the better-seeing eye. Those at risk for blindness had a baseline BCVA of 20/400 or better in the better-seeing eye. Persons were identified as having incident blindness if at follow-up they had a BCVA of worse than 20/400.
Monocular visual impairment and blindness
Both US and WHO criteria were used. According to US criteria, those at risk for visual impairment in a specific eye had a baseline BCVA of 20/40 or better; visual impairment at follow-up was BCVA worse than 20/40 but better than 20/200 (not including 20/40 or 20/200) in the same eye. By these same criteria, persons at risk for blindness in a specific eye had baseline BCVA better than 20/200; blindness at follow-up was BCVA 20/200 or worse (including 20/200) in the same eye. Using WHO criteria, individuals at risk for visual impairment in a specific eye had a baseline BCVA 20/60 or better; visual impairment at follow-up was BCVA worse than 20/60 but 20/400 or better (not including 20/60 but including 20/400) in the same eye. WHO criteria defined those at risk for blindness in a specific eye as having a baseline BCVA 20/400 or better; blindness at follow-up was BCVA worse than 20/400 (not including 20/400) in the same eye.
Worsening and improvement in binocular presenting visual acuity
Persons at risk for binocular worsening had baseline PVA better than no light perception; worsening at follow-up was loss of 5 or more, 10, or 15 letters read correctly. Those capable of binocular improvement read 5 or more, 10, or 15 letters correctly at baseline; improvement at follow-up was an increase of 5 or more, 10, or 15 letters read correctly.
Worsening and improvement in monocular best-corrected visual acuity
Monocular worsening was defined as a decrease from baseline to follow-up of 5 or more, 10, and 15 letters read correctly evaluated in either eye (at risk, BCVA of light perception or better in both eyes at baseline) and in the better-seeing eye (at risk, BCVA of light perception of better in one or both eyes at baseline). Monocular improvement was gain from baseline to follow-up of 5 or more, 10, and 15 letters read correctly evaluated in either eye and in the worse-seeing eye (at risk, capable of improving from baseline by 5 or more, 10, and 15 letters read correctly in the eye of interest).
Statistical Methods
To examine the possible impact of nonparticipation at the 4-year follow-up examination, sociodemographic and clinical characteristics were compared between participants who completed the follow-up examination and nonparticipants using the chi-square test for categorical variables and the Student t test for continuous variables. Overall and age-standardized (to the LALES population) 4-year incidence rates of binocular or monocular visual impairment and blindness were calculated for each of the categories of visual impairment and blindness (described above) as the proportion of the number of new cases (participants or eyes) with visual impairment or blindness to the number of participants (or eyes) that had no visual impairment or blindness at the time of the baseline examination. Analyses were stratified by age at baseline examination and gender. Because there were no gender differences in any of the incidence rates, results of these analyses are not presented. The statistical significance of associations between incidence and age subgroups was assessed with the test of trend.
Overall and age-specific progression rates for binocular (per participant) and monocular (either eye, better-seeing eye, worse-seeing eye) worsening or improvement in vision was calculated for each criterion for change (5, 10, 15 letters, described above) as the ratio of the number of cases (participants or eyes) that worsened or improved to the number of participants with visual impairment at baseline examination. Locally weighted polynomial regression plots for the US and WHO criteria for visual impairment and blindness allowed an assessment of the relationship between age at baseline and the incidence of visual impairment and blindness.
To compare the incidence of visual impairment across population-based studies, the annual incidence of visual impairment, blindness, and change in visual impairment was estimated from the 4-year incidence in the LALES and the 5-year incidence in the BDES and the BMES using criteria from the BDES. In addition, the 4-year incidence rates of visual impairment and blindness were annualized to compare the results with those of the BISED using US and WHO criteria.
All analyses were conducted using SAS software version 9.1 (SAS Institute, Cary, North Carolina, USA). STATA software version 9.0 (STATA Corp LP, College Station, Texas, USA) was used to create locally weighted polynomial regression plots.
Results
Study Cohort
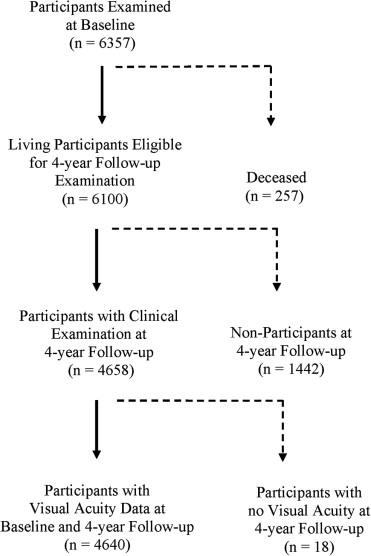
Of the 6357 participants examined at baseline, 6100 living participants were eligible for this follow-up study. Of the 6100 living eligibles, 4658 (76%) completed a clinical examination and 4640 (76%) had complete visual acuity data ( Figure 2 ). Participants were followed up for a mean of 4.2 ± 0.52 years. Sociodemographic and historical characteristics of participants who completed the interview and clinical examination at the 4-year follow-up (n = 4658) and nonparticipants (n = 1442) are summarized in Table 1 . Most participants were female (60%), younger than 60 years (69%), and were born outside the United States (77%). Specifically, the country of birth was identified as Mexico in 64%, the United States in 23%, El Salvador in 5%, Guatemala in 2.5%, Nicaragua in 1%, and other countries in 4.5% of participants. Only 19% reported their health to be excellent or very good, and 41% had at least 2 comorbidities. Participants and nonparticipants differed significantly with regard to gender, age, marital status, health insurance, history of hypertension, comorbidities, self-reported vision, in-home binocular near vision, history of ocular disease, and history of cataract ( P < .05).
| Participants (N = 4658) a | Nonparticipants (N = 1442) b | ||||
|---|---|---|---|---|---|
| Characteristics | n | % | n | % | P Value c |
| Gender (female) | 2801 | 60% | 802 | 56% | < .003 |
| Age group (yrs) | |||||
| Mean (± SD) | 54.7 | 10.5 | 53.1 | 10.7 | < .001 |
| 40 to 49 | 1763 | 38% | 660 | 46% | < .001 |
| 50 to 59 | 1462 | 31% | 427 | 30% | |
| 60 to 69 | 938 | 20% | 220 | 15% | |
| 70 to 79 | 409 | 9% | 107 | 7% | |
| 80+ | 86 | 2% | 28 | 2% | |
| Country of birth (United States) | 1094 | 24% | 315 | 22% | .20 |
| Acculturation (low |< 1.9|) | 1537 | 33% | 447 | 31% | .17 |
| Working status (employed) | 2323 | 50% | 746 | 52% | .19 |
| Education level ≥ 12 yrs | 1576 | 34% | 467 | 32% | .33 |
| Marital status (married) | 3279 | 71% | 959 | 67% | .01 |
| Income level > $40 000 | 582 | 13% | 183 | 13% | .83 |
| Health insurance | 3119 | 67% | 773 | 54% | < .001 |
| ≥ 2 comorbidities d | 1903 | 41% | 492 | 34% | < .001 |
| Self-reported health excellent/very good | 884 | 19% | 288 | 20% | .38 |
| History of hypertension | 1392 | 30% | 368 | 26% | .002 |
| History of diabetes | 868 | 19% | 235 | 16% | .05 |
| Self-reported vision excellent/good | 1940 | 42% | 594 | 38% | .02 |
| In-home binocular near vision better than 20/40 | 214 | 5% | 89 | 6% | .02 |
| History of any ocular disease | 616 | 13% | 152 | 11% | .01 |
| History of cataract | 472 | 10% | 109 | 8% | .004 |
| History of glaucoma | 118 | 3% | 41 | 3% | .51 |
| History of macular degeneration | 33 | 1% | 10 | 1% | .96 |
| History of diabetic retinopathy | 99 | 2% | 21 | 2% | .11 |
a Participants completing the clinical examination at follow-up.
b Nonparticipants of the follow-up examination who had participated in the baseline examination (including persons who declined the follow-up examination).
c Chi-square test for categorical variables; t test for continuous variables.
d Comorbidities refer to the summation of the following medical conditions: arthritis, diabetes, back pain, hypertension, deafness, asthma, angina, skin cancer, other cancers, heart disease, stroke, and heart failure.
Incidence of Binocular Visual Impairment and Blindness
The 4-year incidence of presenting binocular visual impairment (US criteria) in the overall cohort at risk was 2.9% (95% confidence interval [CI], 2.4% to 3.4%; Table 2 ). The 4-year incidence of presenting binocular blindness (US criteria) was 0.3% (95% CI, 0.2% to 0.5%). The incidence of both conditions increased significantly ( P < .001) with the age of the participant at the time of the baseline examination. For example, over the 4-year period, the incidence of presenting binocular visual impairment (US criteria) in those age 80 years and older (19.4%) was 13-fold higher than those aged 40 to 49 years at baseline (1.4%). Similarly, the incidence of presenting binocular blindness (US criteria) in those 80 years of age and older (3.8%) was 7-fold higher than those 50 to 59 years of age at baseline (0.5%).
| Incidence of Visual Impairment | Incidence of Blindness | |||||
|---|---|---|---|---|---|---|
| N | n | % (95% CI) | N | n | % (95% CI) | |
| United States criteria a | ||||||
| Age at baseline (yrs) | ||||||
| 40 to 49 | 1739 | 25 | 1.4 (0.9 to 2.0) | 1753 | 0 | NA |
| 50 to 59 | 1422 | 27 | 1.9 (1.2 to 2.6) | 1453 | 7 | 0.5 (0.1 to 0.8) |
| 60 to 69 | 888 | 31 | 3.5 (2.3 to 4.7) | 934 | 5 | 0.5 (0.1 to 1.0) |
| 70 to 79 | 371 | 34 | 9.2 (6.2 to 12.1) | 398 | 1 | 0.3 (0.0 to 0.7) |
| 80+ | 62 | 12 | 19.4 (9.5 to 29.2) | 78 | 3 | 3.8 (0.0 to 8.1) |
| P < .001 | P < .001 | |||||
| Crude overall | 4482 | 129 | 2.9 (2.4 to 3.4) | 4616 | 16 | 0.3 (0.2 to 0.5) |
| Age standardized b | 3.0 (2.5 to 3.5) | 0.4 (0.2 to 0.6) | ||||
| World Health Organization criteria c | ||||||
| Age at baseline (yrs) | ||||||
| 40 to 49 | 1747 | 14 | 0.8 (0.4 to 1.2) | 1754 | 0 | NA |
| 50 to 59 | 1438 | 17 | 1.2 (0.6 to 1.7) | 1453 | 5 | 0.3 (0.0 to 0.6) |
| 60 to 69 | 912 | 24 | 2.6 (1.6 to 3.7) | 937 | 0 | NA |
| 70 to 79 | 386 | 19 | 4.9 (2.8 to 7.1) | 402 | 2 | 0.5 (0.0 to 1.2) |
| 80+ | 71 | 10 | 14.1 (6.0 to 22.2) | 81 | 3 | 3.7 (0.0 to 7.8) |
| P < .001 | P < .001 | |||||
| Crude overall | 4554 | 84 | 1.8 (1.5 to 2.2) | 4627 | 10 | 0.2 (0.1 to 0.3) |
| Age standardized b | 1.9 (1.5 to 2.3) | 0.2 (0.1 to 0.3) | ||||
a United States criteria. Incidence of visual impairment: persons with baseline PVA of 20/40 or better and follow-up PVA worse than 20/40 but better than 20/200 (not including 20/40 or 20/200). Incidence of blindness: persons with baseline PVA better than 20/200 and follow-up PVA 20/200 or worse (including 20/200).
b Age standardized to the Los Angles Latino Eye Study population.
c World Health Organization criteria. Incidence of visual impairment: persons with baseline PVA 20/60 or better and follow-up PVA worse than 20/60 but 20/400 or better (not including 20/60 but including 20/400). Incidence of blindness: persons with baseline PVA 20/400 or better and follow-up PVA worse than 20/400 (not including 20/400).
Incidence of Visual Impairment and Blindness in the Best-Corrected Better-Seeing Eye
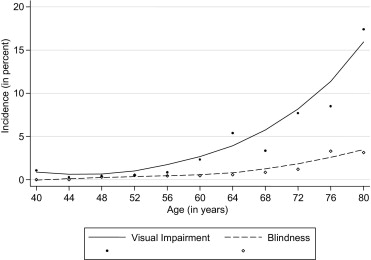
The 4-year incidence of visual impairment using the US and WHO criteria were 1.2% and 0.7%, respectively ( Table 3 ). The 4-year incidence of blindness using the US and WHO criteria were 0.3% and 0.2%, respectively. The incidence of both conditions increased significantly ( P < .001) with age at baseline. For example, over the 4-year period, the incidence of visual impairment in the best-corrected better-seeing eye (US criteria) in those 80 years of age and older (14.1%) was 28-fold higher than those 40 to 49 years of age at baseline (0.5%). Similarly, the incidence of blindness in the best-corrected better-seeing eye (US criteria) in those 80 years of age and older (2.5%) was 6-fold higher than in those 50 to 59 years of age at baseline (0.3%). Locally weighted polynomial regression plots of the combined 4-year incidence of visual impairment and blindness using United States criteria ( Figure 3 ) demonstrated strong associations with older age. Incidence of visual impairment and blindness both showed gradual increase across all age-groups.
| Incidence of Visual Impairment | Incidence of Blindness | |||||
|---|---|---|---|---|---|---|
| N | n | % (95% CI) | N | n | % (95% CI) | |
| United States criteria a | ||||||
| Age at baseline (yrs) | ||||||
| 40 to 49 | 1751 | 8 | 0.5 (0.1 to 0.8) | 1754 | 0 | NA |
| 50 to 59 | 1444 | 6 | 0.4 (0.1 to 0.7) | 1446 | 5 | 0.3 (0.0 to 0.6) |
| 60 to 69 | 913 | 15 | 1.6 (0.8 to 2.5) | 931 | 3 | 0.3 (0.0 to 0.7) |
| 70 to 79 | 383 | 16 | 4.2 (2.2 to 6.2) | 397 | 2 | 0.5 (0.0 to 1.2) |
| 80+ | 71 | 10 | 14.1 (6.0 to 22.2) | 79 | 2 | 2.5 (0.0 to 6.0) |
| P < .001 | P < .001 | |||||
| Crude overall | 4562 | 55 | 1.2 (0.9 to 1.5) | 4607 | 12 | 0.3 (0.1 to 0.4) |
| Age standardized b | 1.3 (1.0 to 1.6) | 0.3 (0.1 to 0.5) | ||||
| World Health Organization criteria c | ||||||
| Age at baseline (yrs) | ||||||
| 40 to 49 | 1751 | 2 | 0.1 (0.0 to 0.3) | 1755 | 0 | NA |
| 50 to 59 | 1444 | 4 | 0.3 (0.0 to 0.5) | 1446 | 4 | 0.3 (0.0 to 0.5) |
| 60 to 69 | 922 | 12 | 1.3 (0.6 to 2.0) | 932 | 0 | NA |
| 70 to 79 | 394 | 9 | 2.3 (0.8 to 3.8) | 400 | 1 | 0.3 (0.0 to 0.7) |
| 80+ | 74 | 7 | 9.5 (2.8 to 16.1) | 81 | 2 | 2.5 (0.0 to 5.8) |
| P < .001 | P = .005 | |||||
| Crude overall | 4585 | 34 | 0.7 (0.5 to 1.0) | 4614 | 7 | 0.2 (0.0 to 0.3) |
| Age standardized b | 0.8 (0.5 to 1.1) | 0.2 (0.1 to 0.3) | ||||
a United States criteria. Incidence of visual impairment: persons with baseline BCVA of 20/40 or better in better-seeing eye, and follow-up BCVA worse than 20/40 but better than 20/200 (not including 20/40 or 20/200) in better-seeing eye. Incidence of blindness: persons with baseline BCVA better than 20/200 in the better-seeing eye and follow-up BCVA 20/200 or worse (including 20/200).
b Age standardized to the Los Angles Latino Eye Study population.
c World Health Organization criteria. Incidence of visual impairment: persons with baseline BCVA 20/60 or better in the better-seeing eye and follow-up BCVA worse than 20/60 but 20/400 or better (not including 20/60 but including 20/400) in the better-seeing eye. Incidence of blindness: persons with baseline BCVA 20/400 or better in better-seeing eye and follow-up BCVA worse 20/400 (not including 20/400) in the better-seeing eye.
Incidence of Monocular Visual Impairment and Blindness—First Eye, Second Eye, and Either Eye
The 4-year incidence of monocular visual impairment and blindness using modified US and WHO criteria is presented in Tables 4 and 5 , respectively. More than 95% of participants were bilaterally unimpaired at baseline (had no visual impairment or blindness in either eye). In general, as expected based on the criteria, the incidence of monocular visual impairment and blindness was lower using the modified WHO criteria compared with the US criteria. As with binocular visual impairment, the incidence of monocular impairment increased significantly with age. For example, using modified US criteria, the incidence of monocular visual impairment in those bilaterally unimpaired at baseline (developing visual impairment in the first eye) was 20-fold higher in persons 80 years of age and older (14.6%) compared with those 40 to 49 years of age (0.7%) at baseline. Similarly, using modified US criteria, the incidence of monocular blindness in those not blind in either eye at baseline (becoming blind in the first eye) was 28-fold higher in persons 80 years of age and older (5.6%) compared with those 40 to 49 years of age (0.2%) at baseline.
| Incidence in First Eye | Incidence in Second Eye | Incidence in Either Eye a | |||||||
|---|---|---|---|---|---|---|---|---|---|
| N | n | % (95% CI) | N | n | % (95% CI) | N | n | % (95% CI) | |
| United States criteria b | |||||||||
| Age at baseline (yrs) | |||||||||
| 40 to 49 | 1704 | 12 | 0.7 (0.3 to 1.1) | 44 | 2 | 4.5 (0.0 to 10.7) | 1748 | 14 | 0.8 (0.4 to 1.2) |
| 50 to 59 | 1393 | 18 | 1.3 (0.7 to 1.9) | 50 | 1 | 2.0 (0.0 to 5.9) | 1443 | 19 | 1.3 (0.7 to 1.9) |
| 60 to 69 | 845 | 45 | 5.3 (3.8 to 6.8) | 64 | 7 | 10.9 (3.3 to 18.6) | 909 | 52 | 5.7 (4.2 to 7.2) |
| 70 to 79 | 329 | 44 | 13.4 (9.7 to 17.1) | 44 | 10 | 22.7 (10.3 to 35.1) | 373 | 54 | 14.5 (10.9 to 18.0) |
| 80+ | 48 | 7 | 14.6 (4.6 to 24.6) | 19 | 7 | 36.8 (15.2 to 58.5) | 67 | 14 | 20.9 (11.2 to 30.6) |
| P < .001 | P < .001 | P < .001 | |||||||
| Crude overall | 4319 | 126 | 2.9 (2.4 to 3.4) | 221 | 27 | 12.2 (7.9 to 16.5) | 4540 | 153 | 3.4 (2.8 to 3.9) |
| Age standardized c | 3.2 (2.6 to 3.8) | 7.3 (4.5 to 10.1) | 3.6 (3.0 to 4.1) | ||||||
| World Health Organization criteria d | |||||||||
| Age at baseline (yrs) | |||||||||
| 40 to 49 | 1719 | 10 | 0.6 (0.2 to 0.9) | 30 | 0 | NA | 1749 | 10 | 0.6 (0.2 to 0.9) |
| 50 to 59 | 1409 | 13 | 0.9 (0.4 to 1.4) | 35 | 1 | 2.9 (0.0 to 8.4) | 1444 | 14 | 1.0 (0.5 to 1.5) |
| 60 to 69 | 862 | 24 | 2.8 (1.7 to 3.9) | 56 | 6 | 10.7 (2.6 to 18.8) | 918 | 30 | 3.3 (2.1 to 4.4) |
| 70 to 79 | 355 | 38 | 10.7 (7.5 to 13.9) | 33 | 4 | 12.1 (1.0 to 23.3) | 388 | 42 | 10.8 (7.7 to 13.9) |
| 80+ | 60 | 8 | 13.3 (4.7 to 21.9) | 12 | 6 | 20.0 (21.7 to 78.3) | 72 | 14 | 19.4 (10.3 to 28.6) |
| P < .001 | P < .001 | P < .001 | |||||||
| Crude overall | 4405 | 93 | 2.1 (1.7 to 2.5) | 166 | 17 | 10.2 (2.6 to 14.9) | 4571 | 110 | 2.4 (2.0 to 2.9) |
| Age standardized c | 2.3 (1.8 to 2.8) | 5.1 (2.7 to 7.5) | 2.5 (2.0 to 3.0) | ||||||
a This column combines the at-risk cohorts for incidence in the first eye and incidence in the second eye.
b United States criteria. Incidence of visual impairment: persons with baseline best-corrected visual acuity (BCVA) 20/40 or better in the first or second eye and follow-up BCVA worse than 20/40 but better than 20/200 (not including 20/40 or 20/200) in the first or second eye.
c Age standardized to the Los Angles Latino Eye Study population.
d World Health Organization criteria. Incidence of visual impairment: persons with baseline BCVA 20/60 or better in the first or second eye and follow-up BCVA worse than 20/60 but 20/400 or better (not including 20/60 but including 20/400) in the first or second eye.
| Incidence in First Eye | Incidence in Second Eye | Incidence in Either Eye a | |||||||
|---|---|---|---|---|---|---|---|---|---|
| N | n | % (95% CI) | N | n | % (95% CI) | N | n | % (95% CI) | |
| United States criteria b | |||||||||
| Age at baseline (yrs) | |||||||||
| 40 to 49 | 1733 | 4 | 0.2 (0.0 to 0.5) | 22 | 0 | NA | 1755 | 4 | 0.2 (0.0 to 0.5) |
| 50 to 59 | 1431 | 10 | 0.7 (0.3 to 1.1) | 22 | 4 | 18.7 (2.1 to 34.3) | 1453 | 14 | 1.0 (0.5 to 1.5) |
| 60 to 69 | 911 | 21 | 2.3 (1.3 to 3.3) | 24 | 0 | NA | 935 | 21 | 2.2 (1.3 to 3.2) |
| 70 to 79 | 383 | 15 | 3.9 (2.0 to 5.9) | 16 | 2 | 12.5 (0.0 to 28.7) | 399 | 17 | 4.3 (2.3 to 6.2) |
| 80+ | 71 | 4 | 5.6 (0.3 to 11.0) | 8 | 1 | 12.5 (0.0 to 35.4) | 79 | 5 | 6.3 (1.0 to 11.7) |
| P < .001 | P = .418 | P < .001 | |||||||
| Crude overall | 4529 | 54 | 1.2 (0.9 to 1.5) | 92 | 7 | 7.6 (2.2 to 13.0) | 4621 | 61 | 1.3 (1.0 to 1.6) |
| Age standardized c | 1.2 (0.9 to 1.5) | 7.0 (1.8 to 12.2) | 1.3 (1.0 to 1.7) | ||||||
| World Health Organization criteria d | |||||||||
| Age at baseline (yrs) | |||||||||
| 40 to 49 | 1745 | 8 | 0.5 (0.1 to 0.8) | 11 | 0 | NA | 1756 | 8 | 0.5 (0.1 to 0.8) |
| 50 to 59 | 1437 | 6 | 0.4 (0.1 to 0.8) | 16 | 3 | 18.8 (0.0 to 37.9) | 1453 | 9 | 0.6 (0.2 to 1.0) |
| 60 to 69 | 919 | 14 | 1.5 (0.7 to 2.3) | 17 | 0 | NA | 936 | 14 | 1.5 (0.7 to 2.3) |
| 70 to 79 | 391 | 9 | 2.3 (0.8 to 3.8) | 11 | 1 | 9.1 (0.0 to 26.1) | 402 | 10 | 2.5 (1.0 to 4.0) |
| 80+ | 76 | 5 | 6.6 (1.0 to 12.2) | 5 | 1 | 20.0 (0.0 to 55.1) | 81 | 6 | 7.4 (1.7 to 13.1) |
| P < .001 | P = .581 | P < .001 | |||||||
| Crude overall | 4568 | 42 | 0.9 (0.6 to 1.2) | 60 | 5 | 8.3 (1.3 to 15.3) | 4628 | 47 | 1.0 (0.7 to 1.3) |
| Age standardized c | 0.9 (0.6 to 1.2) | 7.0 (0.9 to 13.1) | 1.0 (0.7 to 1.3) | ||||||
a This column combines the at-risk cohorts for incidence in the first eye and incidence in the second eye.
b United States criteria. Incidence of monocular blindness (first or second eye): persons with baseline BCVA better than 20/200 in the first or second eye and follow-up BCVA 20/200 or worse (including 20/200) in the first or second eye.
c Age standardized to the Los Angles Latino Eye Study population.
d World Health Organization criteria. Incidence of monocular blindness (first or second eye): Persons with baseline BCVA 20/400 or better in the first or second eye and follow-up BCVA worse than 20/400 (not including 20/400) in the first or second eye.
The 4-year risk of developing visual impairment or blindness in the second eye was higher than the risk of developing visual impairment or blindness in the first eye ( Tables 4 and 5 ). Thus, persons who have pre-existing visual impairment or blindness in one eye are more likely to develop visual impairment or blindness in the second eye compared with those who have no visual impairment in either eye ( Tables 4 and 5 ). For example, using modified US criteria and age standardization, the incidence of monocular visual impairment in those visually impaired in 1 eye at baseline (developing visual impairment in the second eye) was twice as high (7.3%) compared with those who had no visual impairment either eye at baseline (3.2%). Similar to the rates seen for incidence in the first eye, there also seems to be an age-related trend for developing visual impairment in the second eye. The age-specific rates for visual impairment (based on best-corrected visual acuity using US criteria) in the second eye were 8-fold higher in persons 80 years and older (36.8%) compared with those 40 to 49 years of age (4.5%) at baseline. No age-related trend was present for the incidence of blindness in the second eye, probably because of a limited number of persons who became blind. The overall incidence for blindness in the second eye is 7.6% and 8.3% for the modified US and WHO criteria, respectively.
Table 4 and 5 also show the combined incidence rates from the first eye and the second eye incidence in either eye. Using the modified US criteria, visual impairment developed in 3.4% of persons in either eye and 1.3% became monocularly blind in either eye. Similar to the increases in the incidence of visual impairment in the first and second eyes in older persons compared with younger persons, older Latinos had higher incidences of visual impairment and blindness in either eye.
Worsening and Improvement in Binocular Presenting Visual Acuity
Over 4 years, loss of 5 or more, 10, and 15 letters of binocular presenting visual acuity occurred in 24.8%, 8.5%, and 3.1% of participants at risk, respectively ( Table 6 ). Persons who were older at the baseline examination were more likely to have a worsening in their presenting binocular visual acuity compared with those who were younger ( P < .001). Improvements of 5 or more, 10, and 15 letters of binocular presenting visual acuity occurred in 12.7%, 4.6%, and 3.9% of individuals at risk, respectively. Persons who were older at the baseline examination also were more likely to have an improvement (of 5 or more and 10 letters but not 15 letters) in their presenting binocular visual acuity compared with those who were younger ( P < .03).
| Binocular Worsening a | Binocular Improvement b | |||||||
|---|---|---|---|---|---|---|---|---|
| N | n | % (95% CI) | P Value | N | n | % (95% CI) | P Value | |
| ≥ 15 letters change | ||||||||
| Age at baseline (yrs) | ||||||||
| 40 to 49 | 1756 | 35 | 2.0 (1.3 to 2.6) | < .001 | 315 | 14 | 4.4 (2.2 to 6.7) | .379 |
| 50 to 59 | 1451 | 40 | 2.8 (1.9 to 3.6) | 419 | 19 | 4.5 (2.5 to 6.5) | ||
| 60 to 69 | 938 | 34 | 3.6 (2.4 to 4.8) | 438 | 14 | 3.2 (1.5 to 4.8) | ||
| 70 to 79 | 403 | 28 | 6.9 (4.5 to 9.4) | 282 | 9 | 3.2 (1.1 to 5.2) | ||
| 80+ | 82 | 8 | 9.8 (3.3 to 16.2) | 68 | 3 | 4.4 (0.0 to 9.3) | ||
| Total | 4630 | 145 | 3.1 (2.6 to 3.6) | 1522 | 59 | 3.9 (2.9 to 4.8) | ||
| ≥ 10 letters change | ||||||||
| Age at baseline (yrs) | ||||||||
| 40 to 49 | 1756 | 105 | 6.0 (4.9 to 7.1) | < .001 | 1251 | 44 | 3.5 (2.5 to 4.5) | .021 |
| 50 to 59 | 1451 | 106 | 7.3 (6.0 to 8.6) | 1247 | 59 | 4.7 (3.6 to 5.9) | ||
| 60 to 69 | 938 | 99 | 10.6 (8.6 to 12.5) | 872 | 46 | 5.3 (3.8 to 6.8) | ||
| 70 to 79 | 403 | 67 | 16.6 (13.0 to 20.3) | 395 | 21 | 5.3 (3.1 to 7.5) | ||
| 80+ | 82 | 18 | 22.0 (13.0 to 30.9) | 83 | 6 | 7.2 (1.7 to 12.8) | ||
| Total | 4630 | 395 | 8.5 (7.7 to 9.3) | 3848 | 176 | 4.6 (3.9 to 5.2) | ||
| ≥ 5 letters change | ||||||||
| Age at baseline (yrs) | ||||||||
| 40 to 49 | 1756 | 388 | 22.1 (20.2 to 24.0) | < .001 | 1636 | 166 | 10.1 (8.7 to 11.6) | < .001 |
| 50 to 59 | 1451 | 344 | 23.7 (21.5 to 25.9) | 1429 | 185 | 12.9 (11.2 to 14.7) | ||
| 60 to 69 | 938 | 252 | 26.9 (24.0 to 29.7) | 935 | 141 | 15.1 (12.8 to 17.4) | ||
| 70 to 79 | 403 | 135 | 33.5 (28.9 to 38.1) | 405 | 64 | 15.8 (12.2 to 19.4) | ||
| 80+ | 82 | 31 | 37.8 (27.3 to 48.3) | 83 | 13 | 15.7 (7.8 to 23.5) | ||
| Total | 4630 | 1150 | 24.8 (23.6 to 26.1) | 4488 | 569 | 12.7 (11.7 to 13.7) | ||
Stay updated, free articles. Join our Telegram channel

Full access? Get Clinical Tree


