Purpose
To estimate the 4-year incidence and progression of lens opacities.
Design
Population-based longitudinal study.
Methods
A total of 4658 adult Latinos from Los Angeles County were examined at baseline and 4-year follow-up. Examination included assessment of lens opacities using the Lens Opacities Classification System II (LOCS II). Incidences of cortical, nuclear, and posterior subcapsular opacities (with LOCS II scores ≥2) were defined as opacity development in persons without that opacity at baseline. Single and mixed opacities were defined in persons without any opacity at baseline. Incidence of all lens changes included development of at least 1 opacity or cataract surgery among those without any opacity at baseline. Four-year progressions were defined as increase of ≥2 in LOCS II score.
Results
The 4-year incidence of all lens opacities was 14.2%. Four-year incidence of cataract surgery was 1.48%. The incidences were 4.1% for cortical-only, 5.8% for nuclear-only, 0.5% for PSC-only, and 2.5% for mixed. The incidences for any opacities were 7.5% for cortical, 10.2% for nuclear, and 2.5% for PSC. Incidence increased with age ( P < .0001 for all). The progressions were 8.5% for cortical, 3.7% for nuclear, and 2.9% for PSC opacities.
Conclusions
Our Latino population had a higher incidence of nuclear than cortical opacities, but a greater progression of cortical than nuclear opacities. Incidence and progression of PSC was low. Additional understanding of the natural history and progression of various lens opacities will give us a better understanding of the pathogenesis and management of lens opacities.
Cataract is one of the main causes of blindness in the world and is a leading cause of visual impairment in the United States. Lens opacification is an age-related eye disease, and it is estimated that cataract accounts for approximately half of low-vision cases in adults over age 40. This visual impairment costs Medicare approximately 3 billion dollars per year. Understanding the annual burden of cataract in various populations is important to estimate health service needs in the future and to inform interventions that improve delivery of cataract care.
Some population-based epidemiologic data on the incidence and progression of lens opacities has recently become available for various ethnic groups worldwide. For example, the Melbourne Visual Impairment Project reported population-based data in persons of european ancestry in Melbourne, Australia; the Beaver Dam Eye Study studied a Wisconsin population, consisting primarily of persons of northern European descent; and the Barbados Eye Study evaluated a Caribbean population of primarily African descent. Our study aims to provide similar longitudinal data for Latinos, the largest and fastest-growing minority group in the United States. The U.S. Census Bureau reported that 35.6 million people or 12.5% of the nation’s residents were Latino in 2004, but this proportion is expected to increase to 20.1% by the year 2030. Additionally, Latinos are nearly 10 years younger than the rest of the U.S. population, so the burden of age-related cataract among Latinos is likely to rise in the future as the Latino population ages. Thus, longitudinal data on the development and progression of lens opacities in U.S. Latinos may inform the planning of future health services for the aging U.S. population.
The Los Angeles Latino Eye Study (LALES) is a population-based study examining ocular disease in Latinos, primarily Mexican-American, ages 40 years and older living in La Puente, California. Baseline findings have shown cataract to be the leading cause of low vision. The baseline prevalence of cortical, nuclear, and posterior subcapsular lens opacities in the LALES population has been previously reported, with cortical opacities being the most prevalent. The objective of this report is to describe the 4-year incidence and progression of lens opacity in our population-based cohort of Los Angeles Latinos.
Methods
Study Population
Self-identified Latinos 40 years of age and older living in 6 census tracts in the city of La Puente, Los Angeles County, California, were included in this study. A majority of the participants were Mexican American. The Los Angeles County, University of Southern California Medical Center Institutional Review Board Ethics Committee approved this study, and all study procedures adhered to the recommendations of the Declaration of Helsinki. Written, informed consent was obtained from all participants. Study design, sampling plan, and baseline data have been previously reported. Baseline examinations were performed between 2000 and 2003, and 4-year follow-up examination were performed between 2004 and 2008. At baseline, 6357 of 7789 eligible participants (82%) completed an in-home questionnaire and a clinical ophthalmic examination.
Interview and Examination Procedures
All eligible participants who completed the baseline LALES examination were invited to participate in a second home interview and a clinical examination. Similar questionnaire and examination procedures were used for both baseline and follow-up studies. Trained ophthalmologists and technicians performed a comprehensive ocular examination using standardized protocols.
Presenting visual acuity (PVA) and best-corrected visual acuity (BCVA) were documented using the Early Treatment of Diabetic Retinopathy Study (ETDRS) protocol. The binocular PVA, which was scored as the total number of letters read correctly, was documented with the participants’ existing refractive correction at 4 meters utilizing the participants’ current reading prescription.
Lens Opacities Classification System II Grading
Slit-lamp examination following dilation with tropicamide and phenylephrine 2.5% was used for lens assessment. The Lens Opacities Classification System II (LOCS II), which is based on photographic standards, was used to categorize opacities into 5 posterior subcapsular (P0, PI, PII, PIII, PIV), 5 nuclear (N0, NI, NII, NIII, NIV), and 7 cortical (C0, Ctr, CI, CII, CIII, CIV, CV) gradings of increasing severity. Phakic status (phakic, pseudophakic, or aphakic) was recorded for each eye. In cases where lens assessment was not possible, reasons for not grading certain regions in 1 or both eyes were documented.
The reproducibility of LOCS II grading was evaluated between 2 examiners on a regular basis throughout the study. Two examiners performed replicate grading on 50 participants independently every 5 to 6 months. Their LOCS II gradings were compared and measured for agreement using proportionally weighted kappa (κ) statistics. Results showed moderate to good inter-grader agreement for all opacity types (cortical opacities, weighted κ [95% confidence interval (CI)] = 0.67 [0.56–0.79]; nuclear opacities, weighted κ = 0.76 [0.66–0.87]; and PSC opacities, weighted κ = 0.66 [0.24–1.0]).
Definitions of Lens Opacity
Posterior subcapsular (PSC) lens opacity was defined by LOCS II grading of PII, PIII, or PIV; nuclear lens opacity was defined by LOCS II grading of NII, NIII, or NIV; and cortical lens opacity was defined by LOCS II grading of CII, CIII, CIV, or CV.
Definitions of Incidence and Progression
In our study we present 2 measures of the 4-year incidence for various lens opacity types.
In the first measure, we present the incidence of any cortical, any nuclear, or any PSC opacity in either or both eyes among participants without that specific opacity type in either eye at baseline. This measure provides the incident risk of each specific opacity type and does not take into account whether other opacity types were present at baseline or follow-up in the same person.
In the second measure, we present the incidence of single opacity types (when only 1 type developed) and mixed opacities (when more than 1 type developed) among participants without any opacity in either eye at baseline. This measure provides insight into the development of single versus mixed opacities, and consisted of 4 mutually exclusive groups: the development of cortical-only, nuclear-only, PSC-only, or mixed opacities. Incidence of the 4 mutually exclusive outcomes was based on person (not eye). For example, if a person developed 1 type of opacity in 1 eye and another opacity in the other eye, the person was considered to have developed “mixed opacities.” Only participants with gradable LOCS II scores for all 3 types were considered.
The incidence of all lens changes was defined by participants with the development of at least 1 type of opacity or cataract surgery, among those without opacities at baseline. This allowed us to understand the total risk of all new opacities in our population.
The 4-year progression of each opacity type was defined by an increase of ≥2 in LOCS II score in at least 1 eye among people with that opacity type in the same eye at baseline. Participants who could not have progressed by these criteria (≥C4, ≥N3, or ≥P3 in both eyes) were excluded.
Data and Statistical Analysis
All clinical and grading data were entered into a central database with internal automated quality control checks. The Statistical Analysis System (version 9.1; SAS Institute Inc, Cary, North Carolina, USA) was used for tabulations and statistical analyses, conducted at the 0.05 significance level. Age at baseline was presented and categorized into 4 groups (40–49 years, 50–59 years, 60–69 years, and 70 years and older) for all analyses. χ 2 tests were used to detect differences by opacity types and gender. Tests for trend were used to detect any linear trends in age.
Results
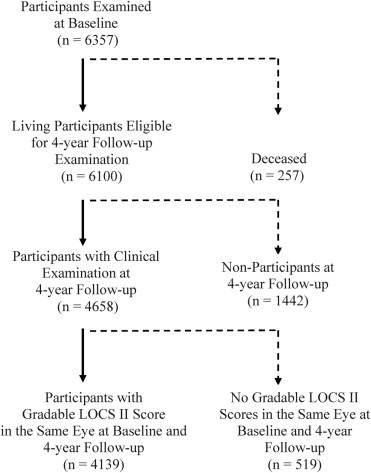
Of the 6357 participants examined at baseline, 6100 living participants were eligible for the 4-year follow-up study; and 4658 (76%) completed a clinical examination at the 4-year follow-up. Mean follow-up period was 4.2 ± 0.5 years. Mean age of participants was 54.7 years, 60% were female, 76% were born outside of the United States, and 88% had Mexican American ancestry. Nonparticipants were more likely to be: male (44% vs 40%; P = .003), not married (33% vs 29%; P < .001), and without health insurance coverage (46% vs 33%; P < .001) in comparison to participants at follow-up.
Of the 4658 participants who completed the clinical examination at follow-up, 4139 (89%) had gradable LOCS II scores in the same eye(s) at baseline and at 4-year follow-up examination ( Figure ). Nuclear gradings were available for 4139 participants (89%) in at least 1 eye, and cortical and PSC gradings were available on 3814 participants (82%) in at least 1 eye. LOCS II grading could not be performed on 519 participants (11%) because of refusal, poor fixation, or poor dilation.
The changes in LOCS II scores over 4 years for each lens opacity type are shown in Table 1 . There were no changes in LOCS II scores for 63.2% of cortical, 53.3% of nuclear, and 91.8% of PSC gradings. One-step increases were the most frequent changes in score for cortical, nuclear, and PSC lens opacities. One-step decreases in LOCS II scores were much less common, with 2-step decreases being extremely rare.
| Change in LOCS II Scores | Cortical, % (n = 3814) | Nuclear, % (n = 4139) | PSC, % (n = 3814) |
|---|---|---|---|
| −2 | 1.8 | 0.2 | 0.2 |
| −1 | 9.0 | 16.2 | 1.3 |
| 0 | 63.2 | 53.3 | 91.8 |
| 1 | 15.5 | 27.9 | 4.3 |
| ≥2 | 10.5 | 2.4 | 2.3 |
a Cohort for each opacity type included individuals with gradable opacity type at baseline and follow-up.
A total of 3578 participants (77%) were free of cataract at baseline and were thus considered at risk of developing incident lens opacities. Table 2 shows the estimated 4-year incidence of any cortical, any nuclear, and any PSC lens opacity, stratified by baseline age, regardless of new incidence of other lens opacity types. While there was a clear trend of increasing incidence for all lens opacity types with age ( P < .0001 for each), gender was not significantly associated with incidence of any lens opacity type ( P = .31 for any lens opacity; P = .72 for any cortical; P = .82 for any nuclear; P = .80 for any PSC; data not shown in Table 2 ). The total incidences for all participants (ages 40 and over) were 7.5% for any cortical opacities, 10.2% for any nuclear opacities, and 2.5% for any PSC opacities.
| Age at Baseline (Years) | Four-Year Incidence a | ||||||||
|---|---|---|---|---|---|---|---|---|---|
| Any Cortical Opacities | Any Nuclear Opacities | Any PSC Opacities | |||||||
| N | n | % (CI) | N | n | % (CI) | N | n | % (CI) | |
| 40–49 | 1454 | 35 | 2.4 (1.6, 3.2) | 1626 | 16 | 1.0 (0.5, 1.5) | 1480 | 13 | 0.9 (0.4, 1.4) |
| 50–59 | 1145 | 75 | 6.6 (5.1, 8.0) | 1321 | 86 | 6.5 (5.2, 7.9) | 1232 | 17 | 1.4 (0.7, 2.0) |
| 60–69 | 553 | 95 | 17.2 (14.0, 20.3) | 701 | 186 | 26.5 (23.2, 29.8) | 711 | 35 | 4.9 (3.3, 6.5) |
| 70+ | 170 | 44 | 25.9 (19.3, 32.5) | 194 | 104 | 53.6 (46.6, 60.6) | 271 | 28 | 10.3 (6.7, 14.0) |
| P < .001 | P < .001 | P < .001 | |||||||
| Overall | 3322 | 249 | 7.5 (6.6, 8.4) | 3842 | 392 | 10.2 (9.2, 11.2) | 3694 | 93 | 2.5 (2.0, 3.0) |
a Incidences presented were for each opacity type. Participants with more than 1 type of opacity may be included in more than 1 category.
Table 3 shows the estimated 4-year incidence of single-type lens opacities (cortical only, nuclear only, PSC only), mixed-type lens opacities, and all lens opacities, stratified by baseline age. Age was significantly associated with the incidence of cortical-only opacities ( P < .001), nuclear-only opacities ( P < .001), mixed-type opacities ( P < .001), and all lens opacities ( P < .001), but not with PSC-only opacities ( P = .25). Gender was significantly associated with PSC-only opacities ( P = .005), with women having a higher incidence than men (0.73% vs 0.07%). However, gender was not associated with the other opacity types ( P = .90 for cortical-only, P = .90 for nuclear-only, P = .95 for mixed-type opacities; gender data not shown in Table 3 ). The total incidences of each single-type opacity were: 4.1% for cortical-only opacities, 5.8% for nuclear-only opacities, and 0.5% for PSC-only opacities. The total incidence of mixed-type opacities was 2.5%. For the 4-year incidence of all lens opacities, persons with a history of cataract surgery were included and considered in the group having lens opacities. The 4-year incidence of all lens opacities was 14.2% overall, and increased from 3.4% among ages 40–49 and to 63.5% for ages 70 and over.
| Four-Year Incidence | All Lens Changes a | |||||||||||
|---|---|---|---|---|---|---|---|---|---|---|---|---|
| Age at Baseline (Years) | N b | Cortical-Only Opacities | Nuclear-Only Opacities | PSC-Only Opacities | Mixed-Type Opacities | |||||||
| n c | % (CI) | n c | % (CI) | n c | % (CI) | n c | % (CI) | N b | n | % (CI) | ||
| 40–49 | 1595 | 29 | 1.8 (1.2, 2.5) | 9 | 0.6 (0.2, 0.9) | 6 | 0.4 (0.1, 0.7) | 7 | 0.4 (0.1, 0.8) | 1626 | 55 | 3.4 (2.5, 4.3) |
| 50–59 | 1219 | 55 | 4.5 (3.4, 5.7) | 52 | 4.3 (3.1, 5.4) | 5 | 0.4 (0.1, 0.8) | 18 | 1.5 (0.8, 2.2) | 1286 | 153 | 11.9 (10.1, 13.7) |
| 60–69 | 540 | 45 | 8.3 (6.0, 10.7) | 100 | 18.5 (15.2, 21.8) | 4 | 0.7 (0.0, 1.5) | 43 | 8.0 (5.7, 10.3) | 608 | 219 | 36.0 (32.2,39.8) |
| 70+ | 117 | 12 | 10.3 (4.8, 15.8) | 39 | 33.3 (24.8, 41.9) | 1 | 0.9 (0.0, 2.5) | 20 | 17.1 (10.3, 23.9) | 148 | 94 | 63.5 (55.8,71.2) |
| P < .001 | P < .001 | P = .25 | P < .001 | P < .001 | ||||||||
| Overall | 3471 | 141 | 4.1 (3.4, 4.7) | 200 | 5.8 (5.0, 6.5) | 16 | 0.5 (0.2, 0.7) | 88 | 2.5 (2.0, 3.1) | 3668 | 521 | 14.2 (13.1,15.3) |
a Incidence of all lens changes was defined by those with cortical-only, nuclear-only, PSC-only, mixed-type, or cataract surgery (n=76) among those with no lens opacity in either eye at baseline. Mixed refers to cases where more than 1 type of opacity was present.
Table 4 shows the estimated 4-year progression of any lens opacities, stratified by baseline age. The total progression of any cortical opacities was 8.5% (38/447), with age not being significantly associated ( P = .33). The total progression of any nuclear opacities was 3.7% (9/242), with age also not being significantly associated ( P = .95). The total progression of any PSC opacities was 2.9% (2/69), which occurred only in the 60–69 age group. Gender was not significantly associated with progression of any opacity types (data not shown).
| Age at Baseline (years) | Four-Year Progression a | ||||||||
|---|---|---|---|---|---|---|---|---|---|
| Any Cortical Opacities | Any Nuclear Opacities | Any PSC Opacities | |||||||
| N b | n c | % (CI) | N b | n c | % (CI) | N b | n c | % (CI) | |
| 40–49 | 32 | 3 | 9.4 (0.0, 19.5) | 8 | 0 | ⁎ | 3 | 0 | ⁎ |
| 50–59 | 100 | 13 | 13.0 (6.4, 19.6) | 21 | 1 | 4.8 (0.0, 13.9) | 10 | 0 | ⁎ |
| 60–69 | 185 | 11 | 5.9 (2.5, 9.4) | 92 | 4 | 4.4 (0.2, 8.5) | 29 | 2 | 6.9 (0.0, 16.1) |
| 70+ | 130 | 11 | 8.5 (3.7, 13.3) | 121 | 4 | 3.3 (0.1, 6.5) | 27 | 0 | ⁎ |
| P value (trend test) | .33 | .95 | .78 | ||||||
| Overall | 447 | 38 | 8.5 (5.9, 11.1) | 242 | 9 | 3.7 (1.3, 6.1) | 69 | 2 | 2.9 (0.0, 6.9) |
Stay updated, free articles. Join our Telegram channel

Full access? Get Clinical Tree


