Purpose
To report a method for en face imaging of the photoreceptor inner and outer segment junction by spectral-domain optical coherence tomography (SD OCT) and to describe findings in normal subjects and patients with various retinal diseases.
Design
Observational case series.
Methods
SD OCT images were acquired from 6 normal subjects (mean age, 44 ± 11 years) and from 5 subjects with retinal diseases (mean age, 66 ± 22 years). A customized high-density SD OCT volume scan was acquired on the retina. SD OCT B-scan images were segmented automatically to extract intensity data along the inner and outer segment junction. Data obtained from the raster B-scans were combined to generate an inner and outer segment en face image in a 4.4 × 4.4-mm retinal area centered on the fovea. The foveal-to-parafoveal mean intensity ratio was measured, and repeatability was determined. An infrared scanning laser ophthalmoscope image was acquired and was cropped to provide a field of view similar to the inner and outer segment en face image.
Results
Inner and outer segment en face images generated in normal subjects provided clear visualization of the retinal vasculature, matching the vascular network observed in the infrared scanning laser ophthalmoscope image. In normal subjects, the foveal-to-parafoveal mean intensity ratio was 0.88 ± 0.06, and repeatability of measurements was, on average, 7%. In macular hole, a dark circular region was observed in the inner and outer segment en face image, indicative of photoreceptor cell loss. In age-related macular degeneration, the en face image displayed nonuniform texture corresponding to topographic variations in the inner and outer segment junction. In central serous retinopathy, areas of lower intensity were visible on the en face image corresponding to regions of prior neurosensory elevation. In cystoid macular edema, reduced intensity was present in the inner and outer segment en face image in areas with increased retinal thickness. In diabetic retinopathy, the inner and outer segment en face image displayed regions of reduced intensity resulting from edema, laser scars, or both.
Conclusions
Detection of intensity abnormalities in the inner and outer segment en face image is useful for monitoring the integrity of photoreceptor cells in the course of disease progression and therapeutic intervention.
The availability of spectra-domain optical coherence tomography (SD OCT) has improved visualization and delineation of retinal substructures. In particular, the junction of the inner and outer segments of the photoreceptors has been visualized on SD OCT B-scans. Recent studies have shown an association between visual acuity and continuity (integrity) of the inner and outer segment junction in patients with retinitis pigmentosa, Stargardt disease, retinal vein occlusion, age-related macular degeneration (AMD), and resolved central serous chorioretinopathy. Additionally, both photoreceptor outer segment length and continuity of the inner and outer segment junction have been shown to affect visual function of patients with diabetic macular edema. To our knowledge, few methods have evaluated the integrity of the inner and outer segment junction in an en face manner. In this article, we report a new automated image reconstruction method based on SD OCT imaging to generate en face images of the inner and outer segment junction and to describe findings in normal subjects and patients with various retinal diseases.
Methods
Subjects
Six visually normal subjects (3 females and 3 males) and 5 subjects with retinal diseases (2 females and 3 males) participated in the study. Data were obtained in 1 eye of normal subjects and in 1 or both eyes of subjects with retinal pathologic features. The ages of normal subjects ranged from 30 to 58 years, with a mean age of 44 ± 11 years (mean ± standard deviation), whereas ages of subjects with retinal diseases ranged from 35 to 92 years, with a mean age of 66 ± 22 years.
Image Acquisition
SD OCT images were acquired using a commercially available instrument (Spectralis; Heidelberg Engineering, Heidelerg, Germany). A high-density SD OCT volume scan centered on the macular area was acquired. The OCT volume scan consisted of 145 raster B-scans images, each 768 pixels in length (5.7 μm/pixel) and separated by 31 μm, thus covering an area of 4.4 × 4.4 mm on the retina. The number of pixels in depth (vertical dimension of the B-scan image) varied among images because of the instrument’s eye-tracking capability, but the depth resolution was constant (3.9 μm/pixel). The instrument’s eye tracker allowed multiple B-scans to be averaged at a single location. The time for acquiring the OCT volume scan varied depending on fixation stability of the subject, but typically was less than 20 seconds. An infrared (IR) scanning laser ophthalmoscope (SLO) image was acquired with the same instrument to document the area of imaging. To provide a field of view similar to the inner and outer segment en face image, the IR SLO image was cropped and intensity levels were adjusted, thereby improving visualization of retinal features.
Image Segmentation
The inner and outer segment junction was segmented automatically from each B-scan image using software developed in MATLAB (The Mathworks, Inc, Natick, Massachusetts, USA). The inner and outer segment junction typically is characterized in OCT images as a thin reflective layer, posterior to the weak reflecting (dark) outer nuclear layer and anterior to the strong reflecting (bright) retinal pigment epithelium (RPE) complex. In general, the segmentation algorithm identified the inner and outer segment junction by searching for a local intensity maximum between the outer nuclear layer and RPE. First, each B-scan image was divided into vertical sections of equal width. The width of the vertical section was assigned empirically to 16 pixels, thereby identifying the inner and outer segment junction at 91-μm intervals along the horizontal dimension of the SD OCT B-scan. For each section, a mean intensity profile was computed by horizontal averaging of pixel intensities and a low-pass filter was used to smooth the profile further, as shown in Figure 1 . From the smoothed profile, the locations of the 2 largest peaks were obtained, corresponding to the RPE and inner limiting membrane. Subsequently, the location of the local minimum between the 2 peaks was found, corresponding to the outer nuclear layer. Finally, from the mean intensity profile, the location of the largest peak between the local minimum and the posterior peak (RPE) of the smoothed profile was obtained, corresponding to the inner and outer segment junction. If no peak was found in the final step or the inner and outer segment junction was more than 80 μm anterior to the RPE, no inner and outer segment junction location was stored for the particular section. These steps were repeated for each vertical section, and a continuous line was drawn by interpolation between inner and outer segment junction locations.
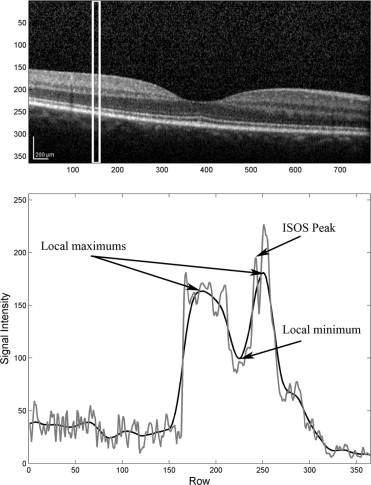
Image Reconstruction and Analysis
An inner and outer segment en face image was generated by extracting the intensity data along the inner and outer segment junction in each B-scan image and storing the data in consecutive rows of the en face image. The inner and outer segment junction thickness varied between 3 and 5 pixels, based on inspection of B-scans in normal subjects. Therefore, the intensity data of the line defining the inner and outer segment junction with 5-pixel (20-μm) width was extracted using bilinear interpolation, and the data were stored as 5 rows along the inner and outer segment en face image. This procedure was repeated for each B-scan image to generate an inner and outer segment en face image. The inner and outer segment en face image then was resampled to adjust the vertical dimension of the image, yielding a square image of 768 × 768 pixels. Finally, a smoothing filter that vertically averaged every 5 pixels was applied to the inner and outer segment en face image, thereby diminishing horizontal lines that appeared because of reflectance variations of the inner and outer segment junction among B-scan images acquired from the same subject.
Inner and outer segment en face images were analyzed by calculating the mean of intensity values in 2 retinal circular areas with dimensions defined according to the Early Treatment Diabetic Retinopathy Study. The foveal area encompassed a circular region 1.2 mm in diameter centered on the fovea, and the parafoveal area encompassed a concentric ring with inner and outer diameters of 1.2 and 3.1 mm, respectively. The ratio of the mean intensity of foveal to parafoveal areas was determined. As compared with mean intensity values, the ratio is a more reliable parameter because it accounts for variations between visits and among subjects as a result of optical factors. Repeatability was assessed by the percent difference of foveal-to-parafoveal mean intensity ratio measurements obtained from 2 repeated images in 5 normal subjects.
Results
Normal Subjects
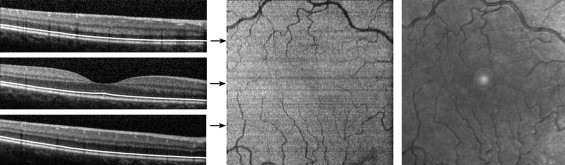
The segmentation of the inner and outer segment junction for 3 typical B-scans, acquired at the fovea, superior and inferior to the fovea in the right eye of a normal 30-year-old man is displayed in Figure 2 . Visual acuity in the right eye was 20/20. The algorithm correctly identified the inner and outer segment junction in each B-scan, as shown by the continuous white line overlaid on the B-scan images. The reconstructed inner and outer segment en face image displayed retinal vasculature resulting from shadowing of the vessels on the inner and outer segment junction, matching the vascular network observed in the IR SLO image. The high-intensity spot present in the center of the IR image is an artifact associated with the instrument and is unrelated to the retina.
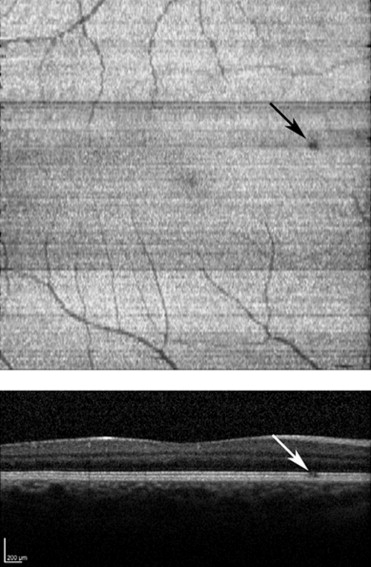
The inner and outer segment en face image from the right eye of a normal 31-year-old man with 20/20 visual acuity is displayed in Figure 3 . A focal dark spot was detected on the inner and outer segment en face image at a location supranasal to the fovea. The corresponding B-scan revealed a small discontinuity in the inner and outer segment junction at the location of the dark spot. Among normal subjects, the foveal-to-parafoveal mean intensity ratio ranged between 0.79 and 0.94 and was on average 0.88 ± 0.06 (mean ± standard deviation; n = 6). Repeatability of the intensity ratio was on average 7% (n = 5).
Case 1
Age-Related Macular Degeneration and Macular Hole: A 68-year-old woman with a history of neovascular AMD in the left eye underwent SD OCT imaging 4 months after pars plana vitrectomy for a macular hole in the left eye. The macular hole was observed to be closed on clinical examination. Visual acuity after surgery in the left eye was 20/60 (pinhole without improvement). Examples of applying the inner and outer segment segmentation algorithm to B-scans are shown in Figure 4 . For locations with an absent inner and outer segment junction, the position was estimated by interpolating between the nearest locations where the inner and outer segment junctions were found, as described in the Methods. The macular hole was observed in the inner and outer segment en face image as a dark circular region because of the absence of reflectance from the inner and outer segment junction. The foveal-to-parafoveal mean intensity ratio was 0.58, lower than the range in normal subjects. In addition, the adjacent retinal cysts also were visualized on the en face image.
Case 2
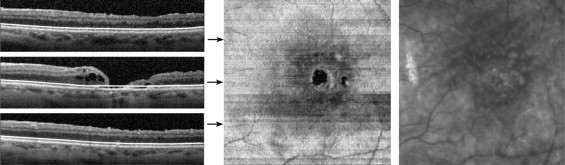
Age-Related Macular Degeneration: An 80-year-old man with a history of an eccentric neovascular lesion resulting from AMD was imaged in the left eye. The subject had undergone a combined phacoemulsification with intraocular lens implantation with pars plana vitrectomy for a mature cataract and a dense vitreous hemorrhage caused by an eccentric disciform scar. Drusen and RPE mottling in the central macular area were present after surgery on clinical examination. Visual acuity in the left eye was 20/25. Examples of B-scans, the inner and outer segment en face image, and the IR SLO image are shown in Figure 5 . Small and localized elevations of the inner and outer segment junction resulting from the underlying drusen and RPE changes were visible in the B-scans. Topographic variations in the inner and outer segment junction were displayed in the inner and outer segment en face image as regions with nonuniform texture, particularly inferior to the fovea, where areas with slightly higher intensity were observed. The visible intensity variation along rows of the image and the mildly discontinuous vascular network were attributed to limited fixation stability of the subject, resulting in variations in the reflectance from the inner and outer segment junction among B-scans.
Stay updated, free articles. Join our Telegram channel

Full access? Get Clinical Tree


