Purpose
To identify factors associated with best-corrected visual acuity (BCVA) presentation and 2-year outcome in 479 intermediate, posterior, and panuveitic eyes.
Design
Cohort study using randomized controlled trial data.
Methods
Multicenter Uveitis Steroid Treatment (MUST) Trial masked BCVA measurements at baseline and at 2 years follow-up used gold-standard methods. Twenty-three clinical centers documented characteristics per protocol, which were evaluated as potential predictive factors for baseline BCVA and 2-year change in BCVA.
Results
Baseline factors significantly associated with reduced BCVA included age ≥50 vs <50 years; posterior vs intermediate uveitis; uveitis duration >10 vs <6 years; anterior chamber (AC) flare >grade 0; cataract; macular thickening; and exudative retinal detachment. Over 2 years, eyes better than 20/50 and 20/50 or worse at baseline improved, on average, by 1 letter ( P = .52) and 10 letters ( P < .001), respectively. Both treatment groups and all sites of uveitis improved similarly. Factors associated with improved BCVA included resolution of active AC cells, resolution of macular thickening, and cataract surgery in an initially cataractous eye. Factors associated with worsening BCVA included longer duration of uveitis (6–10 or >10 vs <6 years), incident AC flare, cataract at both baseline and follow-up, pseudophakia at baseline, persistence or incidence of vitreous haze, and incidence of macular thickening.
Conclusions
Intermediate, posterior, and panuveitis have a similarly favorable prognosis with both systemic and fluocinolone acetonide implant treatment. Eyes with more prolonged/severe inflammatory damage and/or inflammatory findings initially or during follow-up have a worse visual acuity prognosis. The results indicate the value of implementing best practices in managing inflammation.
Uveitis has been reported to be the fifth- to seventh-leading cause of blindness in developed countries. The incidence has been estimated at 17-52 new cases/100 000/year and the prevalence at 58-115/100 000 ; it causes several-fold more years of potential vision lost per case than age-related diseases, owing to an average age of onset decades earlier in life. The economic impact per case of uveitis-induced visual loss is correspondingly high, potentially on par with that for diabetic retinopathy.
For many cases, treatment is able to mitigate vision loss. However, treatment is potentially expensive, and is complicated to administer. Identification of factors predictive of a poorer visual outcome and comparison of outcomes in patients treated with either systemic or “local” therapy with a fluocinolone acentonide implant would help guide clinicians in making treatment decisions.
As part of the Multicenter Uveitis Steroid Treatment (MUST) Trial, 479 eyes of 255 patients were followed longitudinally for 2 years, with protocol-driven collection of best-corrected visual acuity (BCVA) using gold-standard methods. Standardized data collection regarding a wide variety of characteristics potentially predictive of visual outcome was undertaken. Here we report results regarding factors predictive of visual outcome from this cohort.
Methods
The MUST Trial—a comparative effectiveness trial comparing fluocinolone acetonide 0.59 mg implant therapy vs systemic therapy with corticosteroids supplemented in most cases with immunosuppression—randomized subjects having active or recently active (within 60 days) intermediate uveitis, posterior uveitis, or panuveitis to the alternative treatments. The MUST Trial ( ClinicalTrials.gov Identifier: NCT00132691 ) was approved by governing institutional review boards at all participating clinical centers and at the Coordinating and Reading Centers (see Appendix 1 for a list of study participants, and Appendix 2 for list of institutional review boards; appendices are available online at www.AJO.com ); approval was maintained throughout the study. The protocol and primary outcomes of the study have been described previously. In brief, eligibility was based on presenting with at least 1 uveitic eye for which systemic corticosteroid therapy would be indicated, and absence of characteristics suggesting that 1 of the alternative treatments would be contraindicated. In the systemic therapy arm, subjects were assigned systemic corticosteroid therapy supplemented by systemic immunosuppressive therapy when indicated, following guidelines for such therapy developed by an expert panel. In the implant therapy arm, subjects were assigned to initial quieting of the anterior chamber using topical, injected, and/or oral corticosteroid therapy followed by implantation of a fluocinolone acetonide implant in each eye for which study treatment was indicated. Both groups were permitted use of topical corticosteroids without restriction, on grounds that such treatment would have limited impact on the posterior segment, and for ethical reasons. In addition to use for quieting the anterior chamber prior to implant surgery, periocular and intravitreous injections were indicated in the trial for treatment of residual complications of uveitis—for example, macular edema —rather than as a primary anti-inflammatory treatment. All subjects provided informed consent. Subjects were enrolled between December 2005-December 2008 and then followed for two years.
At baseline, demographic data and clinical characteristics were collected for all patients (see Table 1 and Supplemental Table 1 , the latter available online at http://www.ajo.com ). These included age, sex, race/ethnicity, smoking status, presence of an associated systemic inflammatory disease, diagnosis with diabetes mellitus, bilaterality vs unilaterality of uveitis, years between diagnosis with uveitis and enrollment, and site of inflammation as defined by the Standardization of Uveitis Nomenclature (SUN) Working Group modification of International Uveitis Study Group criteria (anterior plus intermediate uveitis, intermediate uveitis, posterior uveitis, or panuveitis).
| Baseline Factor | Baseline Visual Acuity | |||
|---|---|---|---|---|
| Crude | Adjusted a | |||
| Mean Difference ± SE (Letters) | P Value | Mean Difference ± SE (Letters) | P Value | |
| Patient-specific | ||||
| Type of uveitis | ||||
| Anterior/intermediate vs intermediate | −7 ± 4 | .11 | −1 ± 3 | .82 |
| Posterior vs intermediate | −3 ± 3 | .30 | −6 ± 3 | .02 |
| Panuveitis vs intermediate | −6 ± 3 | .04 | −3 ± 3 | .26 |
| Age 50+ vs <50 y | −7 ± 2 | .002 | −4 ± 2 | .05 |
| Years since uveitis diagnosis | ||||
| 6–10 vs <6 | −5 ± 3 | .10 | −1 ± 3 | .78 |
| >10 vs <6 | −17 ± 4 | <.001 | −10 ± 4 | .005 |
| Eye-specific | ||||
| IOP (mm Hg) | ||||
| ≤7 vs 8–20 | −40 ± 9 | <.001 | −8 ± 9 | .36 |
| 21+ vs 8–20 | 2 ± 3 | .52 | −5 ± 4 | .12 |
| Anterior chamber cells | ||||
| 0.5+ vs none | 0 ± 2 | .87 | 0 ± 3 | .86 |
| 1+ vs none | −11 ± 4 | .02 | −3 ± 4 | .34 |
| >1+ vs none | −12 ± 8 | .12 | 6 ± 5 | .26 |
| Anterior chamber flare | ||||
| 1+ vs 0 | −6 ± 3 | .02 | −7 ± 3 | .01 |
| 2+ or more vs 0 | −26 ± 6 | <.001 | −12 ± 5 | .01 |
| Lens status | ||||
| Cataract vs normal | −13 ± 3 | <.001 | −6 ± 2 | .01 |
| Pseudophakic/aphakic vs normal | −17 ± 2 | <.001 | −5 ± 3 | .07 |
| Vitreous haze | ||||
| 1+ vs clear | 0 ± 2 | .88 | 2 ± 2 | .20 |
| >1+ vs clear | −17 ± 3 | <.001 | −4 ± 3 | .12 |
| Missing vs clear | −52 ± 12 | <.001 | 1 ± 14 | .97 |
| OCT retinal thickness (μm) | ||||
| 240–339 vs <240 | −7 ± 2 | <.001 | −4 ± 2 | .08 |
| 340+ vs <240 | −22 ± 3 | <.001 | −16 ± 3 | <.001 |
| Missing vs <240 | −59 ± 11 | <.001 | −36 ± 11 | .001 |
| Exudative retinal detachment: Yes vs No | −2 ± 9 | .80 | −10 ± 4 | .03 |
a Crude analyses reflect un-adjusted associations between each covariate and best-corrected visual acuity. In the adjusted model, the associations between each covariate and best-corrected visual acuity are adjusted for all of the other variables shown. There were 468 non-missing observations. Factors also studied which were not associated with differences in mean best-corrected visual acuity at baseline included: sex, race, smoking status, presence of systemic inflammatory disease, diagnosis with diabetes mellitus, bilaterality of uveitis, and the presence of anterior or posterior synechiae (full details available in Supplemental Table 1 , available online at: http://www.ajo.com ).
After the baseline visit, patients had study visits at 1 month, 3 months, and quarterly thereafter through 2 years. BCVA, the primary outcome of the study, was measured at all visits using gold-standard methods, which involved a protocol-driven refraction under standardized lighting conditions using a logarithmic visual acuity chart. BCVA was measured by masked examiners at baseline, at 6 months, and thereafter. The BCVA at 1 and 3 months was measured by unmasked examiners, to avoid unmasking (owing to visible postoperative changes in implant-treated eyes at these relatively early postoperative visits). The visual acuity measurement protocol was enforced by a visual function quality assurance committee that certified all examiners and conducted regular site visits for protocol enforcement. Additional clinical information collected at all visits by study-certified ophthalmologists included the presence of posterior synechiae, anterior chamber cells, and flare (each measured per SUN guidelines ); lens status (clear or trivial opacities, cataract, pseudophakia, or aphakia); and the presence of choroidal neovascularization, retinal vascular sheathing, and/or retinal detachment. During the MUST Trial, vitreous haze was measured using a modification of the SUN-endorsed National Eye Institute scale in which 0.5+ haze was omitted. The presence of peripheral anterior synechiae was assessed by annual gonioscopy. In addition, Goldmann applanation tonometry measurement of intraocular pressure (the median of 3 measurements) was conducted at every visit. Macular thickness was determined by masked Reading Center gradings of macular thickness based on time-domain (Zeiss Stratus 3; Carl Zeiss AG, Oberkochen, Germany) optical coherence tomography (OCT) images.
Baseline characteristics were compared across the 4 anatomic sites of uveitis inflammation using multinomial regression with generalized estimating equations to account for correlation owing to patients with 2 affected eyes. Visual acuity in each eye was dichotomized as better than >20/50 Snellen equivalent or 20/50 or worse. Logistic regression with generalized estimating equations was used to assess the association of baseline characteristics with dichotomized visual acuity at baseline. Baseline BCVA also was modeled continuously. Because of the left-skewness of the distribution owing to observations with poor visual acuity, robust linear regression was used to down-weight outliers and bootstrapping with 2000 repetitions clustering on patient was used to obtain valid estimates of the standard error. The adjusted model included all baseline predictive factors. Because missingness was informative, vitreous haze, OCT retinal thickness, and retinal sheathing included a category for “missing.” Seven observations with missing data in other variables were excluded from the multiple regression analysis. Change in visual acuity at 2 years was modeled using robust linear regression and bootstrapping with 2000 repetitions clustering on patient and adjusted for baseline visual acuity. Analyses were stratified by visual acuity at baseline into better than 20/50 Snellen equivalent or 20/50 or worse. Patient-level predictive factors were modeled as time-independent and eye-level predictive factors were categorized into 1 of 4 categories: normal at both baseline and 2 years; normal at baseline and abnormal at 2 years; abnormal at baseline and normal at 2 years; or abnormal at both baseline and 2 years. Wald’s test was used to assess whether the relationship of change in visual acuity at 2 years with the predictive factor varied by baseline visual acuity subgroup. Statistical analyses were done with SAS (SAS Institute [Cary, North Carolina] 2011, Base SAS 9.3 Procedures Guide) and Stata (StataCorp [College Station, Texas] 2013, Stata Statistical Software: release 13).
Results
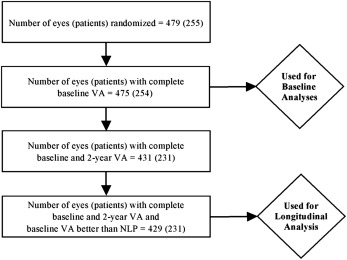
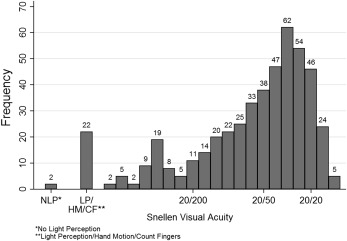
Among the 479 uveitic eyes of 255 patients enrolled in the MUST Trial, 475 eyes of 254 patients had complete visual acuity information at baseline and were assessed for the presenting visual acuity analyses. Characteristics of this population have been reported previously. Four hundred twenty-nine eyes of 231 patients had complete visual acuity at the 2-year follow-up visit (excluding 2 eyes with no light perception at baseline, which could not have changed), and were used in the incidence analyses ( Figure 1 ). At baseline, BCVA was distributed widely, from better than 20/20 to no light perception, with a skew toward better vision and a median BCVA = 20/40 ( Figure 2 ).
Factors Predictive of Reduced Mean Visual Acuity at Baseline
Factors significantly associated with differences in mean BCVA at baseline are summarized in Table 1 (a focused excerpt of a complete summary of all factors studied that is available as Supplemental Table 1 , online at www.AJO.com ). Age >50 years was associated with poorer baseline BCVA (mean BCVA 4 letters worse [-4 letters], adjusted model P = .05). Sex, race, smoking status, presence of diabetes mellitus, and presence of a systemic inflammatory disease associated with uveitis were not significantly related to baseline visual acuity status. With respect to intermediate uveitis, posterior uveitis (-6 letters, P = .02) was associated with significantly lower BCVA, whereas panuveitis (-3 letters, P = .26) and anterior and intermediate uveitis had fairly similar BCVA (-1 letter, P = .82). With respect to eyes with uveitis diagnosed fewer than 6 years before baseline, eyes with uveitis diagnosed >10 years prior to baseline had significantly worse BCVA (-10 letters, P = .005), whereas those diagnosed 6–10 years earlier had similar BCVA (-1 letter, P = .78). After adjusting for other factors (including pathologies complicating inflammation), anterior cell count and the level of vitreous haze were not significantly associated with baseline BCVA, although vitreous haze 2+ or worse tended to be associated with lower BCVA (-4 letters, P = .12). Detectable anterior chamber flare was associated with worse baseline BCVA (grade 1+: -7 letters, P = .01; grade 2+ or worse: -12 letters, P = .01).
Uveitic complications associated with decreased BCVA included cataract (-6 letters, P = .01), retinal detachment (-10 letters, P = .03), and macular thickening by OCT. Eyes that had undergone cataract surgery prior to baseline tended to have reduced mean BCVA compared with eyes with clear lenses (-5 letters, P = .07). The degree of macular thickening was associated with lower mean BCVA in a dose-response relationship (240–339 μm: -4 letters, P = .08; ≥340 μm: -16 letters, P < .001, each compared with “normal” thickness ≤239 μm). With respect to normal intraocular pressure (IOP) (8–20 mm Hg), neither low IOP (≤7 mm Hg: -8 letters, P = .36) nor high IOP (≥21 mm Hg: -5 letters, P = .12) was associated with significantly different presenting mean BCVA, although both tended to present with worse BCVA than normotensive eyes.
Loss of Visual Acuity During Follow-up
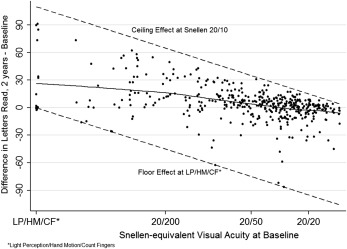
The relationship between baseline BCVA and BCVA at 2 years is plotted as Figure 3 . Among the 429 eyes with BCVA measurements at both baseline and 2 years, 38 (9%) worsened by ≥3 lines, 71 (16%) improved by ≥3 lines, and 320 (75%) had baseline and 2-year visual acuity within 3 lines of each other. Eyes with worse baseline BCVA tended to show more improvement than eyes presenting with better BCVA. Among 62 (14.5%) eyes presenting with BCVA of 20/200 or worse, only 6 (10%) experienced a loss of more than 3 lines of VA whereas 30 (48%) and 21 (34%) gained ≥3 and ≥6 lines, respectively, with a mean gain in BCVA of 20.2 letters. Among 113 (26.3%) eyes presenting with BCVA of 20/50 or worse but better than 20/200, 8 (7%) and 5 (4%) lost ≥3 and ≥6 lines, respectively, whereas 33 (30%) and 12 (11%), respectively, gained ≥3 and ≥6 lines, with an overall net mean gain of 9.9 letters. Among 254 (59.2%) eyes presenting with BCVA better than 20/50, potential for improvement was limited, but most eyes retained similar or better BCVA, with only 24 (9%) losing ≥3 lines and 12 (5%) losing ≥6 lines of BCVA, with an overall median improvement of +1.0 letters (interquartile range -5.0, +6.0).
Evaluation of factors potentially related to the 2-year change in BCVA (See Table 2 ) reconfirmed that treatment assignment to systemic or implant therapy was not a significant predictor (a complete list of factors studied is available as Supplemental Table 2 at www.AJO.com ). Age, sex, race, diabetes mellitus status, smoking status, and laterality of uveitis were not associated with mean change in BCVA outcome at 2 years. The presence of an associated systemic immune-mediated disease was associated with a slightly more favorable mean change in BCVA outcome (+3 letters, P = .04). Cases of anterior and intermediate uveitis, intermediate uveitis, posterior uveitis, and panuveitis all had a similar degree of improvement during follow-up (from different baselines). Compared with <6 years’ duration of uveitis, increased duration of uveitis was associated with relative worsening in BCVA during follow-up, with a dose-response relationship (6–10 years’ duration [-3 letters, P = .03], >10 years’ duration [-8 letters, P < .001]). Occurrence of cataract surgery during follow-up was associated with visual improvement (+5 letters, P = .02); resolution of posterior synechiae during follow-up (implying occurrence of cataract surgery) had a similar effect. In contrast, presence of a cataract at 2 years that had been present at baseline (-6 letters, P = .01) and pseudophakia at baseline (-5 letters, P = .03) both were associated with worsening of BCVA over 2 years’ follow-up. Regarding inflammatory clinical signs, resolution of anterior chamber cells present at baseline was associated with BCVA improvement (+4 letters, P = .02), whereas incidence of anterior chamber flare (≥1+ vs 0 at baseline, -7 letters, P = .04), incidence of vitreous haze (1+ or worse, grade 0 at baseline: -30 letters, P < .001), and persistence of vitreous haze (presence at both baseline and 2 years; -15 letters, P = .04) were associated with worsening of mean BCVA over 2 years. Incidence of macular edema was associated with worsening of BCVA (-11, P = .001), whereas resolution of macular edema was associated with improvement of BCVA (+5, P = .04). Other ocular characteristics, including IOP fluctuations, were not associated with significant mean changes in BCVA over 2 years.
| Combined | |||
|---|---|---|---|
| N | Mean Difference in Letters Read From BL ± Standard Error | P | |
| Overall | 429 | 5 ± 1 | <.001 |
| Patient-specific at baseline | |||
| Treatment group | |||
| Implant | 217 | Ref | |
| Systemic | 212 | −2 ± 2 | .25 |
| Age (y) | |||
| < 65 | 385 | Ref | |
| 65+ | 44 | 1 ± 3 | .76 |
| Associated systemic disease | |||
| No | 307 | Ref | |
| Yes | 122 | 3 ± 1 | .04 |
| Years since uveitis diagnosis | |||
| <6 | 244 | Ref | |
| 6–10 | 101 | −3 ± 2 | .03 |
| >10 | 79 | −8 ± 2 | <.001 |
| Eye-specific | |||
| Posterior synechiae | |||
| Norm-BL, Norm-2 y | 321 | Ref | |
| Norm-BL, Abnl-2 y | 14 | −2 ± 6 | .69 |
| Abnl-BL, Norm-2 y | 61 | 7 ± 3 | .01 |
| Abnl-BL, Abnl-2 y | 33 | 4 ± 3 | .18 |
| Anterior chamber cells | |||
| Norm-BL, Norm-2 y | 184 | Ref | |
| Norm-BL, Abnl-2 y | 36 | −1 ± 3 | .72 |
| Abnl-BL, Norm-2 y | 125 | 4 ± 2 | .02 |
| Abnl-BL, Abnl-2 y | 83 | 1 ± 2 | .71 |
| Anterior chamber flare | |||
| Norm-BL, Norm-2 y | 206 | Ref | |
| Norm-BL, Abnl-2 y | 20 | −7 ± 3 | .04 |
| Abnl-BL, Norm-2 y | 118 | 3 ± 2 | .06 |
| Abnl-BL, Abnl-2 y | 84 | −1 ± 2 | .74 |
| Lens status b | |||
| Norm-BL, Norm-2 y | 35 | Ref | |
| Norm-BL, Cataract-2 y | 21 | −6 ± 5 | .23 |
| Norm-BL, Pseudophakic-2 y | 43 | 0 ± 2 | .90 |
| Cataract-BL, Cataract-2 y | 44 | −6 ± 2 | .01 |
| Cataract-BL, Pseudophakic-2 y | 100 | 5 ± 3 | .02 |
| Pseudophakic-BL & 2 y | 181 | −5 ± 2 | .03 |
| Vitreous haze c | |||
| Norm-BL, Norm-2 y | 304 | Ref | |
| Norm-BL, Abnl-2 y | 5 | −30 ± 4 | <.001 |
| Abnl-BL, Norm-2 y | 79 | 3 ± 2 | .10 |
| Abnl-BL, Abnl-2 y | 7 | −15 ± 7 | .04 |
| Missing at BL or 2 y | 34 | 2 ± 13 | .90 |
| OCT retinal thickness d | |||
| Norm-BL, Norm-2 y | 211 | Ref | |
| Norm-BL, Abnl-2 y | 30 | −11 ± 3 | .001 |
| Abnl-BL, Norm-2 y | 75 | 5 ± 2 | .04 |
| Abnl-BL, Abnl-2 y | 53 | −1 ± 3 | .79 |
| Missing at BL or 2 y | 60 | 0 ± 5 | .97 |
| Exudative retinal detachment | |||
| Norm-BL, Norm- 2 y | 413 | Ref | |
| Norm-BL, Abnl-2 y | 1 | NC | |
| Abnl-BL, Norm-2 y | 15 | −2 ± 4 | .57 |
| Abnl-BL, Abnl-2 y | 0 | NC | |
a Adjusted for baseline visual acuity.
b Five eyes that were cataract at BL and normal at 2 y were excluded.
c Normal defined as 0 or 1+; Abnormal defined as 2+, 3+, or 4+.
d P value < .001 for interaction test of type of uveitis by OCT retinal thickness category (Missing category not included).
Results
Among the 479 uveitic eyes of 255 patients enrolled in the MUST Trial, 475 eyes of 254 patients had complete visual acuity information at baseline and were assessed for the presenting visual acuity analyses. Characteristics of this population have been reported previously. Four hundred twenty-nine eyes of 231 patients had complete visual acuity at the 2-year follow-up visit (excluding 2 eyes with no light perception at baseline, which could not have changed), and were used in the incidence analyses ( Figure 1 ). At baseline, BCVA was distributed widely, from better than 20/20 to no light perception, with a skew toward better vision and a median BCVA = 20/40 ( Figure 2 ).
Factors Predictive of Reduced Mean Visual Acuity at Baseline
Factors significantly associated with differences in mean BCVA at baseline are summarized in Table 1 (a focused excerpt of a complete summary of all factors studied that is available as Supplemental Table 1 , online at www.AJO.com ). Age >50 years was associated with poorer baseline BCVA (mean BCVA 4 letters worse [-4 letters], adjusted model P = .05). Sex, race, smoking status, presence of diabetes mellitus, and presence of a systemic inflammatory disease associated with uveitis were not significantly related to baseline visual acuity status. With respect to intermediate uveitis, posterior uveitis (-6 letters, P = .02) was associated with significantly lower BCVA, whereas panuveitis (-3 letters, P = .26) and anterior and intermediate uveitis had fairly similar BCVA (-1 letter, P = .82). With respect to eyes with uveitis diagnosed fewer than 6 years before baseline, eyes with uveitis diagnosed >10 years prior to baseline had significantly worse BCVA (-10 letters, P = .005), whereas those diagnosed 6–10 years earlier had similar BCVA (-1 letter, P = .78). After adjusting for other factors (including pathologies complicating inflammation), anterior cell count and the level of vitreous haze were not significantly associated with baseline BCVA, although vitreous haze 2+ or worse tended to be associated with lower BCVA (-4 letters, P = .12). Detectable anterior chamber flare was associated with worse baseline BCVA (grade 1+: -7 letters, P = .01; grade 2+ or worse: -12 letters, P = .01).
Uveitic complications associated with decreased BCVA included cataract (-6 letters, P = .01), retinal detachment (-10 letters, P = .03), and macular thickening by OCT. Eyes that had undergone cataract surgery prior to baseline tended to have reduced mean BCVA compared with eyes with clear lenses (-5 letters, P = .07). The degree of macular thickening was associated with lower mean BCVA in a dose-response relationship (240–339 μm: -4 letters, P = .08; ≥340 μm: -16 letters, P < .001, each compared with “normal” thickness ≤239 μm). With respect to normal intraocular pressure (IOP) (8–20 mm Hg), neither low IOP (≤7 mm Hg: -8 letters, P = .36) nor high IOP (≥21 mm Hg: -5 letters, P = .12) was associated with significantly different presenting mean BCVA, although both tended to present with worse BCVA than normotensive eyes.
Loss of Visual Acuity During Follow-up
The relationship between baseline BCVA and BCVA at 2 years is plotted as Figure 3 . Among the 429 eyes with BCVA measurements at both baseline and 2 years, 38 (9%) worsened by ≥3 lines, 71 (16%) improved by ≥3 lines, and 320 (75%) had baseline and 2-year visual acuity within 3 lines of each other. Eyes with worse baseline BCVA tended to show more improvement than eyes presenting with better BCVA. Among 62 (14.5%) eyes presenting with BCVA of 20/200 or worse, only 6 (10%) experienced a loss of more than 3 lines of VA whereas 30 (48%) and 21 (34%) gained ≥3 and ≥6 lines, respectively, with a mean gain in BCVA of 20.2 letters. Among 113 (26.3%) eyes presenting with BCVA of 20/50 or worse but better than 20/200, 8 (7%) and 5 (4%) lost ≥3 and ≥6 lines, respectively, whereas 33 (30%) and 12 (11%), respectively, gained ≥3 and ≥6 lines, with an overall net mean gain of 9.9 letters. Among 254 (59.2%) eyes presenting with BCVA better than 20/50, potential for improvement was limited, but most eyes retained similar or better BCVA, with only 24 (9%) losing ≥3 lines and 12 (5%) losing ≥6 lines of BCVA, with an overall median improvement of +1.0 letters (interquartile range -5.0, +6.0).


