Purpose
To determine the normative values of the peripapillary retinal nerve fiber layer (RNFL), macular thickness, and macular volume in healthy children using spectral-domain optical coherence tomography (SD-OCT) and analyze the correlation of such values with age, refraction error, and biometric measurements.
Design
Observational case series.
Methods
This institutional study involved 107 eyes from 107 healthy pediatric patients (54 female, 53 male) with ages between 6 and 16 years. After the biometric measurements and refractive error values (in spherical equivalent) of the cases were obtained, the peripapillary RNFL, macular thickness, and macular volume values were calculated using the Spectralis OCT device.
Results
Among the study group, with an average age of 10.46 ± 2.94 years, the average axial length (AL) was 23.33 ± 0.89 mm; the average spherical equivalent (SE) value was −0.27 ± 0.99 diopter. The average peripapillary RNFL thickness was 106.45 ± 9.41 μm; the average macular thickness was 326.44 ± 14.17 μm; and the average macular volume was 0.257 ± 0.011 mm 3 . The aforementioned OCT measurements were not significantly correlated with age, SE, or AL values ( P > .05 for all).
Conclusions
This study reports SD-OCT findings among healthy pediatric cases. SD-OCT can be reliably used for pediatric patients because of its short exposure time and high degree of image resolution.
Optical coherence tomography (OCT) is a noninvasive and objective cross-sectional tissue-imaging technique, which has been widely used in recent years. Many previous studies showed that OCT can measure retinal tissue thickness at the micrometer level and successfully reflect the changes occurring. In addition, many studies demonstrated that the OCT is repeatable and reproducible. Today, the OCT technique is a very important diagnostic procedure in the detection and follow-up of many macular diseases, glaucoma, and other optic nerve diseases.
The working principles of the earliest time-domain OCT (TD-OCT) devices are described in the literature. Briefly, TD-OCTs use the scanning interferometer technique based on the reflectivity patterns, which are formed in the retinal layers, of the infrared lights directed to the eye. TD-OCT devices analyze the 2-dimensional cross-sectional images of the retina, the axial resolution of which can be 10 μm.
The reliability of the data obtained from the OCT has increased with the development of advanced OCT technologies. Spectral-domain OCT (SD-OCT) (also called Fourier-domain OCT) is a new-generation OCT technology that can provide ultrahigh image resolution at an ultrahigh rate. As distinct from the first-generation TD-OCT, SD-OCT uses a spectrometer instead of a photodetector. The depth data are obtained by analyzing the interference pattern, which is formed in the spectrum of the rays reflected from the ocular tissues. Then, the data from the spectrometer are exposed to the Fourier transformation to generate a 3-dimensional image.
The main advantages of the SD-OCT compared to the TD-OCT include ultrahigh image resolution (up to 5 μm) and the brief time required to obtain an image. Furthermore, the longer exposure time involved in the TD-OCT method forms a basis for artifact development attributable to eye movement. Thus, the SD-OCT shows promise in early detection of the pathologic changes that occur in the retinal layers and follow-up of the disease’s progression.
The reasons for childhood vision loss include glaucoma and macular diseases. Ophthalmoscopy is a subjective method for the assessment of retinal damage. In children, perimetric analysis may not always be successful. The retinal morphologic analysis performed by OCT produces results that are compatible with the functional losses determined by automated perimetry. Moreover, damage to 25% to 40% of retinal ganglion cells results in functional loss. Such damage can be detected through perimetric assessment. OCT can detect perimetric defects directly by morphologic analysis. However, because the normative database in the device software extends only to adults over 18, utility of the OCT method among children is limited. Because the OCT data are based on age, it is not appropriate to compare the findings obtained with those in the adult database. This is because the OCT measurement results are affected by age. The literature includes a few normative database studies that examine OCT findings obtained for pediatric cases. However, these studies used the TD-OCT method.
For the aforementioned reasons, the normative retinal findings for children should be determined using the new-generation SD-OCT. As far as we know, there is no previous report of normative values among children that were obtained with the most recent generation of SD-OCT. Therefore, in this study we aimed to report the normative values for SD-OCT measurements of macular thickness and volume as well as peripapillary retinal nerve fiber layer (RNFL) thickness in children.
Methods
This study, consisting of a case series of healthy pediatric patients, was performed at the Gulhane Military Medical Faculty, Department of Ophthalmology, Ankara, Turkey, from June 25, 2010 to December 24, 2010.
The study involved pediatric patients with ages between 6 and 16 years, who applied to the ophthalmology polyclinic for a refractive error examination. Detailed demographic data related to the patients were obtained from the parents. Then, each participant was subjected to an ophthalmologic examination. The visual acuity of each patient was recorded using the Snellen chart. Subjective refraction was applied to each patient in accordance with the standard protocol. Then slit-lamp biomicroscopy, dilated indirect fundus examination, and intraocular pressure measurements (using a noncontact tonometer) were conducted.
Inclusion criteria included children who were born at term (≥37 weeks gestational age) and with normal birth weight (≥2500 g) with best-corrected visual acuity over 0.8 (on the Snellen scale) for both eyes, refractive error (in spherical equivalent) within ±4.00 diopters, intraocular pressure ≤21 mm Hg in both eyes, cup-to-disc (C/D) ratio ≤0.4, and C/D ratio asymmetry ≤0.2 between the 2 eyes, and without any retinal or optic disc anomaly as determined by mydriatic fundus examination. Exclusion criteria included history of ocular abnormalities including amblyopia, strabismus, or family history of optic nerve or retinal disease.
In addition to children who did not meet any of the criteria mentioned above, the patients who would not cooperate for the SD-OCT examinations or whose parents did not provide consent were excluded from the study.
For the participants who met the study criteria and voluntarily participated in the study, the horizontal corneal diameter (white-to-white [WTW] diameter), anterior chamber depth (ACD), and axial length (AL) were also measured using the IOL Master (Carl Zeiss AG, Oberkochen, Germany), which is an optical biometer. Cyclopentolate 1% drops were administered 3 times to the eyes of patients in 5-minute intervals, and the cycloplegic refraction defect was measured using the Potec PRK-6000 (Potec Co., Ltd, Daejeon, Korea) autorefkeratometer, approximately 30 minutes after the last drop. The measurements performed by both the optical biometer and autorefkeratometer were repeated at least 3 times, and the average value of those measurements was recorded for each eye. In addition, the spherical equivalent refraction values (SE = spherical error + 50% of cylindrical error) were calculated from the average refractive error values for each eye. Then, SD-OCT analysis was performed for each case.
Optical Coherence Tomography Measurements
The Spectralis OCT device (software version 5.1.3.0; Heidelberg Engineering, Dossenheim, Germany) was used for the SD-OCT assessment. The Spectralis OCT has an acquisition rate of 40 000 A-scans per second. It uses a dual-beam SD-OCT and a confocal scanning laser ophthalmoscope (CSLO) that uses a scanning laser diode with a wavelength of 870 nm and an infrared reference image simultaneously to provide images of ocular structures. The instrument incorporates a real-time eye tracking system that couples CSLO and SD-OCT scanners to adjust for eye motion.
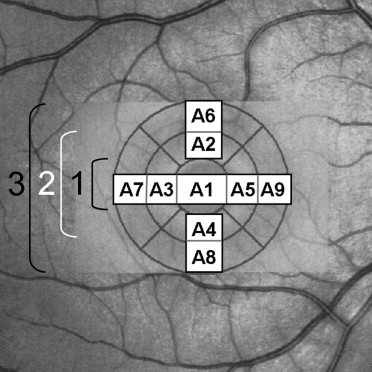
The SD-OCT assessments of all children involved in the study were performed by the same experienced technician when the pupil was dilated. The macula and peripapillary RNFL examinations were performed using an internal fixator. During the assessments, macular thickness and volume analysis (resolution mode: high speed; scan angle: 15 degrees; size X: 384 pixels [4.4 mm]; size Z: 496 pixels [1.9 mm]; scaling X: 11.44 μm/pixel; scaling Z: 3.87 μm/pixel; number of B-scans: 13; pattern size: 15 × 10 degrees [4.4 × 2.9 mm], distance between B-scans: 244 μm) and peripapillary RNFL thickness analysis (resolution mode: high speed; circle diameter: 3.5 mm; size X: 768 pixels [11 mm]; size Z: 496 pixels [1.9 mm]; scaling X: 14.38 μm/pixel; scaling Z: 3.87 μm/pixel) were used. The results obtained from the macular scan were classified by region as shown in the Figure . The peripapillary RNFL thickness parameters that were automatically calculated by the SD-OCT device and divided into regions included temporal quadrant thickness (90 degrees), temporal superior quadrant thickness (45 degrees), nasal superior quadrant thickness (45 degrees), nasal quadrant thickness (90 degrees), nasal inferior quadrant thickness (45 degrees), temporal inferior quadrant thickness (45 degrees), and average thickness (360 degrees). After the exposures, the noncentered scans and the scans with signal strength <15 dB were excluded from the study.
Statistical Analysis
The measurement results obtained from the SD-OCT were expressed as mean ± standard deviation. Statistical analyses were performed using SPSS 13.0.1 (SPSS, Chicago, Illinois, USA; license no: 9069728, KTU, Trabzon, Turkey). Data normality was assessed using the Kolmogorov-Smirnov test. The measurement differences between the male and female children were evaluated by the independent samples t test if a normal distribution was present or the Mann-Whitney test otherwise. With respect to the correlation analysis, the Pearson method was used when a normal distribution was observed; otherwise, the Spearman method was used. P < .05 was considered significant.
Results
Study Group
The examination findings for 132 children among a total of 162 white children examined during the study met the study criteria. Twenty-four of those 132 patients were excluded because of failure to obtain parental consent, and 1 patient was excluded because the patient did not cooperate with SD-OCT measurements. The average age of all 107 children involved in the study (54 [50.47%] female and 53 [49.53%] male children) was 10.46 ± 2.94 years (range, 6-16). The median age of the group was 10 (age distribution of the group: 6-8 years [n = 32] 29.9%; 9-12 years [n = 46] 43%; 13-16 years [n = 29] 27.1%). In terms of age, there was no statistically significant difference between the female (10.83 ± 3.11 [range, 6-16]) and male (10.08 ± 2.73 [range, 6-16]) children ( P = .183).
Measurement Results
Table 1 shows the horizontal corneal diameter (WTW), ACD, AL, and SE values for the randomly selected eyes of all children included in the study.
| Measurement | Female (n = 54) | Male (n = 53) | P Value b | Total (n = 107) |
|---|---|---|---|---|
| Horizontal corneal diameter (mm) | 12.11 ± 0.33 (11.3–12.7) | 12.33 ± 0.42 (11.3–13.2) | .004 | 12.22 ± 0.39 (11.3–13.2) |
| Anterior chamber depth (mm) | 3.47 ± 0.28 (2.38–4.06) | 3.59 ± 0.29 (2.53–4.12) | .037 | 3.53 ± 0.29 (2.38–4.12) |
| Axial length(mm) | 23.14 ± 0.94 (21.23–26.01) | 23.53 ± 0.81 (21.64–25.05) | .025 | 23.33 ± 0.89 (21.23–26.01) |
| Spherical equivalent (diopters) | −0.41 ± 1.04 (−3.00–1.5) | −0.13 ± 0.95 (−2.38–2.25) | .153 | −0.27 ± 0.99 (−3.00–2.25) |
b Independent samples t test. Bold font indicates significant P values.
In the correlation analysis, no significant correlation was found between the ages of the patients and the peripapillary RNFL thickness ( P > .05 for all), ACD (r = 0.098, P = .314), and WTW values (r = 0.078, P = .424). However, there was a significant positive correlation between the ages of the patients and the AL values (r = 0.259, P = .007).
In the correlation analysis, a significant negative correlation was found between the SE values of the patients and the age (r = −0.197, P = .045) and AL values (r = −0.456, P < .0001). No significant correlation was found between the SE values and the ACD (r = −0.192, P = .05) and WTW (r = −0.064, P = .52) values.
In the correlation analysis, there was a significant positive correlation between the ACD values of the patients and the AL values (r = 0.291, P = .002) and WTW values (r = 0.302, P = .002). Also, there was a significant correlation between the AL and WTW values (r = 0.462, P < .0001).
The macular thickness analysis, macular volume analysis, and peripapillary RNFL thickness analysis obtained by the SD-OCT are given in Table 2 , Table 3 , and Table 4 , respectively.
| Area | Female (n = 54) | Male (n = 53) | P Value b | Total (n = 107) |
|---|---|---|---|---|
| A1 | 255.15 ± 16.22 (233–298) | 262.11 ± 17.6 (214–301) | .036 | 258.6 ± 17.2 (214–301) |
| A2 | 333.13 ± 17.55 (292–372) | 338.26 ± 15.69 (306–364) | .114 | 335.67 ± 16.78 (292–372) |
| A3 | 317.78 ± 15.2 (289–360) | 323.94 ± 14.86 (288–355) | .036 | 320.83 ± 15.28 (288–360) |
| A4 | 327.33 ± 17.44 (289–381) | 334.6 ± 15.83 (296–370) | .026 | 330.93 ± 16.98 (289–381) |
| A5 | 321.07 ± 18.95 (283–377) | 329.42 ± 17.1 (295–363) | .019 | 325.21 ± 18.45 (283–377) |
| A6 | 343.17 ± 15.31 (310–382) | 345.49 ± 15.99 (300–371) | .444 | 344.32 ± 15.62 (300–382) |
| A7 | 329.28 ± 14.82 (293–367) | 333.47 ± 13.67 (290–359) | .131 | 331.36 ± 14.35 (290–367) |
| A8 | 341.69 ± 16.42 (307–381) | 344.55 ± 14.95 (306–370) | .348 | 343.1 ± 15.7 (306–381) |
| A9 | 346.13 ± 15.53 (314–381) | 349.75 ± 15.7 (309–375) | .233 | 347.93 ± 15.65 (309–381) |
| Total | 323.86 ± 14.57 (294.44–365.11) | 329.07 ± 13.37 (294.44–356.78) | .057 | 326.44 ± 14.17 (294.44–365.11) |
| Foveal center | 209.35 ± 11.69 (190–239) | 213.47 ± 12.53 (190–241) | .082 | 211.39 ± 12.23 (190–241) |
a Mean ± SD (normal range), μm.
b Independent samples t test. Bold font indicates significant P values.
| Area | Female (n = 54) | Male (n = 53) | P Value b | Total (n = 107) |
|---|---|---|---|---|
| A1 | 0.199 ± 0.012 (0.18–0.23) | 0.207 ± 0.015 (0.17–0.24) | .004 | 0.203 ± 0.014 (0.17–0.24) |
| A2 | 0.196 ± 0.011 (0.17–0.22) | 0.199 ± 0.009 (0.18–0.21) | .134 | 0.198 ± 0.01 (0.17–0.22) |
| A3 | 0.187 ± 0.009 (0.17–0.21) | 0.192 ± 0.01 (0.17–0.21) | .005 | 0.189 ± 0.01 (0.17–0.21) |
| A4 | 0.193 ± 0.01 (0.17–0.22) | 0.197 ± 0.01 (0.17–0.22) | .012 | 0.195 ± 0.01 (0.17–0.22) |
| A5 | 0.19 ± 0.011 (0.17–0.22) | 0.194 ± 0.01 (0.17–0.21) | .061 | 0.192 ± 0.011 (0.17–0.22) |
| A6 | 0.335 ± 0.015 (0.3–0.37) | 0.337 ± 0.016 (0.29–0.36) | .510 | 0.336 ± 0.015 (0.29–0.37) |
| A7 | 0.324 ± 0.015 (0.29–0.36) | 0.327 ± 0.014 (0.28–0.35) | .124 | 0.325 ± 0.014 (0.28–0.36) |
| A8 | 0.332 ± 0.016 (0.3–0.36) | 0.334 ± 0.015 (0.3–0.36) | .544 | 0.333 ± 0.016 (0.3–0.36) |
| A9 | 0.339 ± 0.015 (0.31–0.37) | 0.343 ± 0.015 (0.3–0.37) | .102 | 0.341 ± 0.015 (0.3–0.37) |
| Average | 0.255 ± 0.011 (0.23–0.28) | 0.259 ± 0.01 (0.23–0.28) | .063 | 0.257 ± 0.011 (0.23–0.28) |
a Mean ± SD (normal range), mm 3 .
b Mann-Whitney U test. Bold font indicates significant P values.
| Area | Female (n = 54) | Male (n = 53) | P Value b | Total (n = 107) |
|---|---|---|---|---|
| Temporal | 75.74 ± 10.71 (53–106) | 72.85 ± 7.8 (60–94) | .114 | 74.31 ± 9.45 (53–106) |
| Temporal superior | 141.74 ± 18.3 (105–191) | 136.15 ± 16.5 (104–170) | .100 | 138.97 ± 17.58 (104–191) |
| Nasal superior | 104.96 ± 16.48 (78–145) | 100.68 ± 15.26 (78–140) | .166 | 102.84 ± 15.96 (78–145) |
| Nasal | 71.93 ± 10.32 (49–102) | 71.15 ± 9.8 (51–99) | .691 | 71.54 ± 10.03 (49–102) |
| Nasal inferior | 106.37 ± 16.18 (82–156) | 106.43 ± 21.89 (78–162) | .986 | 106.4 ± 19.13 (78–162) |
| Temporal inferior | 147.98 ± 17.05 (111–183) | 141.23 ± 16.74 (110–175) | .041 | 144.64 ± 17.16 (110–183) |
| Average | 108.12 ± 9.47 (83.33–141.17) | 104.75 ± 9.13 (84.17–123.5) | .096 | 106.45 ± 9.41 (83.33–141.17) |
Stay updated, free articles. Join our Telegram channel

Full access? Get Clinical Tree


