Purpose
To determine the repeatability of automated retinal and choroidal thickness measurements with swept-source optical coherence tomography (SS OCT) and the frequency and type of scan artifacts.
Design
Prospective evaluation of new diagnostic technology.
Methods
Thirty healthy subjects were recruited prospectively and underwent imaging with a prototype SS OCT instrument. Undilated scans of 54 eyes of 27 subjects (mean age, 35.1 ± 9.3 years) were obtained. Each subject had 4 SS OCT protocols repeated 3 times: 3-dimensional (3D) 6 × 6-mm raster scan of the optic disc and macula, radial, and line scan. Automated measurements were obtained through segmentation software. Interscan repeatability was assessed by intraclass correlation coefficients (ICCs).
Results
ICCs for choroidal measurements were 0.92, 0.98, 0.80, and 0.91, respectively, for 3D macula, 3D optic disc, radial, and line scans. ICCs for retinal measurements were 0.39, 0.49, 0.71, and 0.69, respectively. Artifacts were present in up to 9% scans. Signal loss because of blinking was the most common artifact on 3D scans (optic disc scan, 7%; macula scan, 9%), whereas segmentation failure occurred in 4% of radial and 3% of line scans. When scans with image artifacts were excluded, ICCs for choroidal thickness increased to 0.95, 0.99, 0.87, and 0.93 for 3D macula, 3D optic disc, radial, and line scans, respectively. ICCs for retinal thickness increased to 0.88, 0.83, 0.89, and 0.76, respectively.
Conclusions
Improved repeatability of automated choroidal and retinal thickness measurements was found with the SS OCT after correction of scan artifacts. Recognition of scan artifacts is important for correct interpretation of SS OCT measurements.
The introduction of optical coherence tomography (OCT) approximately 2 decades ago has contributed to better understanding and management of glaucoma. In recent years, OCT technology has undergone several iterations with the incorporation of spectral-domain (SD) imaging that offers significant advantages over the earlier time-domain techniques. These advances have led to considerable improvements in the ability to visualize individual layers of the retina in near-histologic detail, whereas deeper ocular structures such as the choroid have remained difficult to image.
The choroid, a heavily vascularized tissue between the retina and sclera, plays a central role in ocular metabolism, volume regulation, and temperature control. Abnormalities of the choroid have been implicated in major ophthalmic conditions, most importantly in the pathophysiologic features of retinal disease. Changes in choroidal structure and function also have been hypothesized to contribute to optic nerve damage in glaucoma. Until recently, postmortem histologic studies and ultrasonography were the major source of knowledge on choroidal anatomy and physiology. An important source for uncertainty about the cause-and-effect relationship of choroidal changes and disease processes arises from the lack of precision and effect of artifacts on these methods.
The introduction of enhanced depth imaging (EDI) protocols, in which an inverted image is obtained by closer placement of the SD OCT instrument to the eye, has reduced scattering effects and depth-dependent reduction in sensitivity. However in EDI OCT, improved choroidal visualization is achieved at the expense of reduced resolution of retinal layers.
Recently, a new generation of high-penetration OCTs has been introduced that may have the potential to improve the understanding of the choroid further. These swept-source (SS) OCTs use a long-wavelength light source of 1050 nm and a tunable laser, the wavelength of which can be altered in a controlled manner. SS OCT systems have the potential for superior and simultaneous imaging of the retina and choroid because of the longer wavelength, potentially higher detection efficiency, and lower dispersion. In the absence of automated segmentation software for SS OCT systems, previous investigators have used manual (mostly single-point) measurement techniques using in-built calibers or modification of retinal segmentation lines to evaluate choroidal thickness. Given the high anatomic variability of the choroid, these are impractical for clinical use, are highly dependent on location of measurement, and may be subject to further operator effects. We recently described the use of automated segmentation for choroidal measurements using SS OCT.
Before a new device can be accepted for use in clinical practice, its repeatability should be evaluated. Estimating repeatability is a prerequisite for quantifying an instrument’s ability to separate real change from noise, as in the monitoring of response to treatment in retinal conditions and progression in glaucoma. Studies evaluating the repeatability and reproducibility of choroidal measurements with SS OCT in healthy Japanese subjects have used different image acquisition protocols and manual segmentation techniques, which may explain notable disparities between choroidal thickness measurements among them. Artifacts represent another major concern for every imaging technique. However, none of these studies have reported the frequency and effect of image artifacts on SS OCT measurements.
The aim of the current study was to evaluate the repeatability of measurements of retinal and choroidal thickness using a prototype SS OCT instrument in healthy participants. For this purpose, built-in automated segmentation of choroidal borders was applied to 4 different image acquisition protocols. In addition, we sought to study the effect of image artifacts on SS OCT measurements.
Methods
This prospective study was compliant with Health Insurance Portability and Accountability Act regulations and adhered to the Declaration of Helsinki and all federal or state laws. It was approved by the University of California, San Diego, Human Research Protections Program (institutional review board protocol no. 111356). This study was registered at http://clinicaltrials.gov (identification no. NCT01507584 ). Written informed consent was obtained from all participating subjects.
Subjects
Thirty healthy subjects were recruited from among university employees and their families at the Shiley Eye Center, University of California, San Diego. Subjects with current ocular disease, previous ocular surgery, myopia of more than 5 diopters, or hyperopia of more than 3 diopters were excluded. All subjects had normal visual field testing results (using Statpac II, Swedish interactive thresholding algorithm 24-2, Zeiss-Humphrey Field Analyzer; Carl Zeiss Meditec, Inc, Dublin, California, USA), an IOP of 21 mmHg or less on Goldmann applanation tonometry, and no clinical signs of eye disease on slit-lamp anterior segment and fundus examination.
Swept-Source Optical Coherence Tomography
Images of the optic disc and the macular region were obtained using a prototype SS OCT system (Topcon, Inc, Tokyo, Japan). The SS OCT has an acquisition rate of 100,000 A-scans per second operated at the 1-μm wavelength region. This instrument uses a wavelength-sweeping laser with a tuning range of approximately 100 nm as light source and has a center wavelength of 1050 nm, yielding an 8-μm axial resolution in tissue. These features allow penetration of deeper tissue through the retinal pigment epithelium into the choroid. The device has been described in more detail elsewhere.
Four different scan protocols were used for evaluation of choroidal thickness. First, a 3-dimensional (3D) imaging data set was acquired with a 6 × 6-mm raster scan centered on the optic disc (optic disc protocol) composed of 256 B-scans, each consisting of 256 A-scans (total, 65,536 axial scans/volume) with an acquisition time of approximately 0.66 seconds. The resulting scan provides a 3D image of the optic disc and surrounding area. Second, the same 3D imaging data set was obtained covering an area of 6 × 6-mm centered on the fovea (macula protocol). Third, a radial scan protocol centered on the optic disc (12 lines, each composed of 32 B-scans, with each B-scan composed of 1024 A-scans) with an acquisition time of 4 seconds was obtained ( Supplemental Figure 1 , available at AJO.com ). Fourth, a 12-mm horizontal line scan protocol, centered between the optic disc and the fovea and composed of 1024 A-scans for each of 96 B-scans, was obtained (acquisition time, 1 second; Supplemental Figure 2 , available at AJO.com ).
All scan protocols were acquired in the described order. Each scan protocol was repeated 3 times consecutively on the same visit. Participant and device were repositioned after each scan. The choroidal reference position was used for all scans. The centering of scans was achieved by internal fixation and confirmed by a fundus camera integrated in the instrument. Two experienced examiners (A.J.T., N.M.) scanned all participants. Measurements of both eyes of each study participant were obtained through undilated pupils. To be included in the analysis, all images had to have an image quality score of 45 (of 160) or more, according to manufacturer recommendation. The detailed image quality calculation is generated by a proprietary algorithm that produces an image quality score in the range of 0 to 160, which corresponds to an estimate of the signal-to-noise ratio specifically for the retinal signal. A score of 160 indicates that the all-retinal signal is of greater intensity than the estimated background, whereas a score of 0 indicates that the all-retinal signal is indistinguishable from the estimated background signal. In a 3D scan, only a single score is assigned, representing the average of all individual frames’ image quality scores.
Classification of Artifacts
The following sources of artifacts were defined: motion artifact, signal loss resulting from blinking, and segmentation failure. Quality assurance checks were carried out at the conclusion of the study by an independent grader not involved in the image acquisition process. The number of scans with an artifact, the type of the artifact, and whether the artifact affected the calculated retinal and choroidal measurements were recorded.
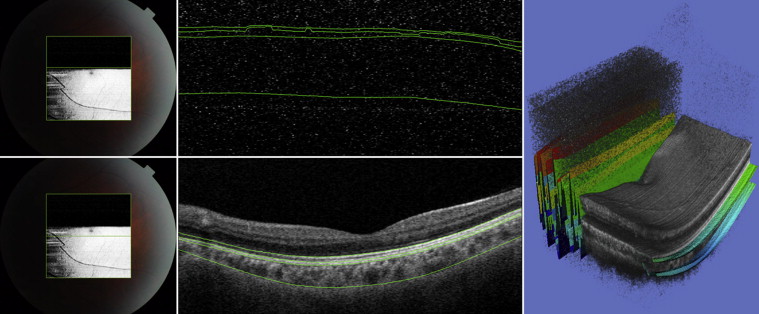
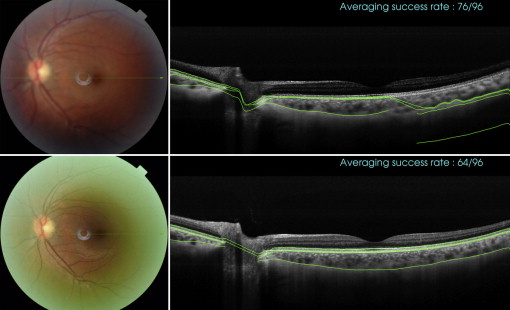
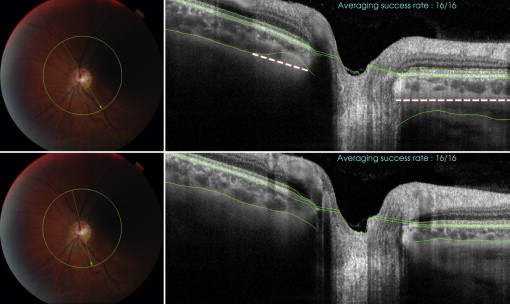
Motion artifacts were defined as displacement of major retinal vessels by more than 1 vessel diameter ( Figure 1 ). Scans with blink-related signal losses were excluded automatically from the averaging process for the line scan and radial scan protocols. Information on the averaging success is available during image acquisition. In the present study, only images with a minimum 50% averaging success were considered good quality and were saved during acquisition. The used averaging technique relies on correlation statistics to determine whether to accept a newly registered image into the composite average image. A registration operation that results in a relatively low interimage correlation is rejected, and those poorly matched image frames are not accepted into the final composite average. The displayed success rate information serves as an indication of the number of the number of frames that were included in the final composite average image. With the 3D scan protocols, blink-related signal loss is not readily visible during image acquisition ( Figure 2 ). Therefore, postacquisition quality controls were performed, and scans with a signal loss of more than 10% (by manual measurement) of the scan area were excluded from the analysis. Failure of a segmentation line was defined when corroboration with visual inspection differed in more than 25% of the 2D scan area (3D scan protocol), in more than 25% of the scan area in more than 25% of scan lines (eg, fewer than 3 lines, radial scan protocol), and in more than 25% of the line area (line scan protocol; Figure 3 ). These cutoffs were chosen arbitrarily; however, other investigators have used similar cutoffs (eg, 85% concordance between manual and automated identification of posterior surface). Post hoc analysis was conducted to evaluate whether reproducibility results changed significantly when all scans with the presence of blink artifacts (including less than 10%) were excluded.
Choroidal and Retinal Thickness Measurement
Segmentation data were produced using the SS OCT segmentation software (version 1.43) and exported using the manufacturer’s OCT batch (version 4.3.0.118) utility. The resulting data files consisted of the boundary depth information for 9 layers for each A-scan, with the values for each B-scan in a separate file. A script was developed that combined the B-scans of each examination into a single thickness file—converted from pixel space to micrometers—and, using the boundary depth of the first layer, computed the depth thicknesses of each subsequent layer for each B-scan. The thickness information then was processed using MATLAB (version 2012a; MathWorks, Inc, Natick, Massachusetts, USA) to compute the average thickness for each B-scan. Additionally, for each radial scan, the average thickness over all 12 B-scans was calculated for each layer. For each 3D scan, the average thickness and the total volume over the entire scan area was calculated for each layer. The SS OCT segmentation software outputs 0 for the boundary depths when scanning over the optic disc. We used this information to exclude the optic disc region in the average thickness calculations. Automated measurements of choroidal thickness and choroidal volume thus were obtained for all subjects. Supplemental Figure 3 (available at AJO.com ) demonstrates segmentation of retina and choroid at the optic disc.
Statistical Analysis
Data are presented as means and standard deviations. The repeatability within each scan protocol was assessed using 3 repeated measurements. Interscan repeatability was evaluated by computing intraclass correlation coefficients (ICC) and 95% confidence intervals. Because measurements from both eyes of the same subject are likely to correlate, statistical methods are required that account for the fact that both eyes of an individual were included in the analysis. For this purpose, we used generalized estimating equations with robust standard errors (Huber-White sandwich variance estimator) to adjust for potential correlations. All tests were 2-sided, and a P value of less than .05 was considered statistically significant. All statistical analyses were performed with commercially available software (Stata version 10.0; StataCorp, College Station, Texas, USA).
Results
This prospective study recruited a total of 60 eyes of 30 subjects. No 3D scans could be obtained for 3 subjects for the following reasons: inability to obtain good quality scans because of small pupil (n = 1) and data lost because of device failure (n = 2). In addition, incomplete 3D data sets were obtained for some subjects, reducing the final data set used for analysis to 54 eyes of 27 subjects for the radial scan, 54 eyes of 27 subjects for the line scan, 50 eyes of 27 subjects for the 3D optic disc, and 49 eyes of 27 subjects for the 3D macula scan protocol. Therefore, complete data sets for all 4 scan protocols were obtained in 49 eyes. The mean (± standard deviation) age was 36.6 ± 10.4 years (range, 21 to 51 years) with 14 men and 13 women. Subjects were of white (n = 17), Hispanic (n = 4), Asian (n = 3), and other (n = 3) ancestry.
The mean retinal thicknesses were 307.9 ± 19.2 μm, 302.3 ± 15.5 μm, 267.0 ± 22.0 μm, and 252.7 ± 23.7 μm with the 3D macula scan, 3D optic disc scan, radial scan, and line scan protocol, respectively. The mean choroidal thicknesses were 219.3 ± 47.9 μm (3D macula), 177.2 ± 53.7 μm (3D optic disc), 94.0 ± 64.2 μm (radial), and 191.8 ± 61.8 μm (line). Data on retinal and choroidal thickness measurements as well as ICCs are summarized in Tables 1, 2, 3, and 4 .
| Parameters | Overall Mean ± SD | ICC (95% CI) |
|---|---|---|
| RNFL thickness (μm) | 50.2 ± 10.7 | 0.92 (0.90 to 0.95) |
| GCL thickness (μm) | 37.1 ± 3.4 | 0.79 (0.70 to 0.86) |
| GCC thickness (μm) | 31.4 ± 3.1 | 0.78 (0.70 to 0.84) |
| OPL thickness (μm) | 28.8 ± 2.0 | 0.92 (0.89 to 0.94) |
| ELM thickness (μm) | 75.4 ± 5.3 | 0.99 (0.98 to 0.99) |
| IS/OS junction thickness (μm) | 20.8 ± 1.4 | 0.82 (0.75 to 0.87) |
| RPE thickness (μm) | 40.1 ± 3.5 | 0.95 (0.94 to 0.96) |
| BM thickness (μm) | 24.1 ± 2.8 | 0.52 (0.38 to 0.69) |
| Retina thickness (μm) | 307.9 ± 19.2 | 0.88 (0.85 to 0.91) |
| Choroidal thickness (μm) | 219.3 ± 47.9 | 0.95 (0.93 to 0.96) |
| Choroidal volume (mm 3 ) | 7.87 ± 1.72 | 0.95 (0.93 to 0.96) |
| Parameters | Overall Mean ± SD | ICC (95% CI) |
|---|---|---|
| RNFL thickness (μm) | 87.6 ± 7.8 | 0.87 (0.80 to 0.90) |
| GCL thickness (μm) | 22.6 ± 2.0 | 0.67 (0.58 to 0.77) |
| GCC thickness (μm) | 23.0 ± 2.8 | 0.90 (0.82 to 0.87) |
| OPL thickness (μm) | 23.0 ± 2.8 | 0.86 (0.80 to 0.89) |
| ELM thickness (μm) | 65.2 ± 5.2 | 0.92 (0.89 to 0.94) |
| IS/OS junction thickness (μm) | 19.7 ± 2.4 | 0.82 (0.73 to 0.88) |
| RPE thickness (μm) | 36.1 ± 6.6 | 0.93 (0.91 to 0.95) |
| BM thickness (μm) | 24.7 ± 1.9 | 0.93 (0.90 to 0.95) |
| All retina thickness (μm) | 302.3 ± 15.5 | 0.84 (0.78 to 0.87) |
| Choroidal thickness (μm) | 177.2 ± 53.7 | 0.99 (0.98 to 0.99) |
| Choroidal volume (mm 3 ) | 6.03 ± 1.85 | 0.99 (0.98 to 0.99) |
| Parameters | Overall Mean ± SD | ICC (95% CI) |
|---|---|---|
| RNFL thickness (μm) | 56.2 ± 35.4 | 0.99 (0.98 to 1.0) |
| GCL thickness (μm) | 42.0 ± 30.3 | 0.99 (0.98 to 1.0) |
| GCC thickness (μm) | 19.3 ± 2.7 | 0.71 (0.60.0.79) |
| OPL thickness (μm) | 19.3 ± 2.7 | 0.45 (0.31 to 0.64) |
| ELM thickness (μm) | 39.4 ± 16.4 | 0.98 (0.97 to 0.1.0) |
| IS/OS junction thickness (μm) | 29.1 ± 18.6 | 0.99 (0.98 to 1.0) |
| RPE thickness (μm) | 23.5 ± 6.6 | 0.97 (0.96 to 0.99) |
| BM thickness (μm) | 23.8 ± 4.5 | 0.88 (0.83 to 0.92) |
| All retina thickness (μm) | 252.7 ± 23.7 | 0.89 (0.85 to 0.92) |
| Choroidal thickness (μm) | 94.2 ± 64.2 | 0.87 (0.83 to 0.91) |
| Parameters | Overall Mean ± SD | ICC (95% CI) |
|---|---|---|
| RNFL thickness (μm) | 32.6 ± 10.8 | 0.73 (0.62 to 0.91) |
| GCL thickness (μm) | 32.3 ± 4.6 | 0.56 (0.39 to 0.76) |
| GCC thickness (μm) | 30.1 ± 4.7 | 0.55 (0.38 to 0.72) |
| OPL thickness (μm) | 23.8 ± 2.3 | 0.67 (0.53 to 0.79) |
| ELM thickness (μm) | 71.1 ± 6.0 | 0.81 (0.73 to 0.87) |
| IS/OS junction thickness (μm) | 18.9 ± 2.4 | 0.58 (0.41 to 0.75) |
| RPE thickness (μm) | 34.1 ± 4.3 | 0.76 (0.66 to 0.84) |
| BM thickness (μm) | 24.1 ± 3.5 | 0.54 (0.38 to 0.69) |
| All retina thickness (μm) | 268.5 ± 22.5 | 0.76 (0.64 to 0.86) |
| Choroidal thickness (μm) | 195.8 ± 61.9 | 0.93 (0.91 to 0.95) |
Stay updated, free articles. Join our Telegram channel

Full access? Get Clinical Tree


