Purpose
To compare the corneal microstructure in patients with manifest keratoconus (KCN), subclinical KCN, and topographically normal relatives of patients with KCN and in healthy controls.
Design
Prospective and cross-sectional study.
Methods
We enrolled 145 subjects in the study. The participants were divided into 4 groups, based on clinical and topographical evaluation: the manifest KCN group (n = 30), the subclinical KCN group (n = 32), the KCN relatives group (n = 53), and the control group (n = 30). Corneal microstructure was assessed by corneal in vivo confocal microscopy in all of the individuals. Mean outcome measures were basal epithelial cell density, endothelial cell density, anterior keratocyte density, posterior keratocyte density, sub-basal nerve density, sub-basal nerve diameter, and stromal nerve diameter.
Results
The mean basal epithelial cell density, endothelial cell density, and sub-basal nerve diameter were not significantly different among the 4 groups ( P = 0.057, P = 0.592, and P = 0.393, respectively). The mean anterior and posterior stromal keratocyte densities were significantly lower in the manifest group, in the subclinical group, and in the relatives group when compared with the control group (for both parameters; P < 0.001, P < 0.001, and P < 0.001, respectively). The mean stromal nerve diameter in the manifest group, subclinical group, and relatives group was significantly higher than in the control group ( P = 0.001, P = 0.049, and P = 0.004, respectively).
Conclusion
The anterior and posterior stromal keratocyte densities were statistically lower and stromal nerve diameter was statistically higher in patients with manifest KCN, subclinical KCN, and topographically normal KCN relatives compared with controls. Confocal microscopy may be useful for the determination of early corneal microstructural changes before manifestation of typical or subtle topographic signs.
Keratoconus (KCN) is an asymmetric, bilateral, progressive ectatic disease of the cornea that is a well-accepted contraindication to refractive surgery, particularly laser in situ keratomileusis (LASIK). Reported risk factors for KCN include eye rubbing, the presence of systemic diseases (eg, obstructive sleep apnea) and congenital malformation (eg, Marfan syndrome), floppy eyelid syndrome, allergies, and eczema, as well as family history.
Corneal topography is an essential tool for confirming a diagnosis of KCN. Moderate and advanced KCN is easily diagnosed using corneal topography in combination with biomicroscopic and retinoscopic examination. On the other hand, the preclinical forms of KCN may be missed when using even the most sophisticated topographic and tomographic analysis. Previous studies have reported that corneal topographic abnormalities may be significative for early KCN in asymptomatic family members of patients with KCN. Also, some KCN relatives with normal corneal topography may have keratoconus diagnoses, or subclinical KCN, or abnormal corneal topographical findings in the future.
The detection of early forms of KCN is essential in the screening of patients before keratorefractive surgery to avoid post-LASIK ectasia. Although currently, detection of these cases using various topographic and tomographic analyses and also biomechanical evaluation have improved, there continue to be new reports of post-LASIK ectasia.
Confocal microscopy studies have demonstrated significant morphologic alterations inpatients with manifest KCN. However, no studies have been conducted on confocal microscopy findings in patients with early-stage KCN or in subjects who had risk factors for KCN such as family history. We hypothesized that confocal microscopy could be used to differentiate early-stage KCN from healthy corneas before manifestation of typical topographic signs. The current study evaluated the microstructural changes of the cornea in patients with manifest KCN, in subclinical KCN, and in topographically normal KCN relatives using in vivo confocal microscopy. We also compared the confocal microscopy findings in these subjects with age-matched healthy individuals.
Patients and Methods
Study Population and Design
This prospective, cross-sectional and comparative study was performed in the Beyoglu Eye Research and Education Hospital. The study followed the tenets of the Declaration of Helsinki and was approved by the ethics committee of the Beyoglu Eye Research and Education Hospital. All participants received oral and written information about the study, and each participant provided written informed consent. For participants younger than 18 years, a parent provided written informed consent. The participants were divided into 4 groups based on clinical and topographic evaluation as follows:
Manifest Group
Diagnosis of manifest KCN was based on the presence of at least 1 keratoconus sign (corneal stromal thinning, Vogt striae, Fleischer ring, scissoring of the red reflex, or oil droplet sign identified by retinoscopy) and the presence of at least 1 topographic finding (an increased area of corneal power surrounded by concentric areas of decreasing power, inferior-superior power asymmetry, an inferior-superior dioptric asymmetry difference greater than 1.9 diopters (D), and skewing of the steepest radial axes above and below the horizontal meridian).
Subclinical Group
Diagnosis of subclinical KCN is made using criteria defined previously, including corneal topography with abnormal localized steepening or an asymmetric bow-tie pattern, a normal-appearing cornea on biomicroscopy, and at least 1 of the following signs: steep keratometric curvature greater than 47.0 D, oblique cylinder greater than 1.50 D, an inferior-superior dioptric asymmetry difference in 1.4 to 1.9 D gradient, central corneal thickness less than 500 mm, manifest keratoconus in the fellow eye, and an elevation of the posterior corneal surface.
Relatives Group
The relatives group consisted of the topographically normal first-degree relatives (sister or brother) of the patients with KCN.
Control Group
The control group consisted of healthy individuals without any risk factor for KCN such as family history. Controls were recruited from among the hospital staff and their families.
Exclusion criteria were as follows: a history of ocular trauma, any previous ocular surgery, use of any systemic or ocular medications, coexisting corneal pathology, keratoconic eyes with corneal hydrops or scarring, contact lens wear, or systemic disease that may affect the cornea.
Examination Protocol and Study Measurement
Each participant underwent a comprehensive ophthalmic examination, including a review of medical history, corrected distance visual acuity, slit-lamp microscopy, and a funduscopic examination. The corneal topographic analysis was performed using the Scheimpflug camera with a Placido disk topographer (Sirius, Costruzione Strumenti Oftalmici, Italy) by an experienced technician.
In Vivo Confocal Microscopy
All corneal measurements were performed using scanning slit confocal microscopy (ConfoScan 4, Nidek Technologies, Padova, Italy). After the administration of 0.5% proparacaine, 1 drop of an immersion gel was placed on the tip of the objective lens. The patients were told to fixate on a target, and the tip of the lens was calibrated to view the central cornea. The objective lens was moved toward the eye until the gel contacted the cornea. The full automated mode was used to complete the alignment and landing of the z ring on the corneal surface. The objective lens automatically scanned and captured the images from the posterior to the anterior cornea. The smallest step distance (5 μm) between frames was chosen and the CS4 (z ring) captured 350 frames in each measurement, with at least 2 complete scans of the cornea. The dimension of each frame was 387 × 516 um. Each 5-um-thick frame was analyzed, and the cells were marked. The best stromal image right after the basal epithelial cell layer was defined as the anterior stroma, and the best stromal image just before Descemet membrane was defined as the posterior stroma. Calculations of basal epithelial cell density (cells/mm 2 ) as well as anterior and posterior keratocyte density (cells/mm 2 ) were performed manually. Endothelial cell density (cells/mm 2 ) was calculated automatically by computer software. Nerve density (μm/mm 2 ) was assessed by measuring the total length of the nerve fibers. The thickest stromal nerve was selected from among all stromal images in each group for evaluating stromal nerve thickness. Nerve thicknesses were measured at 3 different points along the nerve paths, and they were calculated by averaging the 3 measurements. The confocal images were selected and analyzed by the same corneal specialist (E.B.O.), and the observer was masked to study groups. The best-focused 3 images for each layer were averaged for analysis.
Data Analysis
All statistical analyses were performed using SPSS 10.0 (SPSS, Chicago, IL). The 1-sample Kolmogorov-Smirnov test was used to evaluate the distribution characteristics of variables. The 1-way ANOVA test was used to compare variables between groups. The Bonferroni method was used for adjustment so as to make multiple comparisons. Differences were considered statistically significant for P values less than 0.05.
Results
Demographic Profiles and Baseline Clinical Characteristics
The study included 145 eyes of 145 subjects: 30 subjects in the manifest group, 32 subjects in the subclinical group, 53 subjects in the relative group, and 30 subjects in the control group. The demographic and topographic features of the 4 groups of subjects are shown in Table 1 . No statistically significant differences were observed among the groups in terms of age and gender distributions.
| Manifest | Subclinical | Relatives | Control | P Value | |
|---|---|---|---|---|---|
| No of eyes/patients | 30/30 | 32/32 | 53/53 | 30/30 | |
| Sex | 0.849 a | ||||
| Female/male | 17/13 | 15/17 | 27/26 | 14/16 | |
| Age, years | |||||
| Mean ± SD | 24 ± 7 | 28 ± 11 | 26 ± 12 | 27 ± 8 | 0.574 b |
| Range | 13–38 | 13–43 | 11–53 | 15–45 | |
| CCT, μm | |||||
| Mean ± SD | 420 ± 36 | 481 ± 23 | 524 ± 31 | 561 ± 33 | <0.001 b |
| Range | 323–469 | 438–522 | 467–598 | 519–656 | |
| K1, D | |||||
| Mean ± SD | 46.1 ± 2.8 | 44.2 ± 1.1 | 43.4 ± 1.3 | 42.6 ± 1.3 | <0.001 b |
| Range | 42.7–56.3 | 42.0–46.1 | 41.5–46.5 | 39.5–45.7 | |
| K2, D | |||||
| Mean ± SD | 48.8 ± 4.0 | 45.2 ± 1.2 | 44.2 ± 1.4 | 43.9 ± 1.4 | <0.001 b |
| Range | 43.9–59.2 | 43.3–47.7 | 41.8–47.8 | 41.3–46.0 | |
| Kavg, D | |||||
| Mean ± SD | 47.4 ± 3.2 | 44.7 ± 1.0 | 43.8 ± 1.3 | 43.2 ± 1.3 | <0.001 b |
| Range | 43.3–57.7 | 42.6–46.5 | 41.6 ± 47.1 | 40.5–45.9 | |
| Kapex, D | |||||
| Mean ± SD | 57.3 ± 6.9 | 47.2 ± 1.4 | 45.4 ± 1.9 | 44.8 ± 1.7 | <0.001 b |
| Range | 47.8–76.2 | 44.4–49.8 | 41.5–50.8 | 41.6 ± 47.3 |
Confocal Microscopy Findings
The confocal microscopy findings are shown in Table 2 . The mean basal epithelial cell density, endothelial cell density, and sub-basal nerve diameter were not significantly different among the 4 groups ( P = 0.057, P = 0.592, and P = 0.393, respectively). Anterior keratocyte density, posterior keratocyte density, sub-basal nerve density, and stromal nerve diameter were significantly different among the 4 groups ( P < 0.001, P < 0.001, P < 0.001, and P = 0.001, respectively). The mean anterior stromal keratocyte density was significantly lower in the manifest group, in the subclinical group, and in the relative group when compared with the control group ( P < 0.001, P < 0.001, and P < 0.001, respectively). The mean posterior stromal keratocyte density was significantly lower in the manifest group, in the subclinical group, and in the relative group when compared with the control group ( P < 0.001, P < 0.001, and P < 0.001, respectively) ( Fig. 1 and Fig. 2 ). The mean sub-basal nerve density was significantly higher in the manifest group when compared with the control group ( P < 0.001). The mean stromal nerve diameter was significantly higher in the manifest group, in the subclinical group, and in the relative group when compared with control group ( P = 0.001, P = 0.048, and P = 0.004, respectively) ( Fig. 3 ). Confocal images of keratocytes and stromal nerves in the manifest group, subclinical group, relative group, and control group are illustrated in Figure 4 .
| Mean ± SD Range | |||||
|---|---|---|---|---|---|
| Control | Manifest | Subclinical | Relatives | P value a | |
| Basal epithelial cell density, cells/mm 2 | 6188 ± 801 | 5592 ± 801 | 5617 ± 739 | 5870 ± 1096 | 0.057 |
| 5029–8743 | 3868–7550 | 4397–7185 | 3708–8669 | ||
| P value b | 0.081 | 0.188 | 0.799 | ||
| Anterior stromal keratocyte density, cells/mm 2 | 1042 ± 126 | 845 ± 63 | 894 ± 107 | 902 ± 62 | <0.001 |
| 749–1216 | 731–1014 | 678–1049 | 766–1005 | ||
| P value b | <0.001 | <0.001 | <0.001 | ||
| Posterior stromal keratocyte density, cells/mm 2 | 857 ± 97 | 716 ± 56 | 759 ± 91 | 767 ± 66 | <0.001 |
| 690–1020 | 625–830 | 576–888 | 559–913 | ||
| P value b | <0.001 | <0.001 | <0.001 | ||
| Endothelial cell density, cells/mm 2 | 2825 ± 297 | 2722 ± 310 | 2744 ± 235 | 2801 ± 395 | 0.592 |
| 2246–3298 | 2187–3245 | 2194–3255 | 2022–3524 | ||
| P value b | 1.0 | 1.0 | 1.0 | ||
| Sub-basal nerve density, μm/mm 2 | 33.66 ± 8.50 | 23.16 ± 10.21 | 30.23 ± 9.41 | 32.73 ± 9.43 | <0.001 |
| 10–45 | 5–40 | 10–45 | 10–55 | ||
| P value b | <0.001 | 1.0 | 1.0 | ||
| Sub-basal nerve diameter, μm | 3.27 ± 0.69 | 3.63 ± 1.19 | 3.50 ± 0.72 | 3.51 ± 0.68 | 0.393 |
| 2–5.60 | 2.20–6.90 | 2.60–4.90 | 2.10–5.20 | ||
| P value b | 0.562 | 1.0 | 1.0 | ||
| Stromal nerve diameter, μm | 5.42 ± 2.06 | 8.83 ± 3.52 | 8.03 ± 3.54 | 7.90 ± 3.48 | 0.001 |
| 2.20–11.10 | 3.50–17.60 | 3.20–22.40 | 2.70–12.70 | ||
| P value b | 0.001 | 0.004 | 0.048 | ||
a 1-way-ANOVA test for comparison of confocal microscopy findings in the 4 groups.
b Bonferroni test for comparison of confocal microscopy findings in the study groups (manifest group, subclinical group, and relatives group) and the control group.
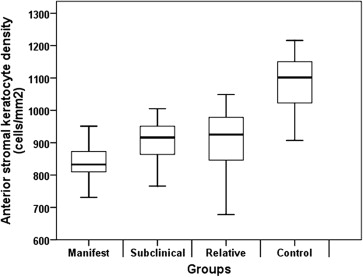
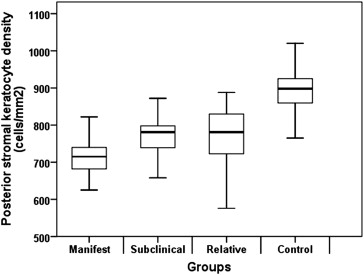
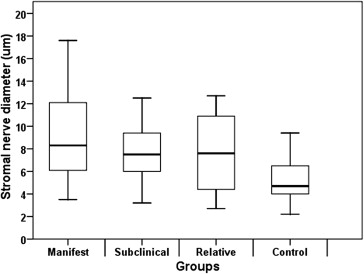
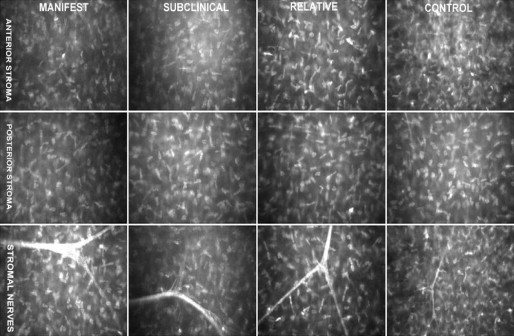
Table 3 shows the correlation analysis between central corneal thickness and epithelial cell density, endothelial cell density, anterior keratocyte density, posterior keratocyte density, sub-basal nerve density, sub-basal nerve diameter, and stromal nerve diameter. Central corneal thickness was correlated with posterior keratocyte density only in the manifest group (r = 0.400, P = 0.029). No association was observed between central corneal thickness and confocal microscopy findings in other groups.


