Purpose
To evaluate the accuracy of the visual field index (VFI) for the Humphrey Visual Field Analyzer in a population of patients with mild to moderate glaucoma.
Design
Retrospective cohort study.
Methods
The study included 42 patients (61 eyes) with at least 11 years of follow-up, and annual automated visual fields (VFs). Patients with mean deviations ≤−20 dB were excluded. All unreliable fields were omitted (fixation losses ≥20%, false-positive ≥15%, false-negative ≥33%). The VFs were divided into two 5-year series and the data were analyzed by the new Humphrey Visual Field Analyzer software. Projected VFIs from the first 5 years were compared with observed values obtained from the last 5 years. Unreliable fields initially excluded were reintroduced into the series (22 eyes) to create a comparison.
Results
Predicted VFIs were accurate with a mean overestimation of VF deterioration of 1.37% (95% CI: −0.22%, 2.96%). Of the predicted values, 95% were between −4.5% and 5.2% of the observed values when the predicted VFI was ≥90%; and between −13.8% and 20.5% when the predicted VFI was <90%. No statistical difference was found between the reliable and unreliable series (mean difference of 0.09% [95% CI: −0.41%, 0.59%]).
Conclusion
The new software for the Humphrey Visual Field Analyzer projects an accurate value for patients when the predicted VFI is ≥90%. Clinicians should consider the limitations of the software, especially for those patients with greater initial VF loss.
As a progressive optic neuropathy, the pathogenesis of glaucoma remains enigmatic. Intraocular pressure (IOP) is one of the only risk factors that can be modified to stabilize this disease. However, IOP levels alone do not dictate management decisions. Visual field status is of paramount importance.
Developed by Bengtsonn and Heijl for the Humphrey Visual Field Analyzer (HVFA) (Carl Zeiss Meditec, Dublin, California, USA), the Glaucoma Progression Analysis II has, at its core, the visual field index (VFI). This is a global measurement that emphasizes central visual field sensitivities and focal loss as a result of glaucoma. Using a linear regression technique, the software calculates the percentage of vision lost to glaucoma and predicts the stability or progression of visual field loss over the next 5 years based on the results of prior visual field examinations. We studied the accuracy of these predictions in a population diagnosed with glaucoma.
Methods
This was a retrospective cohort study. Patients did not have direct contact with the investigator, and all data were handled anonymously. All patients had signed a consent form that their clinical data could be utilized for knowledge advancement and research purposes; therefore, the South Eastern Sydney Area Health Service Ethics Committee waived the need for formal approval. The study conformed to the principles of the Helsinki Declaration. At Eye Associates in Sydney, Australia, 834 charts of patients with glaucoma were selected at random. Their visual fields were reviewed and selected according to the following inclusion criteria: patients were required to have had a minimum of 11 consecutive years of follow-up, including at least a yearly automated visual field test performed with the 30-2 or 24-2 Swedish Interactive Threshold Algorithms (SITA) on the HVFA and to not have advanced glaucoma as determined by a mean deviation worse than –20 dB; 42 patients (61 eyes) were included. The majority of the patients’ whose charts were reviewed were not selected because the patients lacked the required follow-up period, the visual data were not available for review, or they had advanced glaucoma.
The visual field data over the 11 years of follow-up were divided into the first 5 years and the last 5 years. Unreliable visual fields were removed; fixation losses ≥20%, false-positive rates ≥15%, and false-negative rates ≥33%. If the first or last visual field in a series was unreliable, the patient was excluded, as well as if there was more than 1 unreliable field in the first or last 5 years. The new HVFA software analyzed the data from the fields of the first half of the series so as to generate a prediction. The prediction was then compared to the actual outcome as assessed during the last 5 years. The equation for the Humphrey regression slope is proprietary, so in order to obtain an accurate VFI value (a numerical value that is not provided on the printout), the histograms were enlarged to obtain a scale of 1 mm = 1%. In a masked fashion, each histogram was measured twice for accuracy.
To determine whether the software’s predictive capabilities were susceptible to greater fluctuation if unreliable fields were included in the data set, we identified a subgroup of 21 patients (50%) (22 eyes) whose complete series included an unreliable test in either the first or the second half of the series or both. The data from this group were compared with its own more reliable counterpart.
Patients who underwent laser trabeculoplasties (argon or selective), surgical filtering procedures, or both were identified to determine whether such interventions had any effect on the slope of the regression analysis.
Results
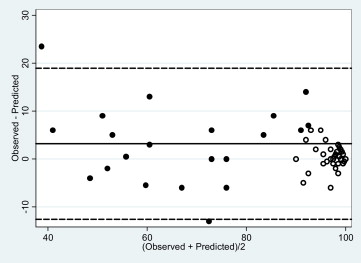
All analyses were conducted using SAS 9.1 (SAS Institute, Cary, North Carolina, USA). Differences between observed and predicted VFIs were calculated for each patient. The accuracy of each predicted value was analyzed by plotting histograms of the differences (data not included), calculating a 95% confidence interval (CI) of the mean difference as well as constructing Bland-Altman plots with 95% limits of agreement. The data obtained from the subgroups were subjected to hypothesis tests and calculation of the CIs to identify any differences among the following groups: (1) reliable versus unreliable; (2) surgical versus nonsurgical; and (3) laser versus no laser.
All statistical analyses, including the limits of agreement, considered the multiple observations provided by 19 patients (45%) by using linear mixed models.
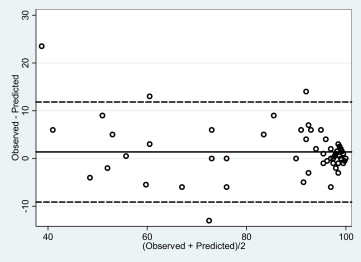
The characteristics of the patients forming the reliable and unreliable data groups are described in the Table . Of the 42 patients included in the study, the majority (22 patients) had primary open-angle glaucoma; 8 patients had ocular hypertension, 6 patients had a diagnosis of chronic primary angle-closure glaucoma, 5 patients had secondary open-angle glaucoma, and 1 patient had normal tension glaucoma. There was a slight, not statistically significant difference between the predicted and observed values for the 61 eyes included in the study. Progression was overestimated, on average, by 1.37% (95% CI [−0.22%, 2.96%], P = 0.05), with 95% of the predicted values found to be between 12% lower and 9.3% higher than the observed values ( Fig. 1 ). Within the group, 21 patients (22 eyes) required the removal of unreliable fields from their series prior to evaluation. Those unreliable fields were later reintroduced into their data set and analyzed using the same methods and compared with their own reliable data. There was little alteration in the accuracy of the prediction model, with a mean difference of 0.09% (95% CI [−0.41%, 0.59%], P = 0.71) ( Fig. 2 ).
| Characteristics | Reliable (n = 42, 61 eyes) | Unreliable (n = 21, 22 eyes) |
|---|---|---|
| Mean age | 61 | 61 |
| Mean baseline VA ∗ | 0.05 | 0.12 |
| Mean final VA | 0.15 | 0.15 |
| Mean baseline MD (range) | −3.87 (+1.25 to −19.78) | −4.01 (+1.01 to −19.78) |
| Mean final MD (range) | −4.94 (+1.50 to −19.89) | −5.13 (+0.88 to −19.89) |
| Laser (% of patients) | 14 (33) | 6 (29) |
| Trabeculectomy (% of patients) | 10 (24) | 9 (43) |
| Number of right eyes | 33 | 11 |
| Number of left eyes | 28 | 11 |
| Females (%) | 21 (50) | 10 (48) |
| Males (%) | 21 (50) | 11 (52) |
Within the entire group, 14 eyes underwent laser trabeculoplasties and 10 eyes underwent surgical trabeculectomies; 4 eyes underwent both laser treatment and surgery. Given these interventions, it might be expected that the predicted values would overestimate the deterioration of the visual field more extremely than in the eyes that had not undergone such treatment. This was not so for the eyes in the laser-treatment subgroup, but it was the case for the eyes after surgery. The mean difference in the accuracy of prediction was 0.12% (95% CI [−3.88%, 4.13%], P = 0.94) for eyes that had undergone laser trabeculoplasties compared with eyes that had not. The mean difference for the surgery subgroup, compared to the group without any surgical intervention, was 4.52% (95% CI [0.21%, 8.84%] P = 0.02). The surgery group demonstrated a higher VFI value than that predicted.
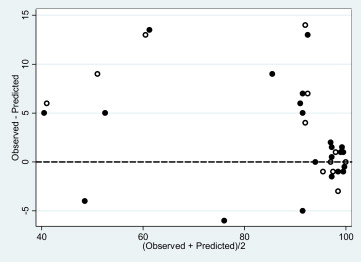
The prediction was more accurate if either the estimated slope of the prediction was greater than –1.5%/year, or the predicted VFI was ≥90%, with 95% of the predicted values expected within −7.2% and +7.2% (range, 14.4%), and −4.5% and +5.2% (range, 9.7%) of the actual observed VFI, respectively. This latter prediction is twice as accurate as previously measured with all the data sets included. However, if the slope was more negative than −1.5% per year or the predicted VFI was <90%, the accuracy declined considerably, with 95% of the predicted values for the latter case being within −13.8% and +20.5% of the actual value (range, 34.3%) ( Fig. 3 ).