Purpose
To estimate retinal ganglion cell (RGC) losses associated with visible glaucomatous localized retinal nerve fiber layer (RNFL) defects.
Design
Observational cross-sectional study.
Methods
A multicenter study of 198 normal eyes (138 subjects) and 66 glaucomatous eyes (55 subjects) recruited from the Diagnostic Innovations in Glaucoma Study and the African Descent and Glaucoma Evaluation Study. All eyes underwent standard automated perimetry (SAP), spectral-domain optical coherence tomography, and fundus stereophotography within 6 months. Glaucomatous eyes were included if localized RNFL defects were detected by masked grading of stereophotographs. The number of RGCs in each sector of a structure-function map was estimated using a previously published model combining RGC estimates from SAP and spectral-domain optical coherence tomography. The estimated percentage loss of RGCs (combined structure-function index) was calculated.
Results
In glaucomatous eyes, there were 136 sectors with visible RNFL defects and 524 sectors without visible RNFL defects. The most common sectors with visible RNFL defects were inferior and inferotemporal sectors, followed by superior and supertemporal sectors. Eyes with visible RNFL defects had a mean estimated RGC count of 657 172 cells versus 968 883 cells in healthy eyes ( P < .001). The average combined structure-function index in sectors with a visible RNFL defect (59 ± 21%) was significantly higher than in sectors without a visible RNFL defect in glaucomatous eyes (15 ± 29%; P < .001) and higher than in healthy eyes (1 ± 13%; P < .001).
Conclusions
Although visible localized RNFL defects often are considered an early sign of glaucoma, this study indicates that they are likely to be associated with large neuronal losses.
The histologic hallmark of glaucoma is accelerated loss of retinal ganglion cells (RGCs) and RGC axons. Loss of RGCs results in thinning of the retinal nerve fiber layer (RNFL), topographic changes to the optic nerve head, and a reduction in visual field sensitivity, which ultimately can result in visual impairment and blindness.
Glaucomatous damage to the optic nerve head and RNFL can be quantified using methods such as confocal scanning laser ophthalmoscopy, scanning laser polarimetry, and optical coherence tomography (OCT). RNFL loss also can be observed directly by dilated fundus examination using slit-lamp biomicroscopy and an accessory biconvex noncontact hand-held lens. In healthy eyes, the RNFL has a bright, uniform, striated appearance and is most readily identifiable where the RNFL is thickest, close to the superior and inferior poles of the optic disc. The RNFL striations represent bundles of RGC axons separated by Müller cell processes. The bright component of a striation is the result of the highly reflective parallel RGC axon bundles, and the dark bands between are the result of the thick nonreflective dividing Müller cell glial septa.
Loss of RGC axons leads to a reduction in the reflectivity of RGC axon bundles and may be diffuse or localized. Diffuse axonal loss results in a general reduction in RNFL striations, a darkened appearance to the inner retina, and increased visibility of the retinal blood vessels, which normally are embedded in the RNFL. There is some evidence that localized loss is less common but more easily visible because it has sharply demarcated borders. Localized RNFL defects tend to be wedge shaped and narrower as the RNFL bundles converge toward the disc margin. Although localized RNFL defects occasionally are caused by nonglaucomatous optic neuropathies, optic disc drusen, papilledema, or ischemic retinopathies, they have a high specificity for glaucoma and are not found in healthy eyes. It has been proposed that localized RNFL defects may be the earliest observable clinical sign of glaucomatous damage. However, a previous primate histologic study found that a localized RNFL defect was apparent on fundus photographs only if more than 50% of the thickness of the RNFL had been lost. Similar findings were found in another histologic study of primate and human eyes in which localized loss of 28% to 45% of RNFL thickness was required for visible RNFL defects. This suggests that rather than being an early sign of glaucoma, a large number of RGCs are likely to have been lost before a visible RNFL defect develops.
Although direct quantification of RGCs in vivo is not yet possible, empirical formulas derived from clinical structural and functional tests may be used to estimate the number of RGCs. Estimates derived using these formulas have shown good correlation with histologic RGC counts in experimental glaucoma models. In recent studies, we proposed a method for estimating RGC loss from a combination of standard automated perimetry (SAP) and RNFL assessment using OCT. The combined structure-function index (CSFI) was devised to represent the percentage of RGCs that an eye has lost compared with the expected number of RGCs. The combined structure-function index performed significantly better than isolated structural and functional parameters for staging the disease and monitoring glaucomatous progression. The estimated number of RGCs and the combined structure-function index may also be calculated for individual regions of the optic nerve and retina using a structure-function map that relates the location of RGC soma to the position of RGC axons at the optic disc. The aim of this study was to estimate the quantity of RGCs lost in regions associated with localized RNFL defects visible on stereophotographs. RGC estimates in sectors with an RNFL defect were compared to RGC estimates in sectors without an RNFL defect and to estimates in healthy eyes.
Methods
This was an observational, cross-sectional study involving participants from 2 prospective longitudinal studies: the African Descent and Glaucoma Evaluation Study and the Diagnostic Innovations in Glaucoma Study. Informed consent was obtained from all the participants, and the institutional review boards and human subjects committees of all 3 sites prospectively approved all of the methods. All methods adhered to the tenets of the Declaration of Helsinki for research involving human subjects, and the study was conducted in accordance with Health Insurance Portability and Accountability Act regulations. The 3-site African Descent and Glaucoma Evaluation Study collaboration includes the Hamilton Glaucoma Center at the Department of Ophthalmology, University of California, San Diego (UCSD; data coordinating center); the New York Eye and Ear Infirmary; and the Department of Ophthalmology, University of Alabama, Birmingham. The Diagnostic Innovations in Glaucoma Study includes only patients recruited at UCSD and the protocol is identical to that of the African Descent and Glaucoma Evaluation Study. Methodologic details have been described previously.
The study included 66 eyes of 55 subjects with glaucoma and localized RNFL defects visible on fundus stereophotographs and 198 eyes of 138 healthy subjects. Healthy subjects were recruited from the general population and had intraocular pressure of 21 mm Hg or less with no history of raised intraocular pressure and normal SAP results. At each visit, subjects underwent a comprehensive ophthalmologic examination including review of medical history, visual acuity, slit-lamp biomicroscopy, intraocular pressure measurement, gonioscopy, dilated funduscopic examination, stereoscopic optic disc photography, Spectralis spectral-domain (SD) OCT (Heidelberg Engineering, Dossenheim, Germany), and SAP using the Swedish interactive threshold algorithm (SITA standard 24-2; Carl Zeiss Meditec, Inc, Dublin, California, USA). Only subjects with open angles on gonioscopy were included. Subjects were excluded if they had a best-corrected visual acuity of less than 20/40; spherical refraction outside ± 5.0 diopters, cylinder correction outside 3.0 diopters, or both; or any other ocular or systemic disease that could affect the optic nerve or the visual field.
Stereophotograph Grading
All patients underwent simultaneous stereoscopic optic disc photography. Digital stereoscopic images were reviewed with a stereoscopic viewer (Screen-VU stereoscope; PS Manufacturing, Portland, Oregon, USA) by 2 or more experienced graders. Each grader was masked to the subject’s identity and to the other test results. Details of the methodology used to grade optic disc photographs at the UCSD Optic Disc Reading Center have been provided elsewhere. Eyes with localized RNFL defects were identified by at least 2 graders to be included in this analysis. RNFL defects were defined as defects wider than twice the width of an arteriole, extending from close to the disc margin into the parapapillary area, widening en route (i.e., wedge shaped). Slit defects narrower than the diameter of adjacent vessels were not included because they are found frequently in normal eyes.
Imaging and Standard Automated Perimetry
The Spectralis SD OCT (software version 5.4.7.0) was used to obtain RNFL thickness measurements. The device uses a dual-beam SD OCT and a confocal laser-scanning ophthalmoscope that works by emitting a superluminescent diode light with a center wavelength of 870 nm and an infrared scan to provide images of ocular microstructures simultaneously. A real-time eye tracking system is incorporated that couples confocal laser scanning ophthalmoscope and SD OCT scanners to adjust for eye movements and to ensure that the same location of the retina is scanned over time. A total of 1536 A-scan points were acquired from a 3.45-mm circle centered on the optic disc. All images were reviewed by the UCSD Imaging Data Evaluation and Analysis Center to ensure the scan was centered, that the signal strength was more than 15 dB, and that there were no artifacts. Scans that were inverted or clipped or those that showed coexistent retinal pathologic abnormalities were excluded. The RNFL segmentation algorithm also was checked for errors.
All the patients underwent SAP testing using the Swedish interactive threshold algorithm standard 24-2 strategy fewer than 6 months apart from imaging. All visual fields were evaluated by the UCSD Visual Field Assessment Center. Visual fields with more than 33% fixation losses or false-negative errors or more than 15% false-positive errors were excluded. An abnormal SAP result was defined as having a pattern standard deviation outside the 95% confidence limits or a glaucoma hemifield test result outside the reference range. Data regarding optic disc area were collected using the Heidelberg Retina Tomograph II (Heidelberg Engineering, Carlsbad, California, USA).
Estimation of Retinal Ganglion Cell Number
The estimates of RGC counts were obtained according to the model developed by Medeiros and associates based on empirical formulas derived by Harwerth and associates for estimating RGC counts from SAP and OCT results. The details of the model and the empirical formulas used to derive RGC counts have been described in detail in previous publications. The initial step of the model consists of translating SAP sensitivity values into RGC counts using formulas derived from experimental research in monkeys and subsequently translated to human eyes. The following formulas were used to estimate the number of RGC somas in retinal areas corresponding to specific SAP test field locations at eccentricity ec with sensitivity s in decibels:
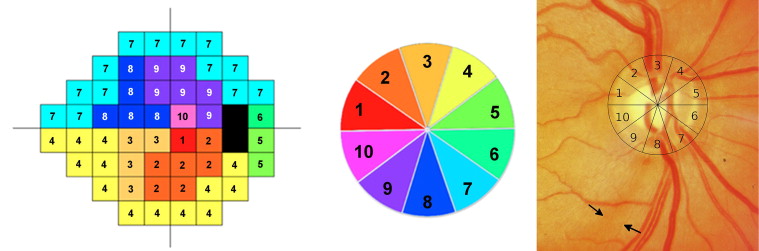
In the above formulas, m and b represent the slope and intercept, respectively, of the linear function relating ganglion cell quantity (gc) in decibels to visual field sensitivity (s) in decibels at a given eccentricity. A structure-function map was used to assign SAP test locations to 10 equal 36-degree sectors of the optic nerve head RNFL circle scan. Figure 1 shows the structure-function map for a right eye with sector 9 corresponding to the inferotemporal region of the optic disc. In the left eye structure-function map, sector 9 also corresponds to the inferotemporal sector of the optic disc, but numbering is counter clockwise. RGC estimates for individual SAP test locations were summed to estimate the number of RGC soma corresponding to each region of the optic disc.
The structural part of the model involved estimating the number of RGC axons from SD OCT RNFL thickness measurements. The model took into account the effect of aging on axonal density and the effect of disease severity on the relationship between the neuronal and nonneuronal components of the RNFL. The structure-function map had 10 sectors, and therefore data from the commercially available 6-sector RNFL thickness map was not used. Instead, mean RNFL thickness in each of the 10 disc sectors of the structure-function map was calculated from the 1536 A-scan points of the 3.45-mm SD OCT circle scan (data from 154 adjacent A-scans were averaged for each of sectors 1 through 6 and data from 153 adjacent A-scans were averaged for sectors 7 through 10). The number of RGC axons at each sector of the optic nerve was estimated using the following formulas:
Stay updated, free articles. Join our Telegram channel

Full access? Get Clinical Tree


