Purpose
To determine the effect of anti–vascular endothelial growth factor (VEGF) therapy on choroidal thickness in eyes with diabetic macular edema (DME).
Design
A retrospective, cohort analysis of 59 eyes from 59 patients with DME without prior anti-VEGF therapy.
Methods
Choroidal thickness was measured using semiautomated segmentation of enhanced depth imaging optical coherence tomography images at 0.5-mm intervals from 2.5 mm nasal to 2.5 mm temporal to the fovea. Changes in choroidal thickness with and without anti-VEGF treatment over 6 months were compared. Best-corrected visual acuity and central foveal thickness were analyzed to evaluate the association of choroidal thickness with functional and anatomic outcomes.
Results
Of the 59 eyes with DME, 26 eyes were observed without treatment, whereas 33 underwent intravitreal anti-VEGF therapy (mean number of injections, 2.73) over 6 months. In untreated eyes, there was no significant change in best-corrected visual acuity ( P = .098), central foveal thickness ( P = .472), or choroidal thickness at all measurements along the macula ( P = .057 at the fovea). In eyes treated with anti-VEGF injections, choroidal thickness decreased significantly at the fovea (246.6 to 224.8 μm; P < .001) and at 0.5 mm nasal (240.9 to 221.9 μm; P = .002) and 0.5 mm temporal (249.3 to 224.8 μm; P = .011) to the fovea. The decrease in subfoveal choroidal thickness after anti-VEGF treatment was not associated with the cumulative number of anti-VEGF injections ( R 2 = 0.031; P = .327) or to changes in best-corrected visual acuity ( R 2 = 0.017; P = .470) or central foveal thickness ( R 2 = 0.040; P = .263).
Conclusions
Central choroidal thickness decreases after anti-VEGF therapy for DME after 6 months, but may not be associated with functional or anatomic outcomes in eyes with DME.
The pathogenesis of diabetic macular edema (DME) long has been attributed to retinal vascular hyperpermeability, which is associated with focal leakage from microaneurysms or diffuse leakage from incompetent capillaries when visualized on fluorescein angiography. However, histopathologic studies also have implicated choroidal dysfunction in diabetics. These changes include loss of the choriocapillaris, increased tortuosity, narrowing and dilation of vessels, and sinus-like structure formation between choroidal lobules. Functional imaging studies also showed a reduction in choroidal blood flow in eyes with diabetic retinopathy. Yet, the role of choroidal perfusion in the pathophysiology of DME remains unclear.
The recent use of enhanced depth imaging (EDI) optical coherence tomography (OCT), which uses the increased depth of field from the inverted images obtained by placing the OCT device closer to the eye, has allowed researchers to examine the anatomic changes in the choroid in diabetic eyes. Choroidal thickness studies in diabetes have produced diverging results, however, with some reports suggesting choroidal thickening, thinning, and no change in eyes with diabetic retinopathy. Choroidal thickness measurements in eyes with DME similarly have been inconsistent. One important explanation for these variable results is the significant variability of choroidal thickness in these retrospective, cross-sectional studies. Choroidal thickness has been shown to vary with age, refractive error, and even time of day. Moreover, many of these studies include eyes that received treatment with intravitreal anti–vascular endothelial growth factor (ant-VEGF) therapy, which has been shown to cause choroidal thinning in other diseases such as age-related macular degeneration.
To address these limitations, we performed a cohort analysis evaluating choroidal thickness changes over 6 months in DME eyes without prior anti-VEGF therapy. We hypothesized that choroidal thickness may be associated with clinical outcomes in eyes with DME and that anti-VEGF therapy may affect choroidal anatomic features. Using a semiautomated choroidal segmentation software, we measured choroidal thickness changes in eyes with DME after anti-VEGF treatment compared with DME eyes that were observed without treatment over the same period. Finally, we evaluated potential associations of choroidal thickness with functional (visual acuity) and anatomic (retinal thickness) outcomes in DME.
Methods
A retrospective, nonrandomized cohort analysis was performed of 59 consecutive patients with treatment-naïve diabetic macular edema identified by a database search for all patients with the diagnosis of DME (International Classification of Diseases, Ninth Edition, code 362.07) who were evaluated at Duke University Eye Center Retina department between 2011 and 2013. This retrospective study was approved by the Institutional Review Board of Duke University and was conducted in accordance with the tenets of the Declaration of Helsinki.
Only eyes with center-involving DME as seen on OCT, without prior anti-VEGF therapy, that had undergone at least 2 EDI OCT imaging sessions 6 months apart were included for analysis. Eyes that received intravitreal steroid therapy, focal laser, or panretinal photocoagulation in the 3 months before the first time point were excluded. Other exclusion criteria include high myopia of more than 6 diopters, history of glaucoma, presence of vitreomacular traction, and history of vitreoretinal surgery. Because choroidal thickness has been shown to be unaffected by focal laser therapy, eyes with prior focal laser treatment were not excluded. Only 1 eye from each subject was included for analysis. The study eye was chosen if only 1 eye qualified based on inclusion and exclusion criteria. If both eyes qualified, the eye with worse best-corrected visual acuity (BCVA) was selected. If BCVA was equal between the 2 eyes, the right eye was designated the study eye for subjects with an even number birth month, and the left eye was selected for those with an odd number birth month.
For patients who met all inclusion and exclusion criteria, the initial visit was defined as the first visit at which an EDI OCT image was obtained, or in the subset of patients who received intravitreal anti-VEGF therapy, the first visit at which the injection was given. Enhanced depth imaging OCT images obtained at 6 months from the initial visit also were collected for analysis. Charts were reviewed to collect clinical history, including hemoglobin A1c (HbA1c) level; type of diabetic retinopathy, including nonproliferative and proliferative diabetic retinopathy; and prior DME treatments at baseline. Visual acuity (in logarithm of the minimal angle of resolution units), intraocular pressure (in millimeters of mercury), and time of EDI OCT image at each visit also were recorded. Because of the retrospective nature of this study, the criteria for anti-VEGF therapy and retreatment were made at the discretion of the treating physician and were not addressed in this analysis.
Complete ophthalmic examination and imaging with the Heidelberg Spectralis spectral-domain OCT (870 nm) device (Heidelberg Engineering, Heidelberg, Germany) were performed as part of the standard evaluation for patients with DME. Enhanced depth imaging OCT scans were captured using the Spectralis EDI mode, a preset, software-driven algorithm that places the retinal pigment epithelium near the 0-delay line while producing an upright enhanced choroidal image. In EDI OCT mode, a single 30-degree horizontal line scan (approximately 8.9 mm) captures 1536 A-scans per B-scan with 40 averaged B-scans per image, using the automatic averaging and eye tracking features. Images were always captured before any intravitreal injections were given on the same day.
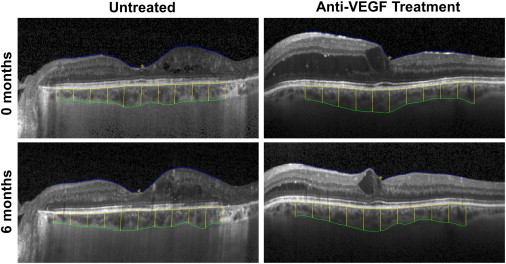
Choroidal thickness was measured semiautomatically using the Duke Optical Coherence Tomography Retinal Analysis Program software. Originally developed for automated segmentation applications, the Duke Optical Coherence Tomography Retinal Analysis Program has a custom graphical user interface for manual adjustments that has enabled it to be used reliably as a semiautomatic OCT layer segmentation tool in several large-scale clinical trials. The inner boundary is defined by the outer border of the hyperreflective line corresponding to the retinal pigment epithelium, whereas the outer boundary is defined by the outer border of the choroid stroma, corresponding to the stromal choroidal thickness, as defined recently. Choroidal thickness measurements were recorded at the subfoveal location and at 0.5-mm intervals from 2.5 mm nasal to 2.5 mm temporal to the fovea ( Figure 1 ). Poor-quality images where the segmentation software could not detect the choroid boundaries were excluded from analysis. Central foveal thickness (CFT) of the retina also was measured by the Duke Optical Coherence Tomography Retinal Analysis Program.
Statistical analysis was performed using Statistical Package for Social Sciences version 20 (SPSS Inc, Chicago, Illinois, USA). Differences between DME eyes with and without anti-VEGF treatment were compared using the Student t test for scale variables (age, HbA1c, BCVA, intraocular pressure, CFT, and subfoveal choroidal thickness) and the χ 2 test for nominal variables (gender, eye laterality, diabetic retinopathy type, lens status). Difference in median time of day when the images were obtained was evaluated by the Wilcoxon rank-sum analysis. Changes in BCVA, CFT, subfoveal choroidal thickness, or other choroidal thickness measurements over time were compared using the paired-samples t test. Univariate linear regression analysis was used to determine the association of subfoveal choroidal thickness or subfoveal choroidal thickness change with other variables tested, including the cumulative number of anti-VEGF treatments, BCVA, CFT, and change in BCVA or CFT.
Results
Baseline Characteristics
Fifty-nine eyes of 59 patients (mean age, 62.5 ± 12.8 years) were included in this cohort analysis. Of these, 27 eyes (45.8%) were right eyes, and 43 eyes were phakic (72.9%). There were 28 eyes (47.4%) classified as proliferative diabetic retinopathy and 31 eyes (52.5%) classified as nonproliferative diabetic retinopathy, with mean HbA1c of 7.9 ± 2.1%. At baseline, 24 eyes (40.7%) had prior focal laser therapy, 3 eyes (5.1%) had prior intravitreal triamcinolone (Kenalog; Bristol-Myers Squibb, New York, New York, USA), and 18 eyes (30.5%) had prior panretinal photocoagulation. No eyes had prior anti-VEGF therapy, because these were excluded from the study. Complete baseline characteristics are listed in Table 1 .
| All Eyes (n = 59) | Untreated (n = 26) | Anti-VEGF Treated (n = 33) | P Value | |
|---|---|---|---|---|
| Age (y) | 62.5 ± 12.8 | 62.1 ± 15.6 | 62.8 ± 10.3 | .828 a |
| Gender (male/female) | 29/30 | 14/12 | 15/18 | .522 b |
| Hemoglobin A1c (%) | 7.9 ± 2.1 | 7.6 ± 2.1 | 8.3 ± 2.1 | .222 a |
| Laterality (right/left) | 27/32 | 16/10 | 11/22 | .031 b |
| Retinopathy type (NPDR/PDR) | 31/28 | 11/15 | 20/13 | .128 b |
| Lens status | .498 b | |||
| Phakic | 43 | 18 | 25 | |
| Pseudophakic | 15 | 7 | 8 | |
| Aphakic | 1 | 1 | 0 | |
| Baseline BCVA (logMAR) | 0.422 ± 0.285 | 0.321 ± 0.299 | 0.501 ± 0.250 | .014 a |
| Baseline IOP (mm Hg) | 16.2 ± 3.6 | 15.9 ± 3.6 | 16.4 ± 3.6 | .541 a |
| Baseline CFT (μm) | 389.3 ± 151.1 | 324.6 ± 123.9 | 441.1 ± 152.0 | .002 a |
| Baseline subfoveal choroidal thickness (μm) | 251.0 ± 93.0 | 256.6 ± 96.8 | 246.6 ± 91.2 | .687 a |
Of the cohort, 33 eyes (55.9%) received at least 1 anti-VEGF treatment during the study period, whereas the remaining 26 eyes (44.1%) were observed without treatment. Most eyes treated with anti-VEGF received bevacizumab (Genentech, Inc, San Francisco, California, USA; 30 eyes), whereas the remainder (3 eyes) had ranibizumab (Genentech, Inc). As expected, untreated eyes had significantly greater mean BCVA (0.321 vs 0.501; P = .014) and lower mean CFT (324.6 μm vs 441.1 μm; P = .002) at baseline compared with eyes that underwent anti-VEGF therapy during the study period, which likely explained the decision for conservative management in the untreated group. Mean baseline subfoveal choroidal thickness, however, was similar between the 2 groups (256.6 μm vs 246.6 μm; P = .687). The untreated group had more right eyes (61.5% vs 33.3%; P = .031), with otherwise no statistical difference in mean age, HbA1c, and intraocular pressure, as well as similar proportions for gender, diabetic retinopathy type, and lens status among untreated and treated eyes with DME ( Table 1 ). The median time at which the EDI OCT was obtained did not differ significantly (10:53 AM vs. 10:22 AM; P = .891) between the 2 groups at baseline.
Baseline Factors Associated with Choroidal Thickness
At baseline, subfoveal choroidal thickness was not associated with BCVA ( R 2 = 0.010; P = .458) or CFT ( R 2 = 0.009; P = .484), in contrast to the significant association between CFT and BCVA ( R 2 = 0.205; P < .001; Supplemental Figure ). However, subfoveal choroidal thickness was associated with age ( R 2 = 0.234; P < .001), consistent with previous reports, and not with gender ( R 2 = 0.002; P = .773), HbA1c ( R 2 = 0.021; P = .335), eye laterality ( R 2 = 0.015; P = .362), diabetic retinopathy type ( R 2 = 0.004; P = .620), lens status ( R 2 = 0.030; P = .186), or intraocular pressure ( R 2 = 0.014; P = .379). These results suggest that in eyes that have never received anti-VEGF therapy, subfoveal choroidal thickness may not be associated with functional (BCVA) or anatomic (CFT) measures of DME severity.
Effect of Anti–Vascular Endothelial Growth Factor on Choroidal Thickness
Because of the variability of choroidal thickness between individuals at a single time point, we evaluated choroidal thickness changes in eyes with DME over time and whether such changes were affected by anti-VEGF therapy. At 6 months of follow-up, eyes that were observed without treatment showed a slight, but nonsignificant, increase in subfoveal choroidal thickness from 256.6 to 266.0 μm ( P = .057), but not at other locations measured along the macula ( Figure 2 , Table 2 ). In contrast, eyes that received anti-VEGF therapy (mean number of injections, 2.73) had a significant decrease in subfoveal choroidal thickness from 246.6 to 224.8 μm ( P < .001), as well as 2 adjacent choroidal thickness measurements at 0.5 mm nasal (240.9 to 221.9 μm; P = .002) and 0.5 mm temporal (249.3 to 224.8 μm; P = .011) to the fovea, but not at other locations measured along the macula ( Figure 2 , Table 2 ). A greater number of anti-VEGF treatments showed a possible trend toward a greater decrease in subfoveal choroidal thickness ( Figure 2 ), but this relationship was not significant ( R 2 = 0.031; P = .327). Together, these results suggest that anti-VEGF therapy may be associated with central choroidal thinning in eyes with DME, although there was no significant dose relationship detected in this cohort study.
| Untreated (n = 26) | Anti-VEGF Treatment (n = 33) | |||||
|---|---|---|---|---|---|---|
| Baseline | 6 Months | P Value | Baseline | 6 Months | P Value | |
| BCVA (logMAR) | 0.321 ± 0.299 | 0.296 ± 0.285 | .248 | 0.501 ± 0.250 | 0.424 ± 0.211 | .026 |
| CFT (μm) | 323.6 ± 123.9 | 320.0 ± 148.0 | .745 | 453.6 ± 125.1 | 375.2 ± 122.8 | < .001 |
| CT at (μm) a | ||||||
| −2.5 mm | 153.7 ± 81.1 | 152.6 ± 81.0 | .798 | 161.6 ± 67.8 | 160.1 ± 69.0 | .859 |
| −2.0 mm | 178.1 ± 84.0 | 178.4 ± 90.3 | .944 | 183.1 ± 76.3 | 177.7 ± 73.4 | .112 |
| −1.5 mm | 201.3 ± 96.2 | 206.4 ± 96.1 | .220 | 204.2 ± 79.2 | 196.4 ± 81.0 | .092 |
| −1.0 mm | 228.0 ± 98.9 | 231.1 ± 103.5 | .417 | 224.6 ± 81.4 | 216.3 ± 81.3 | .204 |
| −0.5 mm | 249.6 ± 105.4 | 252.3 ± 108.7 | .598 | 240.9 ± 84.6 | 221.9 ± 79.3 | .002 |
| Fovea | 256.6 ± 96.8 | 266.0 ± 108.1 | .057 | 246.6 ± 91.1 | 224.8 ± 83.3 | < .001 |
| +0.5 mm | 256.7 ± 90.9 | 269.4 ± 107.5 | .071 | 249.3 ± 81.1 | 232.8 ± 84.6 | .011 |
| +1.0 mm | 256.1 ± 88.6 | 260.3 ± 95.5 | .373 | 241.6 ± 65.6 | 231.5 ± 80.2 | .158 |
| +1.5 mm | 247.8 ± 81.0 | 245.3 ± 85.5 | .647 | 224.6 ± 66.4 | 222.4 ± 78.1 | .790 |
| +2.0 mm | 234.7 ± 72.8 | 234.4 ± 81.9 | .974 | 209.1 ± 62.4 | 208.1 ± 71.3 | .897 |
| +2.5 mm | 225.7 ± 65.8 | 224.6 ± 74.1 | .905 | 206.5 ± 55.7 | 203.2 ± 55.5 | .592 |
Stay updated, free articles. Join our Telegram channel

Full access? Get Clinical Tree


