Purpose
To assess the peripapillary retinal nerve fiber and macular retinal ganglion cell (RGC) loss in patients with dominant optic atrophy (DOA) stratified by OPA1 mutation type.
Design
Cross-sectional study.
Methods
We studied 39 patients from 28 pedigrees with DOA harboring heterozygous mutations in the OPA1 gene along with 45 age-matched healthy subjects. The retinal nerve fiber layer (RNFL) and ganglion cell-inner plexiform layer (GC-IPL) of patients with DOA were evaluated by optical coherence tomography (OCT) and compared to those of controls. Patients’ eyes were divided into 4 groups based on increasing severity of visual loss (DOA1 to DOA4) and were stratified by OPA1 mutation type.
Results
The average thicknesses of the RNFL and GC-IPL were smaller in patients with DOA than in healthy controls ( P < 0.0001). RNFL analysis showed a significant reduction of the average, superior and inferior quadrants thicknesses in the DOA4 group compared to the DOA1 group ( P = 0.001, P = 0.002 and P = 0.001, respectively). GC-IPL analysis showed a significant thinning in the superotemporal and superior sectors in the patients with DOA2 compared to those with DOA1 ( P = 0.046 and P = 0.04, respectively). Stratifying by mutation type, average, superior and nasal RNFL thinning was significantly more severe in missense mutations and had a presumed dominant-negative effect compared to mutations causing haploinsufficiency.
Conclusions
The present study demonstrates that in DOA, loss of macular RGCs is the earliest pathologic event, better reflected by GC-IPL measurements, whereas RNFL thickness is a measure of spared axons in late stages of the disease. Thus, mild cases (DOA2) show significant macular RGC loss as opposed to substantial maintenance of RNFL thickness, which is significantly decreased only in severe cases (DOA4). A clear genotype/phenotype correlation emerged, stratifying OCT measures by OPA1 mutation type, missense mutations being the most severe.
Dominant optic atrophy (DOA) is a genetically determined neurodegenerative disorder of retinal ganglion cells (RGCs) that is characterized by slowly progressive bilateral visual loss starting in childhood and ultimately leading to severe optic atrophy. However, the disease has incomplete penetrance and variable expression between and within families; it ranges from subclinical manifestations to legal blindness.
Most cases of DOA have been associated with mutations in the OPA1 gene on the long arm of chromosome 3q28–q29, which encodes a dynamin-related GTPase targeted to mitochondria. More than 200 OPA1 mutations have been reported ( http://mitodyn.org ; last update August 20, 2013). Two major mutation categories exist in patients with DOA. Stop-codon, frame-shift and deletion-insertion mutations can be seen throughout the entire gene; these all lead to incomplete transcription and decreased protein content, with haploinsufficiency as the pathogenic mechanism. Missense mutations are thought to act through a dominant negative mechanism, and those affecting the GTPase domain are associated with a syndromic, severe phenotype, defined as DOA “plus.” The OPA1 protein localizes to the mitochondrial inner membrane, facing the intermembrane space, and is involved in multiple functions. OPA1 plays a major role in regulating mitochondrial network dynamics. In particular, OPA1 induces fusion of the mitochondrial inner membrane, thus impinging on cristae morphology and, by closing cristae junctions, sequestering cytochrome c and modulating apoptosis. OPA1 is also involved in oxidative phosphorylation and the maintenance of mitochondrial DNA. DOA is characterized by loss of visual acuity, cecocentral scotomas, impairment of color vision, and temporal or diffuse atrophy of the optic disc. The incomplete penetrance and the variability of clinical expression may correlate with the extent of optic atrophy.
Optical coherence tomography (OCT) is a noninvasive technology that has been successfully used to diagnose and monitor various optic neuropathies, such as glaucoma, Leber hereditary optic neuropathy and nonarteritic ischemic optic neuropathy. Time-domain OCT has also been used to study patients with DOA. According to these studies, eyes with DOA show a significant reduction of the retinal nerve fiber layer (RNFL) thickness in all quadrants, with preferential involvement of the temporal and inferior quadrants; the age-related progression of fiber-layer thinning parallels that seen in healthy controls. Leber hereditary optic neuropathy is caused by mitochondrial DNA mutations affecting complex I and, as in DOA, is characterized by the early and preferential involvement of the small fibers in the papillomacular bundle, a hallmark of mitochondrial optic neuropathies. Furthermore, ONH analysis in DOA has revealed smaller optic discs when compared to healthy controls, suggesting a role of the OPA1 gene in controlling the ONH morphology and, possibly, the complement of retinal nerve fibers at birth.
Spectral-domain OCT has several advantages over time-domain OCT, such as increased repeatability and reproducibility and the possibility of imaging and quantifying macular RCGs by measuring the thickness of the ganglion cell-inner plexiform layer (GC-IPL). In the present study, we used spectral-domain OCT to assess (1) the relationship between the RNFL and the GC-IPL thickness in patients with DOA stratified by increasing disease severity based on residual visual acuity; and (2) the genotype-phenotype correlation by comparing OPA1 missense mutations with OPA1 mutations causing haploinsuffiency.
Methods
Patients
All patients included in the present study had molecularly confirmed diagnoses of DOA demonstrating an OPA1 mutation, and they were consecutively enrolled and evaluated at the Department of Neurological Sciences at the University of Bologna between 2008 and 2012. We recruited 39 consecutive patients (mean age: 35.6 ± 16.8 years; range, 12–79 years) from 28 unrelated pedigrees. All subjects had extensive ophthalmologic examinations, including best-corrected visual acuity measurement, slit-lamp biomicroscopy, intraocular pressure measurement, indirect ophthalmoscopy, and ONH photography. Exclusion criteria were the presence of any retinal pathology or optic nerve disease other than DOA, and spherical or cylindrical refractive errors higher than 3 and 2 diopters, respectively. All participants gave their informed consent according to the Declaration of Helsinki, and the study was approved by the internal review board at the Department of Neurological Sciences, University of Bologna.
The control group was extracted from a larger sample of 188 healthy subjects who were seen during routine ophthalmologic examinations. Inclusion criteria were the following: best-corrected visual acuity of at least 0.8 (decimal fraction); refractive error between −3 and +3 diopters of sphere and between −2 and +2 diopters of cylinder; normal (<21 mm Hg) intraocular pressure; normal appearance of the optic disc; normal visual field (the latter was examined with a Swedish interactive thresholding algorithm, SITA 24-2, standard test in all subjects by using the Humphrey VF analyzer, HFA II 750-4.1 2005; Carl Zeiss Meditec, Dublin, California, USA); no significant ocular disease found by routine ophthalmologic examination; and no family history of glaucoma or systemic diseases with possible ocular involvement such as diabetes mellitus. From this sample, we randomly selected 45 eyes of 45 subjects matching the patients’ groups for age, age being shown to influence peripapillary RNFL thickness, as measured by time-domain OCT and spectral-domain OCT. Age also has been shown to influence the GC-IPL thickness.
Instrumentation and Procedures
All subjects underwent measurements of RNFL thickness and GC-IPL thickness by spectral-domain OCT (Cirrus SD-OCT, software v 6.0; Carl Zeiss Meditec). All scans were acquired by the same operator using the Optic Disc Cube 200 × 200 and the Macular Cube 512 × 128 protocols in eyes without pupil dilation. After each patient had been properly seated and aligned, the iris was brought into view using the mouse-driven alignment system, and the ophthalmoscopic image was focused. To acquire the Optic Disc Cube, the ONH was centered on the live image, and centering and enhancement were optimized. After the scanning process was launched, the instrument’s 840 nm wavelength laser beam generated a cube of data measuring 6 mm × 6 mm after scanning a series of 200 B-scans with 200 A-scans per B-scan (40,000 points) in 1.5 seconds (27,000 A-scans/sec). Cirrus spectral-domain OCT algorithms were used to find the optic disc and automatically place a calculation circle 3.46 mm in diameter symmetrically around it. Layer-seeking algorithms were used to find the RNFL inner (anterior) boundary and the RNFL outer (posterior) boundary for the entire cube except the optic disc. The system extracted from the data cube 256 A-scan samples along the path of the calculation circle. The resulting temporal, superior, nasal, inferior profile map is equivalent to the Stratus peripapillary RNFL scan.
The ONH parameters reported resulted from a fully automatic algorithm that defines both the optic disc and the cup margins within the 3-dimensional data cube. The disc margin was defined as the termination of the Bruch membrane (also referred to as the neural canal opening or Bruch’s membrane opening).
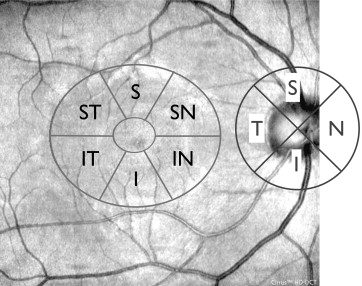
To acquire the Macular Cube, the patient was asked to fixate on the central target. The ganglion cell analysis algorithm detected and measured the thickness of the macular GC-IPL within a 14.13-mm 2 elliptical annulus area centered on the fovea ( Figure 1 ). The size and shape of the annulus were chosen for conformance to the real anatomy, and this annulus corresponded to the area where the RGC layer is thickest in normal eyes. The ganglion cell analysis algorithm processed data from 3-dimensional volume scans and measured the thickness of the macular GC-IPL. The average, minimum, and 6 sectoral (superotemporal, superior, superonasal, inferonasal, inferior, and inferotemporal) GC-IPL thicknesses were measured from the elliptical annulus centered on the fovea ( Figure 1 ). A detailed description of how this algorithm operates has been published in detail.
Only high-quality scans, defined as scans with signal strength ≥6, without RNFL discontinuity or misalignment, involuntary saccade, or blinking artifacts and absence of algorithm segmentation failure on careful visual inspection were used for analysis.
Statistics
The patients’ eyes were divided into different groups based on visual acuity: group 1 (DOA1) between 1.0 and 0.6; group 2 (DOA2) between 0.5 and 0.4; group 3 (DOA3) between 0.32 and 0.25; and group 4 (DOA4) less than 0.25 of visual acuity. These groups were established using increments of visual acuity of 0.25. The patients with visual acuity better than 0.25 were further stratified into 3 subgroups representing different degrees of visual function. In the control group, only 1 eye, randomly chosen, was considered for statistical evaluation in each subject. Moreover, the data from patients with DOA were also stratified by OPA1 mutation category: mutations causing haploinsufficiency (DOA-H) or missense mutations (DOA-M). The groups were compared by 1-way analysis of variance (ANOVA) with Bonferroni post hoc tests. Linear regressions were used to search for correlations between visual acuity and RNFL and GC-IPL measurements, introducing age and sex as covariates. All statistical analyses were performed using SPSS (IBM v 20; PASW, Chicago, Illinois, USA) and a P value <0.05 was considered statistically significant after appropriate correction for multiple comparisons.
Results
For this study, we collected 39 DOA patients from 28 DOA pedigrees that harbored a pathogenic heterozygous mutation in the OPA1 gene ( Table 1 ). The control group consisted of 45 age-matched subjects. All patients met the inclusion criteria.
| No. Pedigree | No. Affected Patients | OPA1 Mutations | OPA1 Exon | M/H | Note | |
|---|---|---|---|---|---|---|
| 5 | 9 | c.2708-2711delTTAG | p.V903fs | 27 | H | |
| 2 | 3 | c.2825-2828delAGTT | p.V942fs | 28 | H | |
| 1 | 1 | c.113-130del18 | p.38-43del6 | 2 | H | |
| 1 | 1 | c.1669C>T | p.R557X | 17 | H | |
| 1 | 1 | c.1724-1725delAA | p.R557X | 18 | H | * |
| 1 | 1 | c.1770G>A | spice defect | 18 | H | * |
| 1 | 1 | c.1783insT | p.F594fs | 19 | H | * |
| 1 | 2 | c.2193-2196dupAGAC | p.D732fs | 22 | H | * |
| 1 | 1 | c.2671-2694dup24 | p.891-898dup8 | 26 | H | * |
| 1 | 1 | c.2708-2A>T | splice defect | 27 | H | 11 |
| 1 | 2 | c.2819-2A>C | splice defect | 28 | H | 14 |
| 1 | 1 | c.703C>T | p.R235X | 7 | H | |
| 1 | 1 | c.870+5G>A | splice defect | 8 | H | |
| 1 | 2 | c.889C>T | p.Q297X | 9 | H | |
| 1 | 1 | c.1770+1 delG | splice defect | 17 | H | |
| 1 | 1 | c.1516+1G>C | splice defect | 15 | H | |
| 1 | 2 | c.2815delC | p.L939fs | 27 | H | 11 |
| 2 | 4 | c.1409A>G | p.D470G | 14 | M | |
| 1 | 1 | c.1778 T>C | p.L593P | 19 | M | |
| 1 | 1 | c.869 G>A | p.R290Q | 8 | M | |
| 1 | 1 | c.2729T>A | p.V910D | 27 | M | 11 |
| 1 | 1 | c.1807G>C | p.D603H | 19 | M | * |
Table 1 shows the OPA1 mutation types in the 28 pedigrees stratified by mutational category (mutations causing haploinsufficiency vs missense mutations). Patients from pedigrees carrying the same mutation were pooled. Most mutations were well-established OPA1 pathogenic mutations listed in the OPA1 mutation database ( mitodyn.org ); some mutations have been reported recently or are unpublished.
Optical Coherence Tomography Measurements in Dominant Optic Atrophy Grouped by Categories of Increasing Visual Acuity Loss Severity
Optic nerve head
Comparison of the optic disc area by 1-way ANOVA disclosed significant differences ( P = 0.032) in the 5 groups. Only the DOA group with the lowest visual acuity (DOA4) showed a significantly smaller disc area compared to the control group ( P = 0.024). Post hoc testing failed to disclose differences among the other 4 DOA groups (DOA1-DOA3) and the control group ( Table 2 ).
| Controls (Mean ± SD) n = 45 | DOA1 (Mean ± SD) n = 11 | DOA2 (Mean ± SD) n = 16 | DOA3 (Mean ± SD) n = 13 | DOA4 (Mean ± SD) n = 38 | |
|---|---|---|---|---|---|
| BCVA | 1.0 ± 0.0 | 0.70 ± 0.45 | 0.46 ± 0.50 | 0.29 ± 0.03 | 0.11 ± 0.06 |
| Age | 39.0 ± 16.9 | 44.2 ± 13.8 | 28.2 ± 13.6 | 30.0 ± 11.8 | 39.1 ± 19.6 |
| Optic disc area (mm 2 ) | 1.9 ±0.3 | 1.8 ± 0.3 | 1.9 ± 0.4 | 1.8 ± 0.4 | 1.6 ± 0.4 |
| RNFL thickness (μm) | |||||
| Avg | 96.1 ± 9.9 | 61.4 ± 10.4 ∗∗ | 57.6 ± 9.3 ∗ | 57.4 ± 7.6 ∗ | 46.7 ± 11.0 |
| Temp | 66.4 ± 10.5 | 31.8 ± 7.1 | 28.4 ± 6.1 | 29.7 ± 7.6 | 25.6 ± 9.0 |
| Sup | 119.5 ± 14.9 | 83.7 ± 15.9 ∗ | 80.8 ± 14.9 ∗ | 79.6 ± 14.3 ∗ | 64.6 ± 13.2 |
| Nas | 71.8 ± 11.5 | 53.8 ± 11.2 | 53.9 ± 11.0 | 51.6 ± 10.6 | 44.5 ± 12.7 |
| Inf | 126.5 ± 18.3 | 75.9 ± 13.4 ∗∗ | 68.0 ± 13.7 ∗ | 69.0 ± 11.2 ∗ | 53.4 ± 14.9 |
| GC-IPL thickness (μm) | |||||
| Avg | 83.3 ± 4.8 | 55.4 ± 6.3 ∗∗ | 51.7 ± 4.0 | 49.6 ± 2.4 † | 58.6 ± 4.3 |
| Min | 82.1 ± 5.2 | 49.3 ± 5.5 ∗ | 46.6 ± 4.4 | 44.8 ± 2.8 | 42.9 ± 5.4 |
| IT | 84.2 ± 5.4 | 56.4 ± 6.3 ∗∗ | 53.1 ± 4.0 ∗ | 51.2 ± 3.2 | 48.2 ± 4.6 |
| ST | 82.1 ± 5.0 | 59.7 ± 8.1 ∗∗ | 53.8 ± 4.2 † , ∗ | 51.2 ± 2.8 †† | 48.2 ± 5.4 |
| S | 83.7 ± 5.0 | 59.5 ± 10.2 ∗∗ | 51.9 ± 4.5 † | 50.3 ± 2.7 †† | 49.9 ± 4.7 |
| SN | 84.7 ± 5.4 | 52.7 ± 6.7 ∗ | 50.0 ± 4.7 | 46.8 ± 3.4 † | 47.6 ± 4.5 |
| IN | 83.4 ± 5.2 | 51.5 ± 4.5 | 49.4 ± 4.5 | 47.8 ± 2.5 | 47.3 ± 4.6 |
| I | 82.3 ± 5.3 | 52.9 ± 4.9 | 50.8 ± 4.4 | 49.1 ± 3.5 | 49.2 ± 4.2 |
∗ P < 0.05 Bonferroni post hoc test.
∗∗ P < 0.001 Bonferroni post hoc test compared to DOA 4.
† P < 0.05 Bonferroni post hoc test.
Retinal nerve fiber layer
One-way ANOVA revealed a significant difference ( P < 0.0001) in the peripapillary RNFL thickness for the 360 degree average value as well as in each quadrant. The post hoc test detected a significant reduction in each quadrant in all DOA groups compared to controls ( P < 0.0001). Moreover, a significant reduction was observed in the average, superior and inferior RNFL quadrant thicknesses in groups with DOA1, ( P = 0.001, P = 0.002 and P = 0.001, respectively); DOA2 ( P = 0.004, P = 0.003 and P = 0.023, respectively); and DOA3 ( P = 0.013, P = 0.016 and P = 0.025, respectively) compared to the DOA4 group, which exhibited the lowest values.
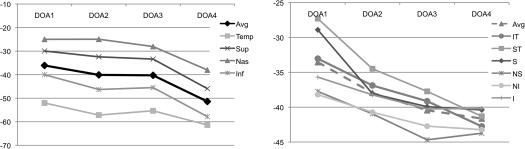
The average percentage of reduction of the RNFL thicknesses in the 4 DOA groups compared to controls was more evident in the temporal and inferior quadrants (mean ratio −56% and −47%, respectively) and was less pronounced in the superior and nasal quadrants (mean ratio −35% and −29%, respectively) ( Table 3 ) ( Figure 2 ). Moreover, considering all 4 quadrants, the reduction of the RNFL thickness was more evident between DOA3 and DOA4 (mean ratio −10%) than between DOA1 and DOA3 (mean ratio −4%).
| DOA Groups | RNFL Avg | Temp | Sup | Nas | Inf | GC-IPL Avg | GC-IPL Min | IT | ST | S | SN | IN | I |
|---|---|---|---|---|---|---|---|---|---|---|---|---|---|
| DOA1 | −36 | −52 | −30 | −25 | −40 | −34 | −40 | −33 | −27 | −29 | −38 | −38 | −36 |
| DOA2 | −40 | −57 | −32 | −25 | −46 | −38 | −43 | −37 | −34 | −38 | −41 | −41 | −38 |
| DOA3 | −40 | −55 | −33 | −28 | −45 | −40 | −45 | −39 | −38 | −40 | −45 | −43 | −40 |
| DOA4 | −51 | −61 | −46 | −38 | −58 | −42 | −48 | −43 | −41 | −40 | −44 | −43 | −40 |
| DOA1 vs DOA3 | −4 | −3 | −3 | −3 | −5 | −7 | −4 | −6 | −10 | −11 | −7 | −5 | −5 |
| DOA3 vs DOA4 | −11 | −6 | −13 | −10 | −12 | −1 | −10 | −4 | −4 | −0 | −1 | −1 | −0 |
Ganglion cell-inner plexiform layer analysis
The GC-IPL thickness was significantly lower in all macular sectors, on the average and in the minimum value, compared to the control group (ANOVA, P < 0.0001). The post hoc test also demonstrated significant thinning of all sectors in all groups with DOA compared to the controls ( P < 0.0001). The comparison among the 4 groups with DOA showed significant reductions in the superotemporal and superior sectors between the DOA1 and DOA2 groups ( P = 0.046 and P = 0.04, respectively); on average, reductions in the superotemporal and superior and superonasal sectors in DOA1 and DOA3 ( P = 0.025, P = 0.001, P < 0.0001, and P = 0.049, respectively); on average, minimum reductions in the inferotemporal, superotemporal, superior, and superonasal sectors in the DOA1 and DOA4 groups ( P < 0.0001, P = 0.04, P < 0.0001, P < 0.0001, P < 0.0001, and P = 0.038, respectively); and reductions in the in inferotemporal and superotemporal sectors in DOA2 and DOA4 ( P = 0.01 and P < 0.005, respectively). The remaining sectors of the 4 DOA groups revealed similar loss of ganglion cells, independent of the residual visual acuity.
The percentage of reduction of the GC-IPL thickness in the DOA1 group was more evident in the superonasal, inferonasal and inferior sectors (mean ratios −38%, −38% and −36%, respectively) and less pronounced in the inferotemporal, superotemporal and superior sectors (mean ratios −33%, −27% and −29%, respectively) compared to controls. In the other DOA groups (DOA2-DOA4), the mean ratios increased in a similar fashion ( Table 3 ) ( Figure 2 ). Moreover, considering all sectors, the reduction of the GC-IPL thickness was more evident between DOA1 and DOA3 (mean ratio −8%) than between DOA3 and DOA4 (mean ratio −1%).
Optical coherence tomography measurements in dominant optic atrophy grouped by different OPA1 mutations
After stratifying DOA patients by OPA1 mutation ( Table 4 ), 1-way ANOVA revealed a significant difference in the visual acuity but not in the age or in the optic disc area.


