Purpose
To determine if controlled environmental conditions can induce acute exacerbations of signs and symptoms in dry eye and asymptomatic subjects.
Design
Prospective cross-sectional study.
Methods
Nineteen patients with dry eye and 20 asymptomatic controls were exposed to controlled low humidity (5% relative humidity, desiccating environment) for 2 hours in our Controlled Environmental Research Laboratory at the University of Valladolid. The patients completed the Single-Item Score Dry Eye Questionnaire and the following diagnostic tests were performed before and after exposure: tear osmolarity, phenol red thread test, conjunctival hyperemia, fluorescein tear film break-up time, Schirmer test, and ocular surface vital staining. Sixteen molecules in the tears samples were analyzed by multiplex bead analysis.
Results
After exposure, the patients and controls had a significant ( P ≤ .003) increase in corneal staining (from 0.68 ± 0.15 to 1.16 ± 0.14 and from 0.50 ± 0.15 to 1.30 ± 0.19, respectively), significantly decreased ( P ≤ .01) fluorescein tear film break-up time values (from 2.78 ± 0.56 seconds to 1.94 ± 0.24 seconds and from 2.81 ± 0.24 seconds to 2.13 ± 0.19 seconds, respectively), and significantly increased ( P ≤ .03) matrix metalproteinase 9 tear levels (from 10 054.4 ± 7326.6 pg/mL to 25 744.5 ± 13 212.4 pg/mL and from 10 620.5 ± 4494.3 pg/mL to 16 398.7 ± 5538.3 pg/mL, respectively). In the control group, the epidermal growth factor tear levels decreased significantly ( P = .007; from 1872.1 ± 340.7 pg/mL to 1107.1 ± 173.6 pg/mL), and interleukin 6 levels increased significantly ( P < .001; from 29.6 ± 5.8 pg/mL to 54.3 ± 8.3 pg/mL) after exposure.
Conclusions
Adult patients with mild-to-moderate dry eye and asymptomatic subjects of similar ages can experience acute exacerbation in an environmental chamber that resembles the sudden worsening that patients with dry eye experience daily.
Dry eye disease is a multifactorial inflammatory disorder of the lacrimal functional unit that is characterized by ocular discomfort, visual disturbances, tear film instability, increased tear osmolarity, and inflammation. Inflammation of the lacrimal functional unit is mediated by different cells and molecules such as cytokines, chemokines, growth factors, and neuromediators. Clinical evidence indicates that the available diagnostic tests are not always well correlated with the symptoms, especially in mild-to-moderate dry eye. An important factor may be the constantly changing environment to which the lacrimal functional unit is exposed. This variability is a well-recognized major problem when studying therapeutic efficacy in clinical trials.
Millions of individuals worldwide are exposed to numerous artificially controlled environments in office buildings, shopping malls, vehicles, and airplanes with environmental variables, such as low humidity and high-velocity airflow, that affect the lacrimal functional unit. Exposure to these variables can increase the rate of tear film evaporation and can activate numerous ocular surface nerves, resulting in increased dry eye signs and symptoms and exacerbation of dry eye disease.
More approved therapeutics are needed to control the underlying inflammation and the increased symptoms that patients with dry eye have when exposed to adverse environments. Additionally, individuals also may report dryness of other mucosal sites (nose, mouth, and throat), headaches, and other symptoms with persistent exposure to adverse environments, causing the well-known sick building syndrome.
We and others have studied the effects of diverse environmental conditions on the lacrimal functional unit in patients with dry eye and contact lens wearers. Results have indicated that environmental chambers or goggles have demonstrated the ability to evaluate the effects of controlled adverse environments on contact lens tolerance and the efficacy of therapies to treat dry eye in ocular surface diseases.
The purpose of the current study was to analyze how the lacrimal functional unit in patients with mild-to-moderate dry eye and in asymptomatic control individuals is affected after exposure to the type of desiccating environment that exacerbates dry eye. We measured the symptoms, signs, tear osmolarity, and 16 inflammatory molecules in tears before and after a 2-hour exposure.
Methods
Participants
This prospective cross-sectional study adhered to the tenets of the Declaration of Helsinki, and the University of Valladolid Ethics Committee approved the prospective study. The study was double-masked and the same examiner (MT) performed the clinical subjective tests. Patients with dry eye were recruited from those with level 1 and 2 disease, as classified by the International Dry Eye Workshop dry eye severity grading scheme. The patients were already under our care and regularly performing daily palpebral hygiene and using unpreserved artificial tears, ocular lubricants, or both as the only topical medications. Asymptomatic volunteers served as the control group.
During a preliminary visit, the recruited patients with dry eye were screened for inclusion criteria, that is, an Ocular Surface Disease Index (OSDI) score of 12 or higher and corneal staining of grade 2 or less (Oxford scale). For asymptomatic control subjects, the inclusion criteria were an OSDI score of less than 12 and corneal fluorescein staining of grade 1 or less (Oxford scale). Exclusion criteria for both groups included pregnancy or nursing, contact lens wear, any ocular surgery within the previous 6 months, any acute or chronic ocular disease other than dry eye, concomitant allergies (even if mild), and topical medications (only artificial tears were allowed). Patients also were screened for any systemic anomaly that contraindicated exposure to any environmentally controlled conditions. The use of systemic medications had to have remained unchanged during the previous 3 months and for the entire study duration. Patients with dry eye previously could have used other topical anti-inflammatory medications, such as steroids or cyclosporine, but not during the previous 3 months. Patients were instructed not to instill artificial tears within 4 hours before evaluation.
For each patient, the eye with more severe corneal staining was included in the dry eye group. The eye with the least corneal staining was included in the control group. If both eyes of a patient had the same degree of corneal staining, the more symptomatic eye was included in the dry eye group. If the latter criteria failed to select the study eye, the eye was selected by computer-generated randomization.
Environmental Conditions
Individuals were exposed to a controlled desiccating environment within an environmental suite inside the Controlled Environmental Research Laboratory at the Instituto Universitario de Oftalmobiología Aplicada, University of Valladolid, Valladolid, Spain. The environmental conditions included a temperature of 23°C, 5% relative humidity, and localized airflow with a mean velocity of 0.43 meters/second. During exposure, participants watched a documentary on a conventional light-emitting diode television monitor. More detailed information about the characteristics of this environmental chamber was published recently.
Examination Procedure
All individuals were evaluated immediately before and after the 2-hour exposure in an examination room in the controlled environment laboratory with the same exposure conditions described previously.
Modified Single-Item Score Dry Eye Questionnaire
The Single-Item Score Dry Eye Questionnaire (SIDEQ; Simmons PA. IOVS 2003;44:ARVO E-Abstract B287) assesses ocular discomfort resulting from dryness, ranging from none to severe on a scale of 0 to 4, with 0 indicating no discomfort and 4 indicating maximum discomfort. We also used a visual analog scale to increase the test sensitivity as described previously.
Tear Osmolarity
The TearLab osmometer (TearLab Corporation, San Diego, California, USA) was used to assess tear osmolarity.
Phenol Red Thread Test
In using the Zone Quick Test (Menicon Company Ltd, Nagoya, Japan), the thread was placed over the external canthus, and the length of the wet thread was read 15 seconds later.
Conjunctival Bulbar Hyperemia
Nasal and temporal areas were assessed independently based on the Efron scale ; the final score was the average of the values.
Tear Sample Collection for Molecular Analysis
A 2-μL sample was collected nontraumatically from the external canthus using a glass capillary tube (Drummond Scientific, Broomall, Pennsylvania, USA) and was diluted as well as frozen as described previously.
Tear Film Break-up Time
The tear film break-up time (TBUT) was defined as the time between the last of 3 blinks and the appearance of the first dry spot. This test was performed after instillation of 5 μL of 2% sodium fluorescein. The procedure was repeated 3 times to obtain an average value.
Corneal Fluorescein Staining
We evaluated the corneal integrity using this stain. A cobalt-blue filter over the light source of the slit-lamp biomicroscope (SL-8Z; Topcon Corp, Tokyo, Japan) and a yellow Wratten no. 12 filter (Eastman Kodak, Rochester, New York, USA) were used 2 minutes after instillation of 5 μL of 2% sodium fluorescein. The Oxford scheme (graded with scores of 0 to 5) and a modified Baylor scheme described previously were used to perform the corneal fluorescein staining assessment. The Baylor method divides the cornea into central, superior, temporal, inferior, and nasal areas. We always used a customized transparent template that delineated the 5 corneal areas and that was incorporated into the biomicroscope viewing system to increase the grading accuracy of the observer.
Conjunctival Lissamine Green Staining
Lissamine green strips (GreenGlo; HUB Pharmaceuticals, LLC, Rancho Cucamonga, California, USA) were wet with 25 μL sodium chloride and were applied gently into the inferior fornix. One minute later, staining was evaluated according to the Oxford scheme.
Schirmer Test without Topical Anesthesia
One Schirmer sterile strip (Tearflo; HUB Pharmaceuticals, LLC) was placed in the lateral canthus of the inferior lid margin.
Analysis of Tear Molecules
Two commercial immune bead-based assays were used to analyze 16 molecules in the tear samples using Luminex IS-100 equipment (Luminex Corporation, Austin, Texas, USA). The concentrations of epidermal growth factor (EGF); Chemokine [C-X3-C motif] ligand 1 (CX3CL1)/fractalkine; interferon (IFN)-γ; interleukin (IL)-1β; IL-2; IL-6; Chemokine [C-X-C motif] ligand 8 (CXCL8)/IL-8; IL-10; IL-12p70; IL-17A; interleukin-1 receptor antagonist (IL-1RA); Chemokine [C-X-C motif] ligand 10 (CXCL10)/Interferon gamma-induced protein 10 (IP-10); Chemokine [C-C motif] ligand 5 (CCL5)/regulated on activation, normal T cell expressed and secreted (RANTES); tumor necrosis factor (TNF)-α; and vascular endothelial growth factor (VEGF) were measured simultaneously with a 15-plex assay (HCYTO-60K 15X-Milliplex; Millipore Iberica, Spain). The matrix metalloproteinase-9 (MMP-9) concentration was measured in a separate assay with an MMP-9 single-plex assay (HMMP2-55K Panel 2; Milliplex), which recognized the MMP-9 inactive zymogen and MMP-9 active forms. The samples were analyzed according to the manufacturer’s protocol as previously described. The minimal detectable concentrations (in picograms per milliliter) for molecules analyzed were as follows: IFN-γ and TNF-α, 0.1; CXCL8/IL-8 and IL-17A, 0.2; IL-2, IL-6, and IL-10, 0.3; IL-1β and IL-12p70, 0.4; CCL5/RANTES, 1; CXCL10/IP-10, 1.2; EGF, 2.7; IL-1RA, 2.9; VEGF, 5.8; CX3CL1/fractalkine, 6; and MMP-9, 10. The assayed molecule was undetectable in some samples. To include those samples in the statistical analysis, we assigned each the minimal detectable value provided by the assay manufacturer as previously reported. However, molecules that were detected in less than 75% of the samples were not analyzed further.
Data Analysis
The data were expressed as the mean ± standard error of the mean. Statistical analyses were performed using the Statistical Package for the Social Sciences Software for Windows version 19.0 (SPSS, Inc, Chicago, Illinois, USA) and R software by a licensed statistician. For comparisons between outcomes obtained by each group, the Mann–Whitney U test was used. For comparisons between tests performed before and after environmental exposure, the Wilcoxon test was used for quantitative variables. Two-sided P values of .05 or less were considered significant.
Results
Nineteen patients with dry eye (5 men and 14 women; mean age, 64.2 ± 1.9 years) and 20 asymptomatic control subjects (6 men and 14 women; mean age, 59.3 ± 1.9 years) were included. The patient ages did not differ significantly ( P = .35) between the groups.
At recruitment, the mean OSDI values were 35.73 ± 2.79 for the dry eye group and 3.27 ± 0.84 for the control group ( P < .0001). The corneal staining values in the dry eye group were 0.79 ± 0.16 (+2 in 3 (15.8%) patients, +1 in 9 (47.4%) patients, and 0 in 7 (36.8%) patients) and 0.50 ± 0.11 (+1 in 10 (50.0%) subjects; P = .21) in the control group.
Clinical Tests
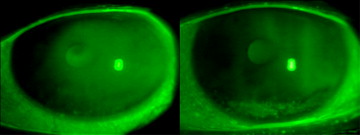
Table 1 shows all numerical values. Figure 1 summarizes only the clinical test results that differed significantly either when the exposure values before and after 2 hours were compared or between the patients with dry eye and asymptomatic individuals. A significant increase in corneal fluorescein global staining ( Figures 1 and 2 ) and in the central, nasal, temporal, and inferior areas (Baylor scheme) was seen in the patients with dry eye and asymptomatic controls ( Table 1 ) after the 2-hour exposure. Similarly, the TBUT values decreased significantly in both groups. The conjunctival staining increased significantly in the asymptomatic subjects, and conjunctival hyperemia and Schirmer test results increased significantly in the patients with dry eye ( Table 1 , Figure 1 ).
| Test | Exposure | Control Group (Mean ± SEM) | P Value a | DE Group (Mean ± SEM) | P Value a |
|---|---|---|---|---|---|
| Modified SIDEQ | Before | 0.63 ± 0.24 | .53 | 10.27 ± 2.20 b | .78 |
| After | 0.89 ± 0.34 | 9.23 ± 1.87 | |||
| Tear osmolarity | Before | 307.10 ± 2.63 | .14 | 329.52 ± 5.92 b | .39 |
| After | 313.85 ± 4.60 | 323.57 ± 5.32 | |||
| Phenol Red Thread Test | Before | 21.26 ± 1.72 | .53 | 18.74 ± 1.67 | .40 |
| After | 21.45 ± 1.37 | 17.31 ± 1.68 | |||
| Conjunctival hyperemia | Before | 1.25 ± 0.10 | .08 | 1.07 ± 0.09 | .05 |
| After | 1.48 ± 0.10 | 1.24 ± 0.11 | |||
| TBUT | Before | 2.81 ± 0.24 | .001 | 2.78 ± 0.56 | .01 |
| After | 2.13 ± 0.19 | 1.94 ± 0.24 | |||
| Corneal staining (Oxford) | Before | 0.50 ± 0.15 | .0004 | 0.68 ± 0.15 | .003 |
| After | 1.30 ± 0.19 | 1.16 ± 0.14 | |||
| Corneal staining: intensity (modified Baylor scale score) | |||||
| Central | Before | 0.10 ± 0.07 | .01 | 0.11 ± 0.07 | .10 |
| After | 0.40 ± 0.13 | 0.42 ± 0.19 | |||
| Nasal | Before | 0.55 ± 0.19 | .001 | 0.58 ± 0.11 | .02 |
| After | 1.60 ± 0.28 | 1.16 ± 0.22 | |||
| Temporal | Before | 0.50 ± 0.14 | .0008 | 0.68 ± 0.15 | .01 |
| After | 1.30 ± 0.22 | 1.31 ± 0.23 | |||
| Superior | Before | 0.00 ± 0.00 | .10 | 0.00 ± 0.00 | .08 |
| After | 0.30 ± 0.18 | 0.16 ± 0.08 | |||
| Inferior | Before | 0.80 ± 0.25 | .0002 | 1.31 ± 0.19 b | .001 |
| After | 2.40 ± 0.29 | 2.16 ± 0.24 | |||
| Corneal staining: severity (modified Baylor scale score) | |||||
| Central | Before | 0.00 ± 0.00 | 1.0 | 0.00 ± 0.00 | .16 |
| After | 0.00 ± 0.00 | 0.21 ± 0.14 | |||
| Nasal | Before | 0.05 ± 0.05 | .06 | 0.05 ± 0.05 | .16 |
| After | 0.40 ± 0.17 | 0.16 ± 0.11 | |||
| Temporal | Before | 0.00 ± 0.00 | .10 | 0.16 ± 0.11 | .65 |
| After | 0.20 ± 0.12 | 0.10 ± 0.10 | |||
| Superior | Before | 0.00 ± 0.00 | 1.0 | 0.00 ± 0.00 | 1.00 |
| After | 0.00 ± 0.00 | 0.00 ± 0.00 | |||
| Inferior | Before | 0.10 ± 0.10 | .08 | 0.10 ± 0.10 | .18 |
| After | 0.40 ± 0.18 | 0.26 ± 0.15 | |||
| Conjunctival staining | Before | 0.48 ± 0.14 | .03 | 0.84 ± 0.13 b | .31 |
| After | 0.75 ± 0.19 | 0.95 ± 0.16 | |||
| Schirmer test (no anesthesia) | Before | 14.30 ± 2.07 | .41 | 10.47 ± 2.05 | .02 |
| After | 16.25 ± 2.38 | 12.47 ± 2.40 |
a Comparison by Wilcoxon test before (pre) and after (post) the 2-hour exposure.
b Significant ( P < .05) differences between the dry eye and asymptomatic control groups before the exposure (Mann–Whitney U test).
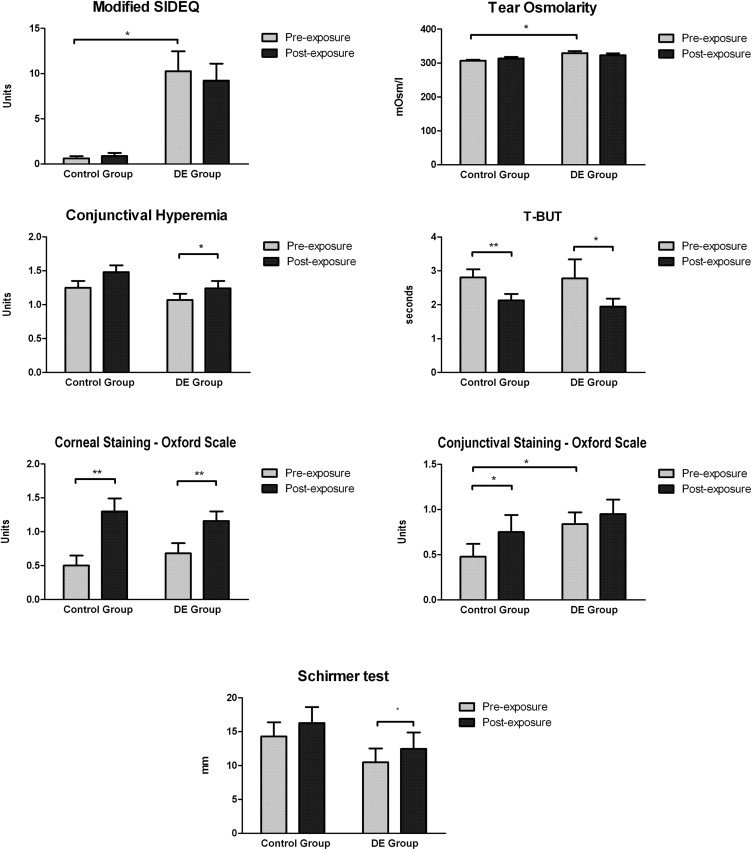
The modified SIDEQ scores, tear osmolarity results, Phenol red thread test results, corneal severity fluorescein staining results, and superior corneal intensity staining results (Baylor scheme) in both groups did not differ significantly ( P ≤ .05) before or after the 2-hour exposure ( Table 1 , Figure 1 ).
The results of 3 tests differed significantly between the dry eye and control groups in addition to the symptom questionnaire results. The tear osmolarity levels were significantly higher in the patients than in the controls ( Table 1 , Figure 1 ), and they did not change significantly after a 2-hour exposure to desiccating environmental stress. Conjunctival lissamine green staining and inferior corneal fluorescein staining also were significantly higher in the dry eye group ( Table 1 , Figure 1 ).
Tear Molecular Levels
Table 2 shows all numerical values. Figure 3 shows the tear molecular values that fluctuated significantly. Among the 16 molecules analyzed in tears, 9 molecules were detected in at least 75% of the samples before and after exposure ( Table 2 ). The detection rates for the other molecules were less than 35% in all cases, and therefore, their levels were not computed for analysis because they were not considered to be relevant.
| Tear Molecules | Exposure | Control Group (Mean ± SEM, pg/mL) | Detection Rate (%) | P Value a | DE Group (Mean ± SEM, pg/mL) | Detection Rate (%) | P Value a |
|---|---|---|---|---|---|---|---|
| MMP-9 | Before | 10 620.5 ± 4494.3 | 100 | 10 054.4 ± 7326.6 | 84 | ||
| After | 16 398.7 ± 5538.3 | 100 | .03 | 25 744.5 ± 13212.4 | 89 | .008 | |
| EGF | Before | 1872.1 ± 340.7 | 95 | 1433.9 ± 313.2 | 95 | ||
| After | 1107.1 ± 173.6 | 95 | .007 | 775.6 ± 133.4 | 95 | .08 | |
| IL-6 | Before | 29.6 ± 5.8 | 75 | 81.4 ± 33.6 | 79 | ||
| After | 54.3 ± 8.3 | 95 | < .001 | 69.7 ± 12.4 | 95 | .17 | |
| CXCL8/IL-8 | Before | 690.8 ± 146.7 | 100 | 999.4 ± 424.2 | 100 | ||
| After | 789.4 ± 145.0 | 100 | .09 | 901.8 ± 211.6 | 95 | .74 | |
| CXCL10/IP-10 | Before | 40 985.7 ± 6603.2 | 80 | 70 146.4 ± 20 696.6 | 95 | ||
| After | 46 328.0 ± 4989.6 | 100 | .31 | 60 903.8 ± 16 454.7 | 89 | .77 | |
| CCL5/RANTES | Before | 16.9 ± 2.7 | 95 | 27.2 ± 3.2 | 79 | ||
| After | 22.5 ± 4.8 | 90 | .28 | 65.4 ± 35.7 | 89 | .41 | |
| IL-1Ra | Before | 7321.9 ± 1197.1 | 100 | 7310.4 ± 2044.9 | 100 | ||
| After | 8196.2 ± 1437.1 | 100 | .68 | 6822.2 ± 2371.7 | 100 | .52 | |
| VEGF | Before | 651.0 ± 153.6 | 80 | 594.6 ± 161.4 | 75 | ||
| After | 649.3 ± 96.7 | 90 | .94 | 613.2 ± 129.1 | 79 | .47 | |
| CX3CL1/fractalkine | Before | 855.1 ± 163.1 | 95 | 1240.2 ± 275.6 | 75 | ||
| After | 970.6 ± 196.6 | 95 | .31 | 1008.8 ± 296.1 | 89 | .58 |
Stay updated, free articles. Join our Telegram channel

Full access? Get Clinical Tree


