Purpose
To investigate the association of spontaneous drusen regression in intermediate age-related macular degeneration (AMD) with changes on fundus photography and fundus autofluorescence (FAF) imaging.
Design
Prospective observational case series.
Methods
Fundus images from 58 eyes (in 58 patients) with intermediate AMD and large drusen were assessed over 2 years for areas of drusen regression that exceeded the area of circle C1 (diameter 125 μm; Age-Related Eye Disease Study grading protocol). Manual segmentation and computer-based image analysis were used to detect and delineate areas of drusen regression. Delineated regions were graded as to their appearance on fundus photographs and FAF images, and changes in FAF signal were graded manually and quantitated using automated image analysis.
Results
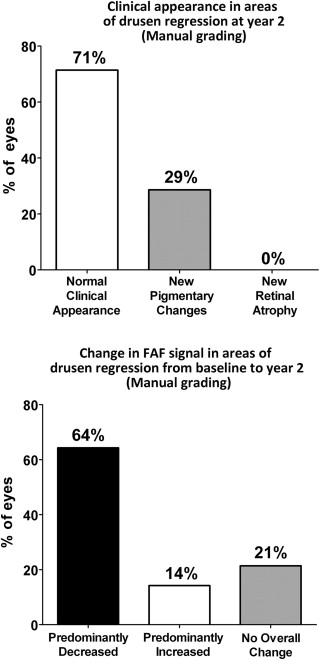
Drusen regression was detected in approximately half of study eyes using manual (48%) and computer-assisted (50%) techniques. At year-2, the clinical appearance of areas of drusen regression on fundus photography was mostly unremarkable, with a majority of eyes (71%) demonstrating no detectable clinical abnormalities, and the remainder (29%) showing minor pigmentary changes. However, drusen regression areas were associated with local changes in FAF that were significantly more prominent than changes on fundus photography. A majority of eyes (64%-66%) demonstrated a predominant decrease in overall FAF signal, while 14%-21% of eyes demonstrated a predominant increase in overall FAF signal.
Conclusions
FAF imaging demonstrated that drusen regression in intermediate AMD was often accompanied by changes in local autofluorescence signal. Drusen regression may be associated with concurrent structural and physiologic changes in the outer retina.
The presence of large soft drusen is a clinical hallmark of intermediate age-related macular degeneration (AMD) that is associated with an increased risk of progression to advanced AMD. Large soft drusen exhibit structural dynamism by demonstrating growth, as well as partial or complete regression, which can occur either spontaneously or in response to laser photocoagulation. What cellular mechanisms underlie drusen regression and how retinal function and AMD progression are affected by its occurrence are incompletely understood. Whether drusen regression can constitute a useful surrogate endpoint in clinical trials on the prevention of AMD progression also remains a topic of some debate.
The purpose of the current study was to examine the incidence of drusen regression in eyes with intermediate AMD and to discover whether drusen regression in the short term may be associated with local changes in the overlying retina. As large soft drusen abut the adjacent retinal pigment epithelium (RPE) layer, alterations in drusen size per se, and/or the processes that drive or accompany drusen regression, may influence the health and function of adjacent RPE cells. Fundus autofluorescence (FAF) imaging, which relies primarily on the fluorescence generated from bisretinoid compounds accumulated in RPE cells, has been demonstrated to reveal clinically significant alterations in the anatomic and physiological state of the outer retina. In the current study, we employed this modality to discover whether the events surrounding drusen regression were accompanied by changes in the outer retina. Our findings here are relevant to the significance of drusen regression in the natural history of AMD and may relate to the mechanisms by which large soft drusen confer risk on AMD progression.
Methods
Study Subjects
The present study was a prospective observational case series derived from fundus images obtained from participants in the Age-Related Eye Disease Study 2 (AREDS2; ClinicalTrials.gov Identifier # NCT00345176 ) protocol. Sixty participants were enrolled at the National Eye Institute site for the AREDS2 study between March 2007 and July 2008 who met the following enrollment criteria at the baseline visit: (1) age between 50 and 85 years; (2) presence of large drusen (≥125 μm in diameter) in both eyes, or large drusen in 1 eye and advanced AMD (defined as the presence of choroidal neovascularization, central geographic atrophy, or disciform scarring) in the fellow eye. Participants were characterized by multimodal imaging at baseline and at 2 years. As the present study aims to examine drusen changes in eyes with intermediate AMD over this time period, eyes that contained or developed advanced AMD were identified and excluded from analysis. Eyes that (1) were without advanced AMD at baseline and (2) did not progress to advanced AMD by the year-2 visit were identified as eligible eyes. Each study participant was permitted to contribute at most 1 eye to the analysis; when both eyes were eligible, 1 of the 2 eyes was randomly selected. This inclusion process resulted in a total of 58 eyes in 58 patients that constituted the population of study eyes analyzed in the present study. Informed consent was obtained from all study participants. The study design was prospectively approved by the National Institutes of Health Combined Neuroscience Institutional Review Board. Informed consent was obtained from all participants, and the study was conducted in accordance with Health Insurance Portability and Accountability Act regulations and adhered to the tenets of the Declaration of Helsinki.
Fundus Imaging
Retinal imaging of study eyes was performed with color fundus photography, red-free monochromatic fundus photography, and modified fundus camera–based fundus autofluorescence (mFC FAF) imaging at study baseline and at the year-2 follow-up visit. Participants had their pupils dilated to 6 mm or larger with 2 sets of 2.5% phenylephrine and 1% tropicamide ophthalmic drops prior to imaging. Images were captured using a retinal camera with a 30-degree magnification setting according to a modified 3-standard field protocol; field 2 of the macula was used for image analysis. Color fundus photographs were obtained using an ultra-high-resolution (2392 × 2048 pixels) color camera (Ophthalmic Imaging Systems, Sacramento, California, USA). Monochromatic red-free fundus photographs were captured using a 12-bit ultrasensitive grayscale charge-coupled device camera (1376 × 1036 pixels; Ophthalmic Imaging Systems) and a Topcon factory-installed green filter (550-580 nm). FAF images were captured using a Topcon 50-EX retinal camera (Topcon Medical Systems, Oakland, New Jersey, USA) adapted for autofluorescence imaging using the modifications described by Spaide and connected to an Ophthalmic Imaging Systems WinStation 5000 digital capture system. Band-pass filters for excitation (550-600 nm) and emission (660-800 nm) were used for FAF imaging. Color images were stored in 24-bit red-green-blue (RGB) color format (8 bits for each of red, green, and blue channel data). Monochromatic red-free and mFC FAF images were stored in 8-bit grayscale format.
Image Processing
For each study eye, fundus images from all 3 imaging modalities (color fundus photography, monochromatic red-free fundus photography, and mFC FAF) at baseline and year-2 were spatially registered using the ImageJ imaging processing software (version 1.44f; National Institutes of Health; Bethesda, Maryland, USA) and the TurboReg plug-in (version June 19, 2008; Biomedical Imaging Group, Swiss Federal Institute of Technology Lausanne, Lausanne, Switzerland) employing bilinear transformation. Color RGB images were registered by splitting RGB channel data as an RGB stack, selecting of landmarks in the green channel, and recombining RGB channel data to create a registered color RGB image. The accuracy of image registration was individually confirmed by 2 independent reviewers (B.T., M.I.) and the registration refined to achieve accuracy between imaging modalities.
To facilitate the longitudinal comparison of fundus images, registered images from each imaging modality at baseline and at year-2 were normalized with respect to each other using tools within ImageJ, which included the automatic window and level adjustment tool and the rolling paraboloid background subtraction tool, in order to achieve normalized grayscale distributions in longitudinal images. Pre- and postprocessing images were independently reviewed by 3 graders (B.T., M.I., N.K.) to verify the absence of image obscuration or artifact.
Manual Segmentation and Grading of Areas of Drusen Regression
Registered color and red-free fundus images at baseline and at year-2 were inspected, and areas of drusen regression at year-2 (relative to baseline) were identified. Areas of drusen regression greater than, or equal in size to, circle C1 (of diameter 125 μm, as described in the AREDS AMD grading protocol) were circumscribed by planimetry using the draw tool in ImageJ to delineate regions of interest (ROIs) within which drusen regression was observed. ROI outlines were overlaid onto color fundus photographs and monochromatic red-free images at year-2, and the overall clinical appearance of these ROIs was graded according to 1 of the 3 following categories: (1) no observable clinical feature distinct from background; (2) development of new pigmentary changes at year-2; or (3) development of new retinal or RPE atrophy at year-2. The same ROIs were also overlaid onto mFC FAF images at baseline and at year-2. The FAF patterns within the ROIs were compared between baseline and year-2, and changes in overall FAF signal within the ROIs at year-2 (relative to baseline) were manually graded according to 1 of the 3 following categories: (1) predominant decrease in the overall level of autofluorescence; (2) predominant increase in the overall level of autofluorescence; or (3) no overall change in the overall level of autofluorescence.
Computer-Assisted Delineation of Areas of Drusen Regression
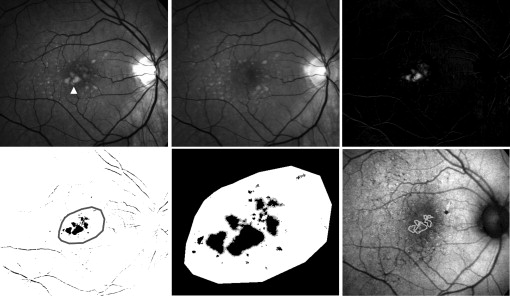
A semi-automated method of image processing was performed in parallel to manual segmentation and grading. In order to automate the delineation of areas of drusen regression in individual study eyes, monochromatic red-free fundus images at baseline and year-2, which had been registered and normalized, were subjected to image subtraction using ImageJ. The image calculator tool was employed to perform pixel-by-pixel image subtraction of the year-2 image from the baseline image. As areas of drusen appear brighter than the normal fundus background, areas of drusen regression appeared on the subtraction image as areas of preferentially increased pixel intensity ( Figure 1 , Top row). Standardized automated thresholding using isodata binarization was applied to the subtraction image to sharply delineate general areas of drusen regression ( Figure 1 , Bottom left). Specific areas of drusen regression were individually identified and tagged using the automated particle analysis tool in ImageJ; ROIs with areas smaller than the area of circle C1 were excluded. The remaining areas were used to define drusen regression ROIs ( Figure 1 , Bottom middle) and characterized in the subsequent analysis of changes in FAF pattern ( Figure 1 , Bottom right).
Computer-Assisted Quantification of Fundus Autofluorescence in Fundus Autofluorescence Images
We developed a semi-automated method to quantitatively characterize changes in FAF within areas of drusen regression. As manual grading of areas of hyperautofluorescence and hypoautofluorescence in FAF images relies on comparisons that the grader makes between these areas and the overall level of “normal background” autofluorescence, our computer-assisted algorithm simulated this comparison by first measuring the grayscale level of FAF in areas that were considered to be of “normal background” autofluorescence. In this process, 2 graders (B.T., M.I.) independently inspected mFC FAF images at baseline and at year-2 and then manually delineated 3 separate ROIs that were representative of “normal background” autofluorescence ( Figure 2 , Top left). The 2 graders were masked to whether an image was at “baseline” or “follow-up.” The criteria used for the delineation of these “background” ROIs were that at both baseline and at year-2, these areas should: (1) contain uniform levels of background FAF; (2) be located outside areas of drusen, drusen regression, and other retinal pathology; and (3) be selected in areas at the same approximate radial distance from the fovea as the relevant drusen regression ROIs for that study eye. The use of this reference accounted for individual variations in macular pigment distribution, which generally varies with distance from the fovea. The background ROIs were independently reviewed by a third grader (N.K. or W.W.) to verify conformity to these criteria. The distribution of grayscale levels of all the pixels located in these “background” ROIs within a given eye was represented in a histogram ( Figure 2 , Top right), and the mean ± standard deviation (SD) for this distribution was calculated.
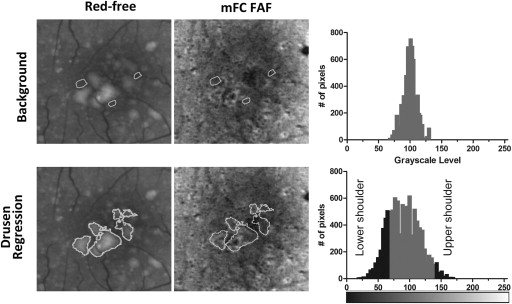
The drusen regression ROIs defined earlier for the same study eye were then superimposed onto mFC FAF images from baseline and year-2 for characterization of the patterns of FAF located within these ROIs relative to background levels ( Figure 2 , Bottom middle). We defined a given pixel within the ROI to have “increased FAF signal” when its grayscale level exceeded that of the mean background grayscale level by greater than 3 times the standard deviation (SD) of the background grayscale distribution (ie, when pixel grayscale level > [mean background grayscale level + 3 SD]). Conversely, a pixel had “decreased FAF signal” when pixel grayscale level < (mean background grayscale level – 3 SD) ( Figure 2 , Bottom right). In this way, the numbers of pixels with (1) increased FAF (upper shoulder of histogram) and (2) decreased FAF (lower shoulder of histogram) were computed in the drusen regression ROIs of each eye for baseline and year-2 mFC FAF images separately. The absolute and percentage changes in areas of increased and decreased autofluorescence signal were then calculated between baseline and year-2. If the changes in the areas of increased and decreased FAF were relatively equal (±5%), the overall change in FAF was categorized as “no overall change in the overall level of autofluorescence.” If the change in the area of either decreased or increased FAF predominated, then the overall change in FAF was categorized as either “predominantly decreased” or “predominantly increased,” respectively.
Results
Prevalence of Drusen Regression in Eyes with Intermediate Age-Related Macular Degeneration
Study eyes (n = 58) were assessed for the presence of significant drusen regression between baseline and year-2. Two methods of analysis were performed in parallel: (1) manual segmentation and (2) computer-assisted delineation based on image subtraction. On manual segmentation of baseline and year-2 follow-up fundus images of 58 study eyes, 28 eyes (48%) were identified as demonstrating at least 1 area of drusen regression exceeding circle C1 (125 μm) in area. In comparison, computer-assisted delineation of drusen regression identified a similar proportion of eyes (50%, 29/58) as having met this criterion. Agreement between the 2 methods was very good (Cohen κ = 0.91 ± 0.05), with 27 eyes being similarly identified as having significant drusen regression by both methods. One eye identified by manual segmentation was not identified by computed-assisted delineation, while 2 eyes identified by computed-assisted grading were not identified by manual segmentation. These 3 discordant eyes were “borderline” cases in which the largest area of drusen regression was close to the area of circle C1.
Manual Grading of Clinical and Fundus Autofluorescence Changes in Areas of Drusen Regression
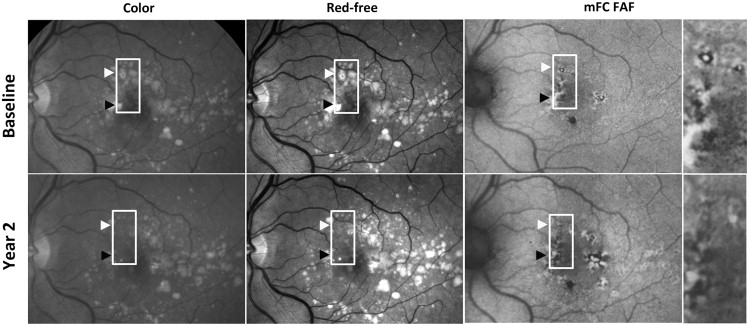
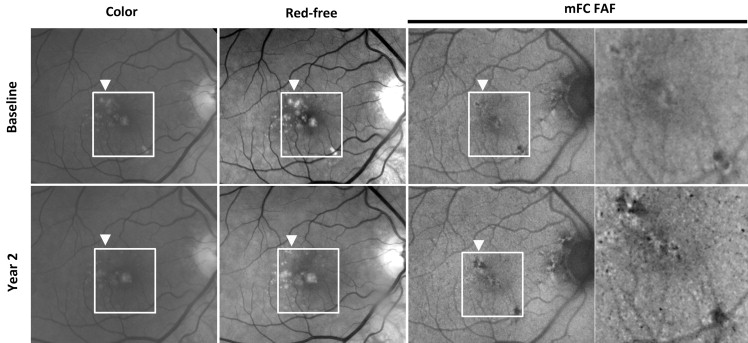
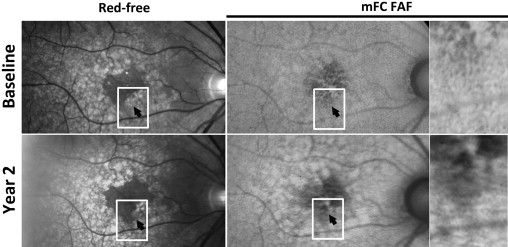
For study eyes that were identified on manual segmentation to have met criteria for drusen regression (n = 28), multimodal fundus images (color, red-free, mFC FAF) captured at baseline and year-2 were registered and inspected in parallel. Figures 3-5 illustrate representative examples of drusen regression and their appearance on multimodal imaging in analyzed eyes. These representative individual examples illustrate that retinal areas of drusen regression appeared clinically unremarkable on color and monochromatic photography in the majority of cases. In these areas that were previously occupied by drusen, the retina either had a normal clinical appearance or developed small amounts of new pigment clumping. However, on FAF imaging, these same areas typically demonstrated clear changes in the local patterns of autofluorescence that were considerably more prominent than the clinically observable changes.
Areas of drusen regression, delineated as “regions of interest,” were overlaid on color fundus and red-free photographs and graded ( Figure 6 , Top). In the majority of graded eyes (71%, 20/28 eyes), these areas had a clinical appearance that was devoid of retinal pathology and indistinguishable from neighboring fundus areas uninvolved with AMD lesions (drusen or pigmentary changes). A minority of eyes (29%; 8/28 eyes) had some evidence of new pigmentary changes that were not apparent at baseline. None of the graded eyes was noted to have clinically evident geographic atrophy or neovascular change in the areas of drusen regression.
Stay updated, free articles. Join our Telegram channel

Full access? Get Clinical Tree


