Purpose
To evaluate the validity and test–retest reliability of a contour-based 3-dimensional (3-D) monitor distance stereotest (distance 3-D stereotest) and to measure the maximum horizontal disparity that can be fused with disparity vergence for determining the largest measurable disparity of true stereopsis.
Design
Observational case series.
Methods
Sixty-four normal adult subjects (age range, 23 to 39 years) were recruited. Contour-based circles (crossed disparity, 5000 to 20 seconds of arc; Microsoft Visual Studio C ++ 6.0; Microsoft, Inc, Seattle, Washington, USA) were generated on a 3-D monitor (46-inch stereoscopic display) using polarization glasses and were presented to subjects with normal binocularity at 3 m. While the position of the stimulus changed among 4 possible locations, the subjects were instructed to press the corresponding position of the stimulus on a keypad. The results with the new distance 3-D stereotest were compared with those from the distance Randot stereotest.
Results
The results of the distance 3-D stereotest and the distance Randot stereotests were identical in 64% and within 1 disparity level in 97% of normal adults. Scores obtained with the 2 tests showed a statistically significant correlation ( r = 0.324, P = .009). The half-width of the 95% limit of agreement was 0.47 log seconds of arc (1.55 octaves) using the distance 3-D stereotest—similar to or better than that obtained with conventional distance stereotests. The maximum binocular disparity that can be fused with vergence was 1828 ± 794 seconds of arc (range, 4000 to 500).
Conclusions
The distance 3-D stereotest showed good concordance with the distance Randot stereotest and relatively good test–retest reliability, supporting the validity of the distance 3-D stereotest. The normative data set obtained from the present study can serve as a useful reference for quantitative assessment of a wide range of binocular sensory abnormalities.
Distance stereoacuity can be measured with the distance Randot stereotest (Stereo Optical Co, Inc., Chicago, Illinois, USA) or Frisby-Davis distance stereotest (Frisby Stereotest, Sheffield, United Kingdom). However, there are some limitations to these stereotests. First, these stereotests cannot measure stereoacuity worse than 400 seconds of arc (arcsec). Second, the predefined intervals of these distance stereotests are less compact in the range of small disparities (≤ 400 arcsec) than that of near stereotests such as the Randot Preschool stereotest or Frisby near stereotest. Third, these tests consist of a predefined answer that could cause learning effects if repeated several times. Finally, their results are affected by the state of illumination in the examination room because they have no self-emitting devices.
The introduction of a 3-dimensional (3-D) stereoscopic monitor enables clinicians to evaluate stereopsis using more variable stereograms and more quantitative methods. Fujikado and associates used a 3-D monitor-based stereotest to evaluate stereopsis in children with strabismus. Breyer and associates developed a 3-D monitor-based stereotest to test stereovision in preverbal children. However, these studies were conducted with a small 18-inch 3-D monitor that has relatively low brightness and resolution (100 cd/m 2 , 640 × 480 pixels; 58 cd/m 2 , 640 × 1024 pixels; respectively). This limits its ability to display a broad range of disparities with desirable luminance to perform general-purpose tasks. Furthermore, this monitor has a short viewing distance that cannot measure distance stereoacuity.
In this study, we developed a contour-based stereotest using a large 46-inch, high-brightness, and high-resolution 3-D monitor, which can measure a wide range (5000 to 20 arcsec) of distance stereopsis with more compact intervals in the range of small disparities. Using this distance 3-D stereotest, we measured the distance stereoacuity of normal young adults. We compared the results from the distance 3-D stereotest with those from the distance Randot stereotest and examined its test–retest reliability. Finally, we measured the maximum horizontal disparity that can be fused with disparity vergence to determine the largest measurable disparity of true stereopsis in normal subjects using this distance 3-D stereotest.
Methods
Patients
Normative data for the distance Randot stereotest were obtained from 64 volunteers with normal binocularity (mean age ± standard deviation, 30.7 ± 4.1 years; age range, 23 to 39 years). Informed consent was obtained from all participants after the details of the study were explained. The inclusion criteria for normal subjects were as follows: (1) best-corrected visual acuity of 20/20 or better in both eyes, (2) no manifest tropia at distance or near fixation with simultaneous and alternate prism cover tests, (3) fusion at 0.33 m and 6 m with the Worth 4-dot test, and (4) no history or presence of ocular or systemic disease. A general ophthalmic evaluation was performed for all subjects, including best-corrected visual acuity, simultaneous and alternate prism cover test with fixation targets at 0.33 and 6 m, Worth 4-dot test at 0.33 and 6 m, the distance Randot stereotest, and the distance 3-D stereotest.
Polarized Stereoscopic Monitor
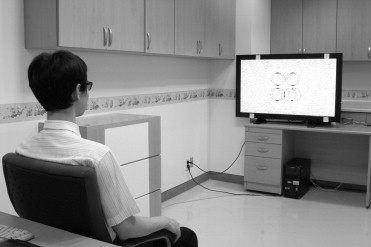
The stimulus was presented on a 46-inch stereoscopic monitor (G460X; Pavonine Co., Inc., Incheon, Korea) with the background luminance of 250 cd/m 2 (785 lux), resolution of 1920 × 1080 pixels, and contrast ratio of 1800:1 ( Figure 1 ). Two images were displayed on the same monitor through different polarizing filters to present a stereoscopic stimulus. The subject wore glasses that also contained a pair of different polarizing filters. Each pair of filters allows light that has the same polarization state to pass through and blocks light that has an orthogonal polarization state, thus producing different stimuli for each eye.
Contour-Based Circle Stereogram
Contour-based circles with a diameter of 14 cm and a wide range of crossed horizontal disparities (5000 to 20 arcsec) were generated on the 3-D monitor. Four circles were placed at the edges of a square with a distance of 16 cm between circles. The inside and outside of circles were filled with random dot textures to eliminate monocular cues ( Figure 1 ). The circle stimuli were programmed in Visual C ++ using Visual Studio (version 6.0; Microsoft, Inc., Seattle, Washington, USA).
Subjects viewed the stereogram at a distance of 3 m while wearing polarizing glasses. The room illumination was recorded as 250 to 300 lux, measured in front of the eye level of the subject by an illuminance meter (T-10; Konica Minolta, Tokyo, Japan). While the position of the stereoscopic stimulus was changed among the 4 possible locations, the subjects were instructed to press the corresponding position of the stimulus on a keypad. Testing commenced with coarse disparities that progressively became smaller as follows: 5000, 4000, 3500, 3000, 2500, 2000, 1500, 1000, 800, 600, 500, 400, 300, 200, 150, 100, 70, 60, 50, 40, 30, 25, and 20 arcsec.
We measured the stereoacuity threshold and the maximum binocular horizontal disparity that could be fused with disparity vergence with the distance 3-D stereotest. The stereoacuity threshold was defined as the smallest disparity level at which a subject could detect a protruded circle; the maximum binocular horizontal disparity that could be fused with vergence was defined as the largest disparity level at which a subject could perceive the stereogram as a single circle. Because of the possibility of monocular cues providing false-positive responses at thresholds of 400 to 20 arcsec, those levels were reassessed monocularly. This monocular testing phase was carried out after the threshold had been reached and was performed to ensure that the threshold score reflected a binocular response. In our study, no patients who achieved a threshold of 400 to 20 arcsec were able to achieve the same levels monocularly. Each test was administered following a standardized testing protocol. The results of this distance 3-D stereotest were compared with those of the distance Randot stereotest.
Distance Randot Stereotest
Distance stereoacuity was quantified using the random dot-based distance Randot stereotest (version 2; Stereo Optical Co, Inc.), because there is no available contour-based distance stereotest. This test is a Polaroid vectograph-based distance stereotest that is sensitive to disturbances or changes of distance binocularity. Subjects viewed the stereogram at a distance of 3 m while wearing polarizing glasses. The room illumination was recorded as 250 to 300 lux measured in front of the eye of the subject by the same illuminance meter mentioned previously. Each level of disparity consisted of two shapes. Testing began with coarse disparities that progressively became smaller as follows: 400, 200, 100, and 60 arcsec. This is less compact than the distance 3-D stereotest and the near stereotests, such as the Randot Preschool stereotest with test disparities of 800, 400, 200, 100, 60, and 40 arcsec. If both responses were correct, testing proceeded to the next disparity until the subject could not identify either shape. The smallest disparity at which a subject identified both shapes correctly was recorded as the stereoacuity threshold. The tests were administered in the following order: distance 3-D stereotest (initial test), distance Randot stereotest, and distance 3-D stereotest (retest).
Statistical Analyses
Continuous values were expressed as mean ± standard deviation. Stereoacuity values were transformed to log arcsec for analysis. To evaluate the concordance of the distance 3-D and the distance Randot stereotests, stereoacuity results were grouped into 4 categories as fine (20 to 60 arcsec), moderate (70 to 200 arcsec), coarse (250 to 800 arcsec), and nil (> 800 arcsec). The Wilcoxon matched pairs test was used to compare the stereoacuity test scores between distance 3-D and distance Randot stereotests. Because of the noncontinuous scale of stereotest scores, the Spearman correlation test was used to test the validity of the distance 3-D stereotest. Differences between test and retest scores were calculated for each subject using the results of the distance 3-D stereotest. The 95% limits of agreement were calculated. These values then were converted back to octave steps, which also can be described as doublings. Each doubling of the stereoacuity threshold corresponds to a change of 0.3 in the log transformed value; therefore, we divided the 95% limit of agreement values by 0.3 to calculate the number of octaves. Agreement between scores also was represented as Bland–Altman plots. Statistical analysis was performed using GraphPad Prism software (version 5.0; GraphPad Software, San Diego, California, USA). Results were interpreted as statistically significant when P values were less than .05.
Results
Normative Data and Validity
Stereoacuity threshold scores were 43.3 ± 32.9 arcsec (range, 180 to 20 arcsec) using the distance 3-D stereotest and 103.4 ± 86.2 arcsec (range, 400 to 60 arcsec) using the distance Randot stereotest. Stereoacuity threshold scores were better with the distance 3-D stereotest, and this was statistically significant ( P < .0001, Wilcoxon matched pairs test; Figure 2 ). A multivariate logistic regression analysis revealed that age, visual acuity, and eye alignment were not significantly correlated with the stereoacuity scores.
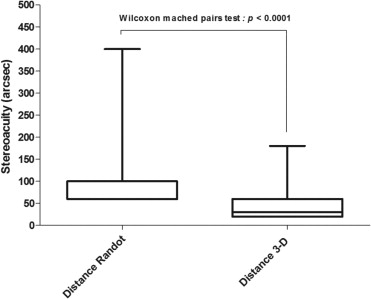
Table 1 shows the concordance of distance 3-D and distance Randot stereotests in normal adults. The results for the 2 stereotests were identical in 64.1% and within 1 disparity level in 96.9% of normal adults. Scores obtained with the use of the 2 tests demonstrated a statistically significant correlation ( r = 0.324; P = .009, Spearman correlation test).
| Distance Randot (arcsec) | Distance 3-D (arcsec) | |||
|---|---|---|---|---|
| 800 to Nil | 250 to 800 | 70 to 200 | 20 to 60 | |
| 800 to Nil | 0 | |||
| 250 to 800 | 0 | 2 | 2 | |
| 70 to 200 | 8 a | 15 | ||
| 20 to 60 | 4 | 33 a | ||
Stay updated, free articles. Join our Telegram channel

Full access? Get Clinical Tree


