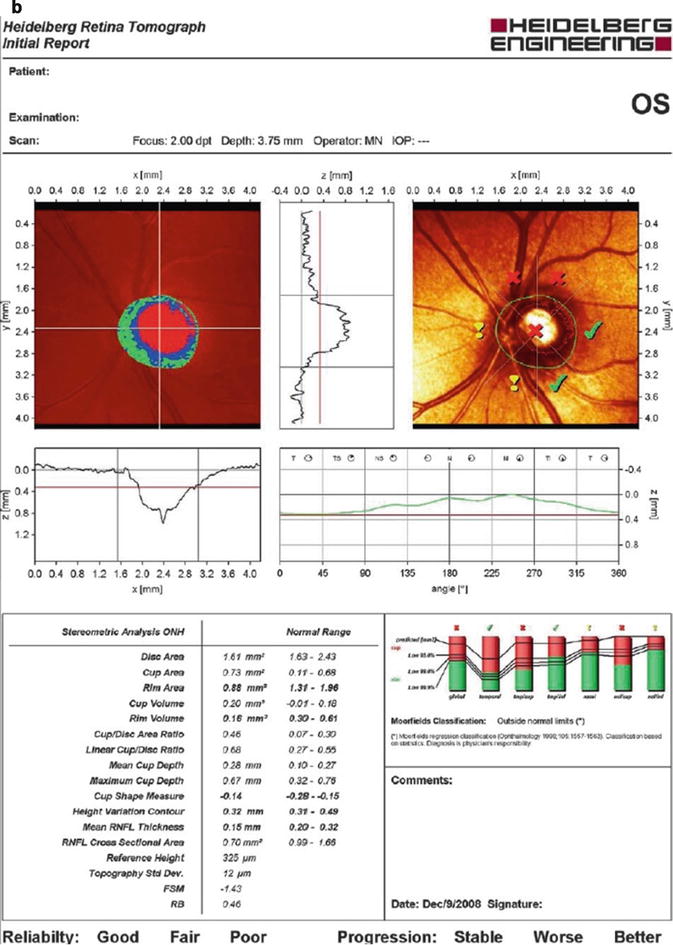
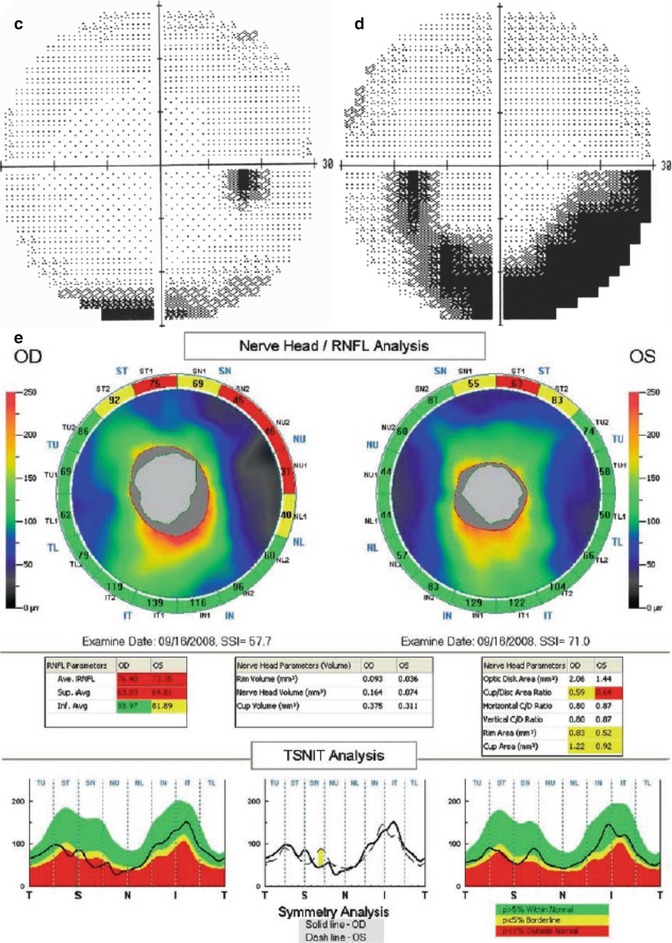
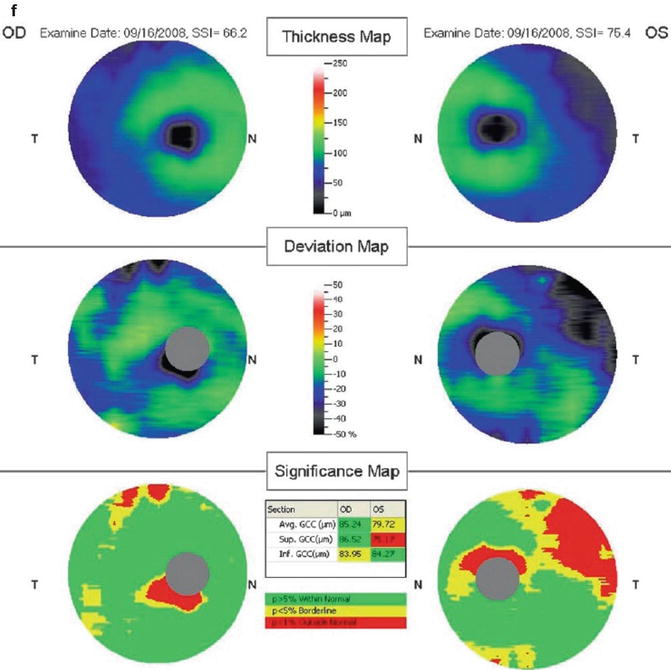
Fig. 8.1
This is a 53-year-old patient with normal-tension glaucoma. These are the confocal scanning laser ophthalmoscopy (CSLO) images of the optic nerves showing (a) significant loss in the supero-nasal region of the right eye and (b) substantial loss in the superior regions of the left eye. The visual fields demonstrate corresponding loss in (c) the inferior field of the right eye and (d) dense inferior arcuate loss in the left eye. (e) The spectral-domain optical coherence domain (SD-OCT) (RTVue, Optovue, Inc., Fremont, CA) imaging of the retinal nerve fiber layer shows loss of the supero-nasal loss in the right eye and superior loss in the left eye. (f) The ganglion cell complex scan shows a superior area of loss in the right eye and a large area of superior loss in the left
For progression analysis, subsequent topographic maps are compared to baseline examinations. Statistically significant changes in the local surface height relative to the baseline examination are then highlighted and quantified. Similar to the GPS, progression analysis does not require user input.
Scanning Laser Polarimetry
Polarized light undergoes a phase shift as it passes through a birefringent structure such as the RNFL. The scanning laser polarimeter (SLP) (GDx, Zeiss Meditec, Inc., Dublin, California) scans the optic nerve with a 780-nm laser beam and detects this change in phase shift or retardation. Since retardation is proportional to RNFL thickness, the detected signal can be used to create an RNFL thickness map. A circumlinear scan, 3.2 mm in diameter and centered on the optic disc, is used to generate what is commonly known as a “TSNIT” plot (Temporal-Superior-Nasal–Inferior-Temporal). The inferior and superior poles represent the thickest portions of the RNFL in normal controls; therefore, the TSNIT plot appears as a “double hump.” Some of the parameters presented are based on the RNFL thickness measurements of the calculation circle; however, the nerve fiber indicator (NFI, a summary value that is intended to represent the likelihood of glaucomatous RNFL loss) is based on the entire RNFL thickness map. A progression algorithm utilizes data based on the entire image, outside the calculation circle.
The cornea and lens also possess birefringent properties. Early versions of the GDx assumed this anterior segment birefringence was the same for all patients, which often created aberrant RNFL thickness maps. The most current version of the GDx incorporates a corneal compensation mechanism (GDx Variable Corneal Compensator (VCC)). A scan taken through the fovea, which lacks any RNFL tissue, contains the total anterior segment birefringence. This value is subtracted from the global scan to isolate the RNFL birefringence.
Optical Coherence Tomography
Optical coherence tomography (OCT) produces high-resolution cross-sectional images of ocular tissues based on optical backscattering, akin to ultrasound technology. The optical backscattering of low-coherence laser light (850 nm) as it passes through layers of differing optical density is recorded by an interferometer to construct a 2-dimensional image of the scanned area. Mirrors are used to scan the laser beam physically through the tissue in the x–y plane and along the z-axis as a function of time. This acquisition technique is referred to as time-domain OCT (TD-OCT). The third-generation Stratus OCT (Zeiss Meditec, Inc., Dublin, California) is the TD-OCT in most widespread use. Similar to the GDx the Stratus OCT generates a circumlinear scan (slightly larger at 3.4 mm diameter) centered on the optic disc, resulting in a TSNIT plot with a “double hump” configuration. The patient’s TSNIT RNFL profile is compared to a normative database in order to highlight diffuse and focal defects. An optic disc algorithm captures three axial scans through the center of the disc, determines the disc margin in these scans by locating the edge of the retinal pigment epithelium, and utilizes data interpolation to produce an image of the optic nerve head. Various optic nerve structural parameters similar to those displayed on the HRT are then determined. In addition, algorithms are available to calculate and display total macular thickness.
Spectral-Domain Optical Coherence Tomography
The recently developed technique of spectral-domain OCT (SD-OCT) takes advantage of the fact that structural information unique to the tissue of interest is encoded in the frequency spectrum of the backscattered signal. Processing this signal through a spectrometer extracts this structural information much more rapidly than the manual scanning employed in TD-OCT, allowing for faster acquisition times, better resolution (4–5 μm range), less motion artifact, and larger volumes of structural data. Three SD-OCT devices approved for clinical use are the Cirrus (Zeiss Meditec, Inc., Dublin, California), Spectralis (Heidelberg Engineering, Heidelberg, Germany), and RTVue (Optovue, Inc., Fremont, California). All three machines provide RNFL thickness maps, TSNIT plots, and ONH analysis. Using a segmentation algorithm, the RTVue and Cirrus also display the thickness of the macular ganglion cell complex (GCC) comprised of the RNFL, ganglion cell layer and inner plexiform layer.
Are These Devices Able to Detect Glaucoma?
A recent evidence-based assessment of ONH and RNFL analyzers was conducted and published by the Ophthalmic Technology Assessment Committee of the American Academy of Ophthalmology [4]. In the vast majority of publications, the glaucomatous (“diseased”) group was comprised of patients who had visual field loss. These patients, as noted previously, have more advanced glaucoma. The ability to distinguish normal from advanced glaucoma is biased toward greater detectability. In practice, the devices have more potential usefulness when they can detect glaucoma at a pre-perimetric stage when visual field defects are absent.
Published evidence will be provided for each device. The ability of a test to distinguish between pathologic and normal states is described in the literature by the area under the receiver operator curve (AUROC). It is a graphic representation of the sensitivity plotted against (1-specificity). Values for the AUROC range from 0.5 to 1, with the latter value representing the ideal test to discriminate disease from normal.
CSLO
Numerous studies have demonstrated the ability of the HRT I to discriminate glaucoma associated with VF loss from normal (Fig. 8.1a–d). In a paper by Miglior et al. [5] the Moorfields Regression Analysis (MRA) was compared with the multivariate discriminant analysis. The authors found better specificity with the Moorfields algorithm (94 % vs. 75 % by multivariate discriminant analysis), but better sensitivity using the multivariate analysis (83 % vs. 74 % by MRA). Others have also used different software algorithms to separate glaucomatous from control cases with varying success [6–9].
In the Ocular Hypertension Treatment Study, the HRT I was used in a subset of the participating sites, and a retrospective analysis of parameters that predicted glaucoma was analyzed [10]. Glaucoma was defined as an endpoint when there was a change in the optic disc consistent with glaucoma damage and/or development of repeatable VF defects. The most predictive parameters were mean height contour, rim area, and mean cup depth.
Studies on HRT II and HRT III have also shown very good detection of perimetric glaucoma [11–13]. Harizman et al. compared the MRA of HRT II and the GPS of HRT III for the detection of perimetric glaucoma [13]. Sensitivity and specificity were 77 and 90 % for GPS and 71 and 92 % for MRA, respectively.
GDx
Studies comparing the uncompensated GDx and the GDx VCC revealed better discriminate function with the VCC [14–17]. One explanation is that inadequate corneal compensation can lead to widening of the normal range, thus masking true glaucomatous defects in the RNFL [17].
Using various parameters or algorithms, the GDx VCC has shown an excellent ability to detect glaucoma [18–22]. Bowd et al. [18] used two machine learning classifiers that both had similar AUROCs (0.90 and 0.91). Essocket al. [19] and Medeiros et al. [20] evaluated Fourier-based algorithms that yielded high AUROCs (0.938–0.978) for glaucoma detection. In a separate paper, Medeiros et al. [21] compared GDx VCC parameters with RNFL photography scores. Both methods demonstrated good correlations for damage in corresponding hemiretinas, although the best GDx VCC parameter had an AUROC (0.91 for NFI) higher than the best RNFL photography score (0.84 for global score). A subsequent publication by Medeiros et al. [22] used ONH progression by stereoscopic disc photographs as the criterion for glaucoma diagnosis. Again the NFI was the best parameter, with an AUROC of 0.94 for eyes with perimetric loss at the baseline and 0.89 for pre-perimetric eyes. Among standard GDx VCC parameters, the NFI provided the highest AUROCs (0.87–0.94) in the majority of studies [14, 21, 22].
TD–OCT
Studies have evaluated RNFL measurement by TD-OCT and its relationship to glaucoma diagnosis or VF loss [23–25]. Quadrants that correlated with the highest AUROCs were the superior and inferior quadrants (0.79–0.952, superior; 0.863–0.971, inferior) for distinguishing eyes with glaucomatous VF loss from controls [26–30]. When individual clock hours were assessed, the 6, 7, 11, and 12 clock hours (in right eyes), representing the inferior/inferior–temporal and superior/superior–temporal areas of the optic nerve, had higher AUROCs than other clock hours [27, 28, 30]. Overall, Stratus OCT had higher AUROCs than OCT II. Studies comparing controls versus glaucoma suspects found lower AUROCs than for perimetric glaucoma [28–30]. Recently, Lalezary et al. found that thinner RNFLs on baseline OCT II are predictive of glaucomatous change in glaucoma suspects [31].
ONH and macular scans have also been studied with TD-OCT for their effectiveness in detecting glaucoma [32–37]. Overall, RNFL and ONH scans were superior to macular scans in distinguishing glaucoma [34, 36, 37]. ONH parameters such as C/D ratio and rim area performed very well, with AUROCs similar to the best RNFL parameters.
However, it is essential to recognize that both operator-dependent and patient-specific sources of error exist which can influence TD-OCT RNFL scan quality. Poor signal strength [38–41], myopia [42], scan alignment [43], pupil dilation [44], RNFL peak deviation [45], and cataract [46] may lead to errors in RNFL thickness measurements and glaucoma discrimination ability.
SD-OCT
SD-OCT provides higher resolution RNFL measurements as well as macular segmentation, which provides an additional parameter for glaucoma diagnosis (Figs. 8.1e, f and 8.2). A study by Mori et al. [47] showed the GCC macular volume to have an AUROC = 0.922. Some studies have found macular and RNFL thickness measures to have equivalent diagnostic power [48–50]. In contrast, Huang et al. [51] showed that the RTVue parameter with the best diagnostic capability was the RNFL thickness (AUROC = 0.919). ONH parameters have been noted to have lower diagnostic accuracy than those of the RNFL and GCC [52, 53]. In contrast, both ONH and RNFL parameters of the Cirrus performed equally well in discriminating between glaucomatous and normal eyes [54]. However, disease severity was shown to affect discriminatory ability with the Cirrus [55]. In comparing SD-OCT GCC to TD-OCT macular thickness, Tan et al. found that the GCC parameter had greater diagnostic power with an AUROC of 0.90 [56].
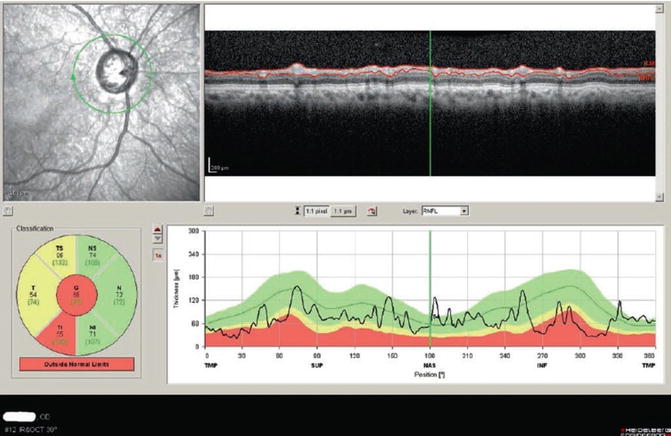
Fig. 8.2
Spectral-domain optical coherence tomography (SD-OCT) (Spectralis OCT, Heidelberg Engineering, Heidelberg, Germany) imaging of the retinal nerve fiber layer (RNFL) in a patient with advanced glaucoma. The irregularity of the circular scan contour likely represents the very high-resolution details of the RNFL
Is One Device Better Than Another?
Comparative studies of Stratus OCT, GDx VCC, and HRT II have revealed minimal or no significant differences. Medeiros et al. [57] compared the three older devices in use today and found similar AUROCs for the best parameters from each instrument: NFI for the GDx VCC (AUROC = 0.91), inferior quadrant for Stratus OCT (AUROC = 0.92), and linear discriminant function of the HRT II (AUROC = 0.86). In the study by DeLeon-Ortega et al. [12] the best parameters were HRT II global cup-to-disc area ratio (AUROC = 0.86), GDx VCC nerve fiber indicator (AUROC = 0.84), and Stratus OCT RNFL thickness (AUROC = 0.84). Pueyo et al. [58] compared the same devices and found excellent discriminate ability for each device: AUROC of 0.90 for MRA of the HRT II, 0.91 for the average RNFL thickness of the Stratus OCT, and 0.88 for the NFI of the GDx VCC. Similar diagnostic performance between the Stratus OCT and the GDx was demonstrated in two studies; [59, 60] however, Schrems et al. found that the Stratus OCT was better in detecting pre-perimetric glaucoma [61] .
Several studies have compared the Cirrus SD-OCT to its predecessor, the Stratus TD-OCT. The majority of comparative studies show the two devices are equivalent in their ability to discriminate between normal and glaucomatous eyes [62–66] although one study demonstrated the superiority of the Cirrus [67].
Currently, very little data on direct comparisons between the newer SD-OCT machines is available. Leite et al. [68] have shown that the Spectralis, Cirrus, and RTVue have similar discriminatory abilities. However, numerous studies have shown that the absolute RNFL thickness measurements between the various optic nerve imaging technologies do not agree [69–75]. Therefore, RNFL thickness values should not be used interchangeably between devices on the same patient.
Are These Devices Able to Accurately Assess Progression?
There is limited available data on the ability of these devices to detect glaucoma progression. Overall, there is significant overlap in the detection of progression by structural and functional criteria, but there are also substantial percentages of glaucoma patients who progress by only one of the measures.
Comparison of the HRT I with VF testing found that although there was considerable overlap of eyes that progressed by both tests, significant numbers of eyes were found to have progressed by only functional or structural criteria [76]. It may be that these tests represent independent indicators of progression. In a study [77] that evaluated glaucoma progression among four groups with different glaucomatous disc types (focal, myopic, senile sclerotic, and generalized), progression rates by HRT (44–82 %) were greater than those by standard automated perimetry (33–57 %), echoing the groups’ earlier reported results [78]. Moreover, there were similarly high rates of progression by either test alone (20–61 %) across the groups. A more recent study found that the HRT II also detected a higher rate of glaucomatous progression when compared to visual field [79].
With regard to TD-OCT, Wollstein et al. [80] also reported higher rates of progression when the structural test was used (25 %) as compared with standard automated perimetry (12 %), although their study population included glaucoma suspects and pre-perimetric glaucoma patients in addition to patients with baseline VF defects. It is unclear if this represents greater sensitivity for progression or hypersensitivity (false positives) of the structural test.
In an observational cohort study of 253 patients by Medeiros et al. [81] glaucoma progression was detected in 13 % by either visual field criteria or serial disc photos. Mean rates of change in average RNFL thickness were significantly higher for progressors compared with nonprogressors. Similar findings were observed in a study using four different criteria for visual field progression [82].
Conclusion and Future Directions
Imaging technologies that analyze the structure of the optic nerve head, retinal nerve fiber layer, and macula provide quantitative information that complements, but does not replace, a thoughtful clinical examination of the optic nerve. Imaging devices are useful adjuncts in the diagnosis and management of glaucoma. No studies have clearly shown that one single device outperforms the others in diagnostic ability. Long-term prospective data on progression analysis is limited. Optic nerve imaging results from any of these devices should be analyzed and interpreted within the clinical context of an individual patient.
References
1.
Quigley HA, Addicks EM, Green WR. Optic nerve damage in human glaucoma III. Quantitative correlation of nerve fiber loss and visual field defect in glaucoma, ischemic neuropathy, papilledema, and toxic neuropathy. Arch Ophthalmol. 1982;100:135–46.PubMed
2.
Kerrigan-Baumrind LA, Quigley HA, Pease ME, Kerrigan DF, Mitchell RS. Number of ganglion cells in glaucoma eyes compared with threshold visual field tests in the same persons. Invest Ophthalmol Vis Sci. 2000;41:741–8.PubMed
Stay updated, free articles. Join our Telegram channel

Full access? Get Clinical Tree


