Clinical practice often is guided by the clever use of diagnostic tests to screen patients for the presence or absence of suspected disease or infection. Test results are woven together with specific patient information to decide on the most appropriate care for each individual. However, the selection of diagnostic procedures are a constant point of contention, as illustrated by the ongoing debate on the appropriate screening strategy for diabetic retinopathy. This type of debate inevitably will continue, given the rapid pace of development of diagnostic tests and procedures, particularly in emerging areas such as genomic and molecular medicine, where tests are being developed to screen not only for preclinical illness, but also for mere disease susceptibility. The selection of diagnostic tests in a clinical context often is not driven as much by the cost of each test, but rather by test performance, patient health, and even the risk of litigation in light of a false-positive or false-negative result. In contrast, widespread population-based screening weighs more heavily the cost effectiveness of a test as well as the public health significance of missed or misdiagnosed cases. From these points of view, one might assume that the underlying disease prevalence in a population is relevant only for population-based screening and not for clinical use; however, correct interpretation of test results in both contexts benefit from a priori knowledge of disease prevalence.
The commercial development of diagnostic tests pass through several generations to produce progressively better-performing assays over time. The tests are established using sample populations in which the disease state (ill or healthy) of each member is known through an accepted gold standard test. (A gold standard refers to a test that has 100% sensitivity and 100% specificity. However, most areas of medical science do not have true gold standard tests, and thus many new diagnostic tests undergo debate regarding their usefulness in detecting disease. Recent statistical advances have helped to improve the evaluation and interpretation of diagnostic tests in the absence of a true gold standard. ) A test is evaluated based on 2 fundamental descriptive qualities: (1) the ability to classify patients correctly as sick or healthy, and (2) consistency of results across populations. These 2 qualities define a test’s clinical utility (the likelihood a test will improve a patient’s management or outcome) and clinical validity (consistency and accuracy of a test to predict a patient’s status). Clinical utility and validity are derived from statistical measures of sensitivity, specificity, positive predictive values (PPVs) and negative predictive values (NPVs), false- versus true-positive results, and true- versus false-negative results. These measures are described below.
Sensitivity Versus Specificity
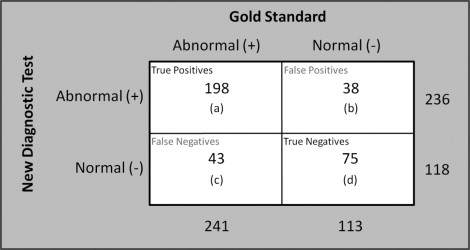
Sensitivity and specificity refer to the intrinsic ability of a test, usually independent of population context, to identify correctly those with the disease as abnormal (sensitivity) and those without a disease as normal (specificity) when compared with the performance of a gold standard. Often, a dichotomous interpretation of a diagnostic test’s results of classifying a patient into 1 of 2 distinct groups is the most practical. Figure 1 illustrates a typical evaluation of a new dichotomous diagnostic test being evaluated against a gold standard. The true-positive rate, or sensitivity, is calculated as [ a /( a + c )]; the true-negative rate, or specificity, is [ d /( b + d )]. These characteristics also can be explained as conditional probabilities. The test in our example ( Figure 1 ) has an 82.2% sensitivity, which is the percent of truly diseased individuals identified, and a 66.4% specificity, which is the percent of healthy individuals correctly identified. Standard statistical techniques can be used to calculate confidence intervals for sensitivity and specificity.
Selecting Cutoffs: When Context Matters
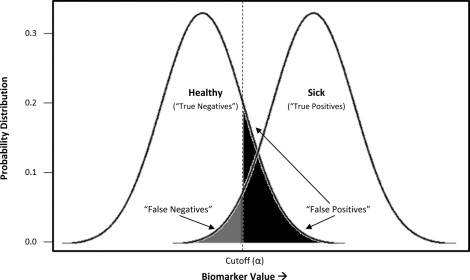
Although dichotomous results are common in the laboratory context, many diagnostic tests are continuous, on a scale, accompanied by an indication of whether the result exceeds the bounds of what is considered normal for that biomarker. In both screening and clinical treatment, it is necessary to establish cutoff values to categorize individuals as diseased or nondiseased. However, this is sometimes problematic, because real population variations can result in different normal ranges of some biologic parameters. The degree of acceptable false positives and false negatives will depend on the consequences of a incorrect diagnosis—a process that includes considerations of whether better (often more expensive) assays are available as a second tier of confirmatory testing, the costs (financial and psychological) of such testing relative to immediate treatment, and the risk to the patient if the condition is not identified early. As illustrated in Figure 2 , depending on what cutoff value (α) is chosen, a subject may be identified correctly as sick (true positive) or healthy (true negative), and a certain rate of ascertainment error can be expected (false positive, false negative). In our example, a cutoff has been chosen to minimize the rate of false negatives, or individuals incorrectly labeled as healthy, at the expense of a larger number of false positives. This would be appropriate for conditions for which misdiagnosing and treating someone as sick is less egregious than missing truly sick individuals.

Another important consideration in selecting an appropriate cutoff for an assay is to consider the population context for which or in which the assay was developed along with the site of its intended use. Enzyme-linked immunosorbent assays often use colorimetric or fluorescent signals that are correlated with the concentration of the target antibody. In contexts of high endemicity of infection, where antigenic overlap may exist with other cocirculating pathogens, or even epitopic cross-reactivity resulting from particular population genetics, the cutoff value established in a nonendemic, largely seronaïve population may prove to be inappropriate. In such cases, one may need to redefine appropriate cutoff values to improve test characteristics (sensitivity, specificity) and performance (PPVs and NPVs). Such a process is elegantly described by Laeyendecker and associates for a commercial herpes simplex type 2 enzyme-linked immunosorbent assay developed in a Western setting, but intended for use in an epidemiologic study in Uganda.
Selecting Cutoffs: When Context Matters
Although dichotomous results are common in the laboratory context, many diagnostic tests are continuous, on a scale, accompanied by an indication of whether the result exceeds the bounds of what is considered normal for that biomarker. In both screening and clinical treatment, it is necessary to establish cutoff values to categorize individuals as diseased or nondiseased. However, this is sometimes problematic, because real population variations can result in different normal ranges of some biologic parameters. The degree of acceptable false positives and false negatives will depend on the consequences of a incorrect diagnosis—a process that includes considerations of whether better (often more expensive) assays are available as a second tier of confirmatory testing, the costs (financial and psychological) of such testing relative to immediate treatment, and the risk to the patient if the condition is not identified early. As illustrated in Figure 2 , depending on what cutoff value (α) is chosen, a subject may be identified correctly as sick (true positive) or healthy (true negative), and a certain rate of ascertainment error can be expected (false positive, false negative). In our example, a cutoff has been chosen to minimize the rate of false negatives, or individuals incorrectly labeled as healthy, at the expense of a larger number of false positives. This would be appropriate for conditions for which misdiagnosing and treating someone as sick is less egregious than missing truly sick individuals.