Purpose
To evaluate the diagnostic capabilities of intereye and intraeye differences in retinal nerve fiber layer (RNFL) thickness and macular thickness for identifying early primary open-angle glaucoma (POAG).
Design
Prospective, cross-sectional cohort study.
Methods
All subjects were enrolled from an ongoing institutional glaucoma study. We used spectral-domain optical coherence tomography (Spectralis; Heidelberg Engineering) to obtain macular thickness (posterior pole asymmetry scan) and RNFL thickness (circumpapillary scan) in both eyes of 50 early POAG and 50 control subjects. Early POAG subjects had glaucomatous optic neuropathy with mild, reproducible visual field loss in at least 1 eye, and control subjects had normal intraocular pressures, visual fields, and optic nerves. We recorded total, superior, and inferior RNFL and macular thicknesses and then calculated intereye and intraeye differences (asymmetry parameters). Statistical evaluation included receiver operating characteristic and multivariate logistic regression analyses.
Results
Intereye macular thickness asymmetry had the highest diagnostic sensitivity (88% at 80% specificity; 83% at 95% specificity), followed by total RNFL thickness (88% at 80% specificity; 75% at 95% specificity). Parameters with the largest areas under the receiver operating characteristic curves were: total RNFL thickness (0.937), intereye RNFL asymmetry (0.921), intereye macular thickness asymmetry (0.913), inferior RNFL thickness (0.905), superior RNFL thickness (0.887), intereye inferior macular thickness asymmetry (0.872), and intraeye macular thickness asymmetry (0.860). These 7 values were not significantly different. In multivariate logistic regression analyses, intraeye macular thickness asymmetry, intereye macular thickness asymmetry, intereye RNFL thickness asymmetry, and total RNFL thickness were related independently to early POAG.
Conclusions
Structural asymmetry parameters performed well, identifying early POAG as well as RNFL thickness. Further study is indicated to validate these results.
Asymmetry is a well-known feature of primary open-angle glaucoma (POAG). Intereye differences in intraocular pressure, central corneal thickness, corneal hysteresis, neuroretinal rim width, and degree of visual field loss all have shown associations with POAG. Indeed, an intereye cup-to-disc ratio difference exceeding 0.2 often is used as a diagnostic criterion for POAG. Additionally, intraeye asymmetry between superior and inferior measures of visual field sensitivity, retinal nerve fiber layer (RNFL) thickness, neuroretinal rim width, and macular thickness also have shown associations with POAG. The glaucoma hemifield test, which compares visual sensitivity between corresponding superior and inferior visual field zones, is a well-known and highly sensitive indicator of early glaucomatous visual field loss.
Asymmetry parameters have clinical advantages compared with raw measurement metrics, primarily because these parameters use the fellow eye or fellow hemisphere for comparison, whereas raw measurement metrics are compared with a normative database that is constructed from many different individuals. Consequently, patient-specific factors such as age, race, gender, and diabetes status that may produce measurement differences between individuals do not influence intereye asymmetry metrics because these qualities are intrinsic to both eyes of an individual. Similarly, eye-specific factors such as axial length and optic nerve morphologic features, which tend to be similar between paired eyes but exhibit wide interindividual variation, have less impact on asymmetry parameters compared with their effect on raw measurement metrics.
Spectral-domain optical coherence tomography (SD OCT) provides rapid, high-resolution, accurate, reproducible, in vivo measurements for many ocular structures, including RNFL thickness and macular thickness. Although prior studies suggest that both RNFL thickness and macular thickness are thinner in eyes with glaucoma, diagnostic capability for RNFL thickness often is found to exceed macular thickness diagnostic capability. Exceptions exist, however, particularly when intraeye macular thickness asymmetry is used instead of measured macular thickness. For instance, when Um and associates divided macular thickness measures into corresponding superior and inferior macular thickness zones and then evaluated symmetry between these zones, they reported that thickness asymmetry between corresponding superior and inferior macular zones was more sensitive than RNFL thickness for detecting early POAG. Inuzuka and associates reported that macular hemifield thickness was reduced in both involved and uninvolved hemiretinas in subjects characterized by field loss in only 1 hemisphere. The authors concluded that retinal structural changes precede the development of visual field loss. Although these latter 2 reports suggest that intraeye macular thickness asymmetry may be beneficial for glaucoma diagnosis, little is known about the relationship between intereye macular thickness asymmetry and glaucoma. We could find only 1 published investigation of intereye macular thickness asymmetry, and that study used normal subjects only. Similarly, we could find only 2 studies that specifically investigated intereye RNFL thickness asymmetry, and both of those studies also included normal subjects only.
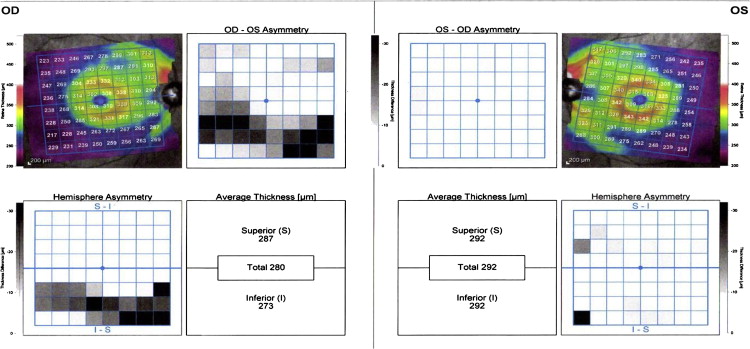
To facilitate the evaluation of macular thickness asymmetry in glaucoma, software recently was made available commercially by Heidelberg Engineering for use within their SD OCT instrument (Spectralis; Heidelberg Engineering, Carlsbad, California, USA). The scanning protocol is labeled “posterior pole asymmetry analysis,” and it acquires macular thickness measurements using 61 high-density raster scans in the macular region. The thickness data then are organized into an 8 × 8 grid (64 separate pixels) that allows direct pixel comparison between corresponding regions of fellow eyes and between corresponding regions of superior and inferior loci of the same eye. Its output includes color-coded maps that highlight regions of relative thinning between eyes and between corresponding hemispheric regions of the same eye ( Figure 1 ). Although these maps provide qualitative information about the spatial aspects of an eye’s glaucoma damage, quantitative thresholds for distinguishing normal from abnormal have not yet been provided by the manufacturer, nor have they been published elsewhere.
Considering that no normative data are available for interpreting posterior pole asymmetry analysis, that few published reports have investigated intereye and intraeye RNFL and macular thickness asymmetry in POAG, that asymmetry is a well-known characteristic of POAG, and that asymmetry parameters have diagnostic advantages compared with raw measured metrics, we designed this study to evaluate structural asymmetry relationships further in POAG using SD OCT technology. Moreover, because asymmetry may be more prominent in early stages of POAG and because early POAG generally is more difficult to identify than moderate or later stages of POAG, we developed this study to explore the relative strengths of both intereye and intraeye macular thickness and RNFL asymmetry parameters for identifying early POAG. By calculating threshold values, sensitivities, and areas under receiver operating characteristic curves for both measured and asymmetry parameters, we planned to compare diagnostic utilities for all parameters while establishing clinical values that may aid the differentiation of normal patients from those with early POAG.
Methods
The study adhered to the tenets of the Declaration of Helsinki, conformed to Health Insurance Portability and Accountability regulations, and was approved by the University of New Mexico Institutional Review Board, and all subjects completed informed consent before study participation. This study was a cross-sectional cohort study using subjects enrolled in a prospective, longitudinal, observational glaucoma research study at the Albuquerque VA Medical Center. The enrollment criteria were: age 40 years or older; open, normal angles in each eye on gonioscopic examination; no corneal or scleral pathologic conditions that could affect intraocular pressure measurement; refractive error of 5 diopters or less and astigmatism of 3 diopters or less; no prior refractive, corneal, or incisional glaucoma surgery, although routine, uncomplicated cataract surgery was allowed; no secondary glaucoma diagnoses; and no visual field loss resulting from nonglaucomatous pathologic features (including retinal, optic nerve, or visual pathway disorders).
Study Protocol
Initial baseline examination included measurement of visual acuity, pupils, refraction, keratometry, axial length, tonometry, and ultrasound pachymetry. Subjects also underwent slit-lamp biomicroscopy, gonioscopy, standard automated perimetry, dilated fundus examination, and SD OCT imaging (Spectralis). Subjects with glaucoma or glaucoma suspicion then were seen at least semiannually, whereas normal subjects generally were seen annually. Semiannual visits included visual acuity measurement, pupil testing, slit-lamp biomicroscopy, tonometry, standard automated perimetry, and RNFL imaging by OCT, whereas annual visits included all the semiannual procedures along with dilated fundus examination and SD OCT posterior pole scans (after asymmetry software was acquired in 2010).
Standard automated perimetry was performed with optimal near-point correction using the Humphrey Visual Field Analyzer II, 24-2 Swedish interactive threshold algorithm standard program (Carl Zeiss Meditec, Inc, Dublin, California, USA). Visual fields were required to meet reliability criteria (false-positive and false-negative rates, <15%; fixation losses, <33%, unless gaze-tracking demonstrated steady fixation, in which case fixation was deemed acceptable). For this study, we calculated average values for mean deviation and pattern standard deviation from the 2 most recent, reliable visual field tests in an effort to reduce the effects of visual field variability.
Subjects
From our longitudinal study database, we identified all subjects who met the diagnostic criteria for early glaucoma (POAG) with early POAG defined by the degree of visual field loss in the worse eye using the Hodapp, Anderson, and Parrish criteria. Diagnostic criteria for glaucoma included clinical findings consistent with glaucomatous optic neuropathy (eg, thinning, excavation, rim erosion, or notch of the neuroretinal rim) in conjunction with glaucomatous visual field defects in at least 1 eye that were reproducible on at least 3 consecutive examinations. The minimum criteria for glaucomatous visual field defect included glaucoma hemifield test results outside normal limits, the presence of at least 3 contiguous test points on the pattern deviation plot with P < .01 and at least 1 at P < .005, not including points on the edge of the field, or both. When the criteria for early glaucoma were met for at least 1 eye, the subject was eligible unless the fellow eye had moderate or worse visual field loss. The level of intraocular pressure was not used as a diagnostic criterion for glaucoma. We also identified all normal subjects from the database. Diagnostic criteria for normal included normal optic nerves, normal visual fields, and all Goldmann applanation intraocular pressure measurements less than 22 mm Hg. All subjects who met these diagnostic criteria and had adequate SD OCT scans, as described below, were included in this investigation.
Spectral-Domain Optical Coherence Tomography
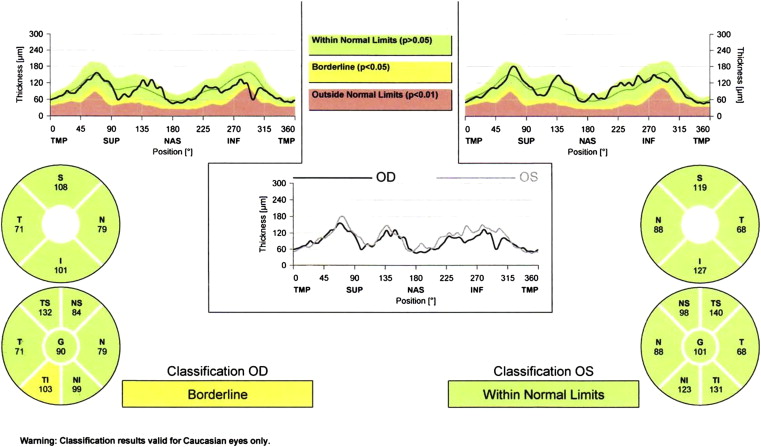
We acquired circumpapillary RNFL scans in both eyes of each subject using the standard 3.4-mm 12-degree circumpapillary nerve fiber layer scan protocol. We excluded images with poor centration, segmentation errors, and scan quality less than 15. We recorded superior, inferior, and total RNFL thickness values from the standard printout for each eye of each subject ( Figure 2 ). To maximize the diagnostic capabilities of the measured RNFL thickness parameters and to mirror clinical practice, we used the lowest of the paired eye RNFL measurements for determining the ability of the measured parameters to identify early glaucoma in a patient. Intereye RNFL asymmetry was defined as the absolute difference between paired eyes, and intraeye RNFL asymmetry was calculated in 2 ways. First, we determined absolute difference between superior and inferior RNFL thickness, and second, we subtracted superior from inferior RNFL thickness to account for physiologic asymmetry (given that in normal eyes, mean inferior RNFL thickness is greater than mean superior RNFL thickness). Because preliminary analyses demonstrated that eyes with glaucoma had lower intraeye RNFL asymmetry values compared with normal eyes, we used the lower value (between the 2 eyes) for statistical analyses.
We obtained macular thickness measurements for each eye using the posterior pole asymmetry scan protocol. This scan protocol, which acquires 61 raster scans per eye, uses an image segmentation algorithm that automatically identifies Bruch’s membrane and the internal limiting membrane and derives thickness data by calculating distances between these structures. After image acquisition, all 61 raster scans were reviewed by one of the authors (C.C.R.) to determine scan validity. Scans were excluded if more than 4 of 61 raster scans had significant segmentation errors; image signal prevented accurate boundary detection for Bruch’s membrane or internal limiting membrane in all or part of 4 scans or more; asymmetry maps had linear defects because of missing data; significant retinal or vitreoretinal pathologic features were evident, including epiretinal membrane, vitreomacular traction syndrome, moderate or worse age-related macular degeneration, or a combination thereof. If adequate RNFL and posterior pole scans were not available from the same day, the subject was excluded.
When fewer than 5 of 61 raster scans had significant segmentation errors, these errors were corrected manually by one of the authors (C.C.R.) and rechecked for accuracy by a separate author (M.S.M.). One of the authors (C.C.R.) also centered the macular thickness map on the fovea–optic disc axis by aligning the central line from mid disc through the foveola to ensure appropriate delineation of superior and inferior retinal thickness areas. When the scan was considered well centered with adequate quality, the inferior, total, and superior macular thickness values were recorded from the standard printout, and asymmetry parameters then were calculated. Analogous to RNFL thickness parameters, we used the lowest measured macular thickness values for each pair of eyes to maximize the ability of these parameters to identify early glaucoma. Intereye macular thickness asymmetry and intraeye macular thickness asymmetry were calculated using absolute differences between eyes and between superior and inferior hemispheres of the same eye, respectively. We used the higher of the paired-eye intraeye asymmetry values for diagnostic analysis, because preliminary analyses demonstrated that glaucomatous eyes had higher intraeye macular thickness asymmetry compared with normal eyes, and our goal was to maximize glaucoma identification within the subject.
Statistical Analysis
The Student t test was used for descriptive analyses and for parameter comparisons between diagnostic groups. Receiver operating characteristic (ROC) analysis was used to evaluate parameter relationships with glaucoma and to determine diagnostic threshold values and sensitivities at both 80% and 95% specificity. Areas under ROC curves also were computed and were compared for all parameters.
Multivariate regression analyses were used to identify parameters that were associated most closely and independently with glaucoma. Statistical significance was defined as P < .05, and all statistical analyses were performed in conjunction with a professional biostatistician (C.Q.) using SAS software version 9.2 (SAS Institute, Inc, Cary North Carolina, USA) and MedCalc software version 12.4.0.0 (MedCalc, Ostend, Belgium).
Results
Of 128 subjects who met initial inclusion criteria, we enrolled 50 subjects with early POAG and 50 normal subjects for this investigation. Poor OCT scan quality or confounding retinal abnormalities (eg, epiretinal membrane, vitreomacular traction syndrome, or large drusen) led to the exclusion of 28 subjects (10 POAG and 18 normal subjects).
We found no intergroup differences for age, ethnicity, gender, central corneal thickness, glycosylated hemoglobin, or diabetes mellitus diagnosis, as shown in Table 1 . The POAG group exhibited significantly longer axial length and worse visual field indices (mean deviation, pattern standard deviation) compared with the normal group. In the POAG group, mean values for mean deviation (−1.11 dB) and pattern standard deviation (2.28 dB) were in the lower end of the range defining mild visual field loss. Of the 50 POAG subjects, 35 (70%) had repeatable visual field loss in only 1 eye.
| Normal (n = 50) | POAG (n = 50) | P Value a | |
|---|---|---|---|
| Age (y) | 66.2 (9.4) | 68.9 (9.1) | .15 |
| Race | .32 | ||
| Non-Hispanic white | 22 | 22 | |
| Hispanic white | 26 | 22 | |
| Black | 1 | 4 | |
| American Indian | 1 | 2 | |
| Gender | <.001 | ||
| Male | 48 | 47 | |
| Female | 2 | 3 | |
| DM diagnosis | .15 | ||
| Positive | 11 | 19 | |
| Negative | 39 | 31 | |
| HbA1C (%) | 6.1 (1.0) | 6.4 (1.1) | .12 |
| CCT (μm) | |||
| Right eye | 546.0 (34.9) | 547.9 (41.3) | .80 |
| Left eye | 546.4 (32.6) | 548.2 (41.0) | .80 |
| AL (mm) | |||
| Right eye | 23.80 (0.81) | 24.43 (0.80) | .0002 |
| Left eye | 23.75 (0.80) | 24.48 (0.87) | <.0001 |
| MD (dB) | |||
| Right eye | 0.23 (1.31) | −0.92 (1.74) | .0004 |
| Left eye | −0.14 (1.52) | −1.29 (1.54) | .0004 |
| PSD (dB) | |||
| Right eye | 1.74 (0.68) | 2.78 (1.30) | <.0001 |
| Left eye | 1.68 (0.51) | 2.74 (1.29) | <.0001 |
For both right and left eyes, RNFL and macular thickness parameters were significantly thinner in the glaucoma group versus the normal group. Additionally, intraeye macular thickness asymmetry was significantly higher for both eyes in the glaucoma group compared with the normal group, whereas intraeye RNFL asymmetry was not different between groups ( Table 2 ). For intereye asymmetry parameters, all showed significant differences between groups ( Table 3 ).
| Normal (n = 50) | POAG (n = 50) | P Value a | |
|---|---|---|---|
| Total RNFL thickness | |||
| Right eye | 96.9 (78.3 to 116.3) | 78.3 (52.0 to 103.3) | <.0001 |
| Left eye | 95.3 (80.0 to 112.3) | 76.8 (51.3 to 105.0) | <.0001 |
| Superior RNFL thickness | |||
| Right eye | 117.5 (86.3 to 146.3) | 93.2 (44.5 to 135.8) | <.0001 |
| Left eye | 119.6 (84.3 to 146.8) | 94.0 (56.8 to 137.0) | <.0001 |
| Inferior RNFL thickness | |||
| Right eye | 127.4 (96.5 to 168.0) | 101.2 (62.5 to 144.3) | <.0001 |
| Left eye | 124.7 (92.8 to 159.3) | 97.7 (51.0 to 140.8) | <.0001 |
| Inferior minus superior RNFL thickness b | |||
| Right eye | 9.8 (−19.8 to 50.8) | 7.8 (−33.3 to 55.5) | .62 |
| Left eye | 5.1 (−17.0 to 48.5) | 3.7 (−42.3 to 66.3) | .72 |
| Inferior/superior RNFL thickness difference c | |||
| Right eye | 13.6 (0.0 to 50.8) | 17.7 (0.0 to 55.5) | .18 |
| Left eye | 12.4 (0.0 to 48.5) | 18.5 (1.8 to 66.3) | .02 |
| Total macular thickness | |||
| Right eye | 284.8 (268.8 to 306.0) | 272.7 (245.8 to 295.8) | <.0001 |
| Left eye | 284.3 (266.8 to 304.0) | 272.5 (243.5 to 300.0) | <.0001 |
| Superior macular thickness | |||
| Right eye | 285.2 (265.5 to 307.0) | 273.7 (247.3 to 297.0) | <.0001 |
| Left eye | 284.8 (267.8 to 304.0) | 272.5 (245.0 to 299.3) | <.0001 |
| Inferior macular thickness | |||
| Right eye | 284.2 (267.0 to 305.3) | 271.9 (244.5 to 294.5) | <.0001 |
| Left eye | 284.0 (264.8 to 305.0) | 270.4 (239.5 to 300.5) | <.0001 |
| Inferior/superior macular thickness difference d | |||
| Right eye | 2.9 (0.0 to 9.3) | 6.6 (0.0 to 21.0) | <.0001 |
| Left eye | 3.7 (0.0 to 10.5) | 7.4 (0.0 to 23.5) | .0003 |
b Calculated as inferior minus superior RNFL thickness to account for normal anatomic configuration.
c Absolute difference between superior and inferior RNFL thickness.
d Absolute difference between superior and inferior macular thickness.
| Normal (n = 50) | POAG (n = 50) | P Value a | |
|---|---|---|---|
| Total RNFL thickness: right eye vs left eye difference | 2.7 (0.0 to 8.5) | 14.6 (2.5 to 33.0) | <.0001 |
| Inferior RNFL thickness: right eye vs left eye difference | 5.4 (0.0 to 17.0) | 24.0 (0.8 to 69.0) | <.0001 |
| Superior RNFL thickness: right eye vs left eye difference | 6.1 (0.0 to 23.8) | 20.8 (2.5 to 57.0) | <.0001 |
| Inferior minus superior RNFL thickness: right eye vs left eye b | 9.3 (0.0 to 31.3) | 22.8 (2.8 to 61.8) | <.0001 |
| Inferior/superior RNFL thickness difference: right eye vs left eye c | 7.7 (0.0 to 30.5) | 14.2 (1.0 to 52.0) | .001 |
| Total macular thickness: right eye vs left eye difference | 2.0 (0.0 to 5.3) | 10.8 (0.0 to 27.0) | <.0001 |
| Inferior macular thickness: right eye vs left eye difference | 2.4 (0.0 to 7.3) | 12.2 (0.8 to 34.3) | <.0001 |
| Superior macular thickness: right eye vs left eye difference | 2.8 (0.0 to 6.3) | 10.9 (0.8 to 27.0) | <.0001 |
| Inferior/superior macular thickness difference: right eye vs left eye d | 2.6 (0.0 to 7.0) | 8.0 (0.0 to 23.5) | <.0001 |
b Calculated as inferior minus superior RNFL thickness to account for normal anatomic configuration.
c Absolute difference between superior and inferior RNFL thickness.
d Absolute difference between superior and inferior macular thickness.
Stay updated, free articles. Join our Telegram channel

Full access? Get Clinical Tree


