Purpose
To evaluate and compare the diagnostic classification of retinal nerve fiber layer (RNFL) measurement between time-domain and spectral-domain optical coherence tomography (OCT) in myopic eyes.
Design
Prospective, observational study.
Methods
A total of 97 eyes from 97 healthy myopic subjects were included. The RNFL in each eye was imaged sequentially with the Stratus OCT and the Cirrus HD-OCT (Carl Zeiss Meditec). With reference to the built-in normative database, the number of abnormal diagnostic classifications (borderline or outside normal limits) in each OCT device was analyzed and compared using the likelihood ratio chi-square test. Multiple logistic regression analysis was performed to evaluate factors associated with abnormal diagnostic classification.
Results
The Cirrus HD-OCT classified a significantly higher percentage of eyes as outside normal limits/borderline in at least 1 clock hour (Stratus, 14.4%/24.8%; Cirrus, 21.6%/34.1%; all P < .01). RNFL measurement at 1 (23.6%) and 2 o’clock (23.5%) of all eyes was the most frequent location classified as abnormal by the Cirrus HD-OCT and the Stratus OCT, respectively. Eyes with smaller optic disc and longer axial length were more likely to have abnormal diagnostic classification.
Conclusions
In myopic eyes, Cirrus HD-OCT was more likely to have abnormal diagnostic classification than the Stratus OCT.
Myopia is a common ocular condition worldwide that has been shown to be one of the risk factors for primary open-angle glaucoma. Diagnosing glaucoma in myopic subjects is important in clinical practice. It has been reported that retinal nerve fiber layer (RNFL) thinning may be an early sign of glaucomatous damage and measurement of RNFL thickness is an important diagnostic approach for detection of glaucoma. The optical coherence tomography (OCT) has been developed to determine the in vivo RNFL thickness quantitatively. And the Stratus OCT (Carl Zeiss Meditec, Dublin, California, USA) is the most updated and widely used time-domain OCT that has been reported to be useful for glaucoma detection in clinical practice. Although the normative database provided by Stratus OCT has been shown to be useful in identifying glaucomatous damage, a significant proportion of normal myopic eyes were reported to be classified as abnormal (outside normal limits or borderline). This has limited the use of Stratus OCT for glaucoma diagnosis in myopic subjects.
Recently, the spectral-domain OCT has been developed to provide a higher axial resolution and a much faster scan speed than time-domain OCT. These improvements have the potential to improve the diagnostic accuracy for glaucoma detection. And the diagnostic performance of Cirrus OCT has been investigated in normal and glaucoma subjects. However, no study has been performed to evaluate the diagnostic ability of Cirrus OCT in myopic subjects. The purpose of this study was to evaluate and compare the diagnostic classification of RNFL measurement of Stratus OCT and Cirrus HD-OCT in healthy myopic eyes. We also investigated potential factors associated with abnormal diagnostic classification.
Materials and Methods
Subjects
One hundred Chinese myopic subjects were recruited in our study. One eye from each subject was randomly selected. All subjects received complete ophthalmic examinations in Joint Shantou International Eye Center, which included visual acuity, intraocular pressure (IOP) measurement, refraction, axial length measurement by IOL master (Carl Zeiss Meditec), and dilated fundus stereoscopic examination. All the included eyes have spherical equivalent of less than −0.5 diopters (D) and no other concurrent diseases. Subjects with best-corrected visual acuity of less than 20/40, IOP over 21 mm Hg, family history of glaucoma, intraocular surgery, myopic macular degeneration, glaucoma, parapapillary atrophy (PPA) extending outside the measurement circle of the OCT, refractive surgery, neurological diseases, or diabetes were excluded. The study was designed following the ethical standards of the Declaration of Helsinki and approved by the local ethical committee with informed consent obtained before the study.
Visual Field Testing
All visual field tests were performed with the static automated white-on-white threshold 24-2 SITA standard strategy (Humphrey Field Analyzer II; Carl Zeiss Meditec). A visual field test was considered to be reliable when fixation loss, false positive, and false negative were all less than 20%. All the visual field tests of included eyes were those with pattern standard deviation (PSD) with P > 5% and within normal limits in glaucoma hemifield test (GHT).
Confocal Scanning Laser Ophthalmoscopy Imaging
The optic disc was imaged with confocal scanning laser ophthalmoscopy (Heidelberg Retina Tomograph II [HRT 2]; Heidelberg Engineering, GmbH, Dossenheim, Germany). A 3-dimensional topographic image consisting of 384 × 384 × 16 up to 384 × 384 × 64 pixels is constructed from multiple focal planes axially along the optic nerve head. An average of 3 consecutive scans is obtained and aligned to compose a single mean topography for analysis. Images obtained in this study were reviewed carefully for image quality and selected for analyses only when an average pixel height standard deviation was 30 μm or less. The margin of the optic disc was defined as the inner edge of the Elschnig ring. The contour line was manually drawn by a trained ophthalmologist (K.L.Q.). Optic disc area was recorded and used in the present analysis.
Optical Coherence Tomography Imaging
Time-domain OCT imaging was performed with Stratus OCT (software version 4.0.4, Carl Zeiss Meditec). The acquisition rate of the Stratus OCT is 400 A-scans per second and the axial resolution is 8 to 10 Αm. RNFL thickness was measured with the fast RNFL (3.4) scanning protocol consisting of 256 A-scans. Average measurements of 3 sequential circular scans of diameter 3.46 mm centered on the optic disc were recorded. The RNFL thickness is determined by the difference in distance between the vitreoretinal interface and a posterior border, based on a predefined reflectivity signal level. All the included scans had signal strength of at least 7.
Spectral-domain OCT imaging was obtained using Cirrus HD-OCT (software version 4.5.1.11; Carl Zeiss Meditec). The scan speed for Cirrus is 27 000 A-scans per second and the axial resolution is 5 μm. The parapapillary RNFL thickness was measured by Cirrus HD-OCT using the Optic Disk Cube 200 × 200 protocol. This protocol obtains data through an area of 6 × 6 mm at the optic disc region by acquiring a series of 200 horizontal scan lines each composed of 200 A-scans. Eye movements were monitored by real-time fundus images. Images with misaligned vessels within the scanning circle were excluded and retaken. The signal for the included images had a minimum signal strength of 7.
For both OCT measurements, all images were acquired by 2 well-trained technicians during the same visit. Parameters including average and clock-hour RNFL thicknesses were generated automatically in the analysis reports of the Stratus OCT and Cirrus HD-OCT. Based on the internal normative databases, diagnostic classification (within normal limits, borderline, or outside normal limits) of each device was provided in the analysis printout. For both OCTs, there were 4 diagnostic classes. The upper 5th percentile was indicated in white, the 5th to 95th percentiles were indicated in green (within normal limits), the 1st to 5th percentiles were indicated in yellow (borderline), and the lower 1st percentile was indicated in red (outside normal limits). White and green were regarded as normal while yellow and red were abnormal in our analysis.
Statistical Analysis
The statistical analyses were performed with commercially available software (SPSS ver.13.0; SPSS Inc, Chicago, Illinois, USA). The relationship between Cirrus HD-OCT and Stratus OCT measurements was evaluated using Pearson correlation analysis. Based on the internal normative databases, diagnostic classification (within normal limits, borderline, or outside normal limits) provided by each device were compared using the likelihood ratio chi-square test. Logistic regression analysis was performed to investigate the factors associated with the diagnostic classification. A P < .05 was considered statistically significant.
Results
After excluding 2 subjects with unreliable visual field tests and 1 for extensive PPA, 97 eyes from 97 subjects (43 female and 61 right eyes) were analyzed. The mean age, axial length, and spherical equivalent were 22.84 ± 3.92 years (range, 18-40), 25.55 ± 1.11 mm (range, 22.52–28.77 mm), and −4.93 ± 2.17 D (range, −1.00 to −12.75 D), respectively. The visual field mean deviation and pattern standard deviation were −2.13 ± 1.12 dB and 1.49 ± 0.98 dB. The signal strength of Stratus OCT was significantly higher than that of Cirrus HD-OCT (9.1 ± 0.8 vs 8.0 ± 0.7, P < .01).
The average and clock-hour RNFL thickness for both OCTs were demonstrated in Table 1 . RNFL thickness obtained by Stratus OCT was significantly thicker than that of Cirrus HD-OCT in clock-hour and average measurements (all with P < .01). Average RNFL thickness measured by the 2 OCT devices was highly correlated ( Figure 1 , r = 0.794; P < .01).
| Clock Hours | Stratus OCT (um) | Cirrus HD-OCT (um) | P |
|---|---|---|---|
| 12 | 135.5 ± 25.56 | 112.9 ± 30.45 | <.01 |
| 1 | 125.8 ± 22.68 | 102.1 ± 20.84 | <.01 |
| 2 | 92.1 ± 25.79 | 74.7 ± 14.43 | <.01 |
| 3 | 68.6 ± 19.05 | 58.5 ± 10.28 | <.01 |
| 4 | 75.3 ± 20.70 | 58.9 ± 9.95 | <.01 |
| 5 | 106.4 ± 23.10 | 91.5 ± 18.60 | <.01 |
| 6 | 134.4 ± 26.40 | 127.6 ± 26.90 | <.01 |
| 7 | 164.1 ± 22.36 | 157.7 ± 30.70 | <.01 |
| 8 | 100.2 ± 24.98 | 89.6 ± 21.85 | <.01 |
| 9 | 75.1 ± 16.5 | 65.5 ± 11.72 | <.01 |
| 10 | 110.7 ± 23.47 | 100.8 ± 20.80 | <.01 |
| 11 | 155.9 ± 24.37 | 144.6 ± 20.96 | <.01 |
| Average thickness | 111.7 ± 11.34 | 98.7 ± 9.02 | <.01 |
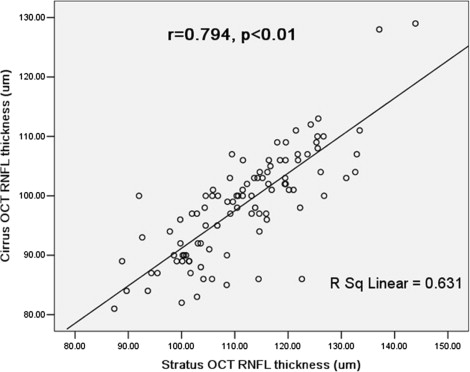
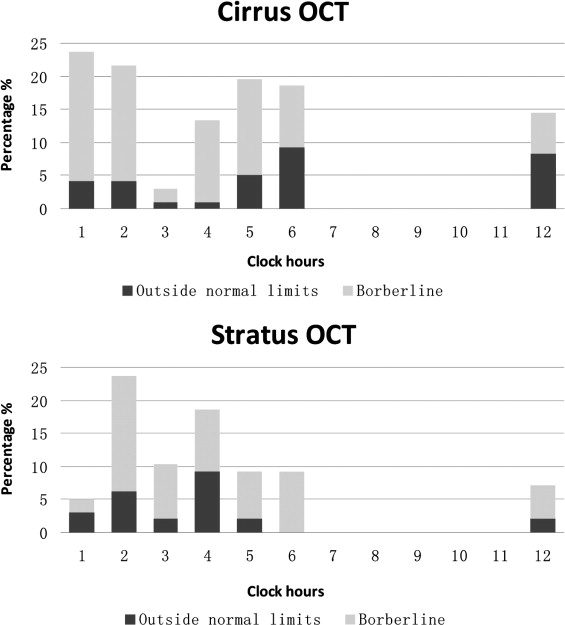
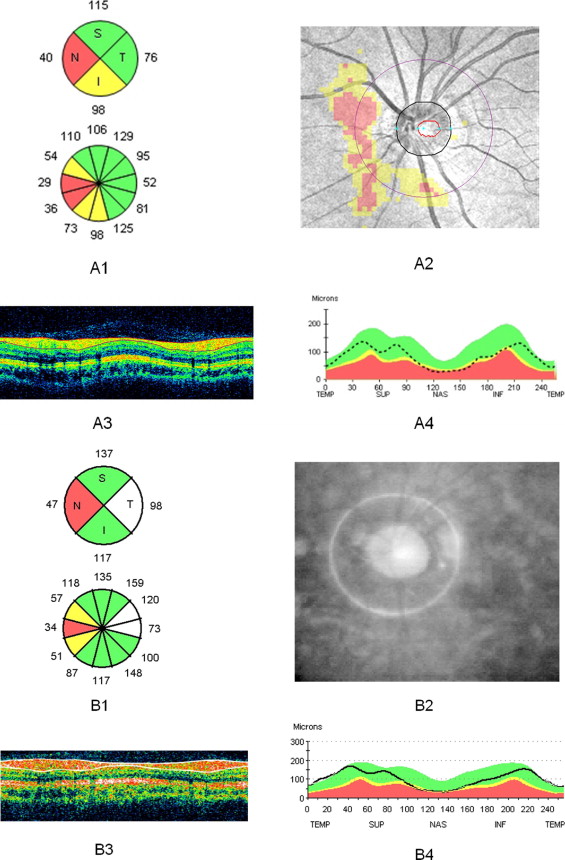
Figure 2 presents the proportion of eyes identified as abnormal based on the normative databases provided in Stratus OCT and Cirrus HD-OCT. For average RNFL thickness, 93 of 97 eyes (96%) were classified as normal (4 eyes as borderline) in Cirrus HD-OCT while all eyes were classified as normal in Stratus. For clock-hour RNFL thickness, the Cirrus HD-OCT had a significantly higher percentage of eyes detected as outside normal limits/borderline in at least 1 clock hour (Stratus, 14.4%/24.8%; Cirrus, 21.6%/34.1%; all with P < .01). For Cirrus HD-OCT, RNFL measurement at 1 o’clock was most frequently classified as borderline/outside normal limits (4.1%/19.5%). For Stratus OCT, 2 o’clock was most frequently classified as borderline/outside normal limits (6.0%/17.5%). An example of abnormal diagnostic classification with Stratus OCT and Cirrus OCT in a normal myopic eye is demonstrated in Figure 3 .
Logistic regression analysis showed that eyes with smaller optic disc size (Stratus, odds ratio: 0.23, P = .01; Cirrus, odds ratio: 0.17, P < .01) and longer axial length (Stratus, odds ratio: 2.75, P < .01; Cirrus, odds ratio: 1.80, P = .017) were significantly associated with higher percentage of abnormal diagnostic classification ( Table 2 ). Age, visual field mean deviation, and signal strength were not associated with abnormal diagnostic classification in both OCTs ( Table 2 ).


