Purpose
To correlate macular structural changes by spectral-domain optical coherence tomography (SD-OCT) with functional changes by scanning laser ophthalmoscope (SLO) microperimetry testing in patients with sickle cell hemoglobinopathies.
Design
Prospective, investigational study.
Methods
Patients with electrophoretic confirmation of sickle cell hemoglobinopathies and normal subjects underwent SD-OCT and microperimetry testing with the OPKO Spectral OCT/SLO instrument. Based on SD-OCT findings, patients were grouped into those with focal macular thinning (Group A) and those without (Group B). Main outcome measure were mean retinal sensitivities measured by microperimetry and mean macular thicknesses in the 9 Early Treatment Diabetic Retinopathy Study (ETDRS)-like subfields.
Results
Thirty-seven eyes of 19 patients with sickle cell hemoglobinopathies (SS, SC, and S-thalassemia) and 34 eyes of 34 age-similar normal controls were included. Mean age and mean logMAR best-corrected visual acuity between Groups A and B were not statistically different (39.7 years vs 36.5 years, P = .64 and 0.015 vs 0.016, P = .93, respectively). Group A had significantly thinner retinas compared to Group B in the parafoveal superior ( P = .019), parafoveal temporal ( P < .004), parafoveal inferior ( P = .003), perifoveal superior ( P = .04), perifoveal temporal ( P = .0005), and perifoveal inferior ( P = .045) subfields. The overall mean microperimetry retinal sensitivities of Group A were significantly less than those of Group B (14.2 dB vs 16.5 dB, P = .00005). However, there was no statistical difference between Group B and controls (16.5 dB vs 16.7 dB, P = .63).
Conclusion
Sickle cell patients with focal macular thinning present on SD-OCT have significantly decreased retinal sensitivities compared to those without focal thinning or normal controls based on mean microperimetry sensitivities, despite similar age and visual acuity. Microperimetry is a sensitive measurement of macular function in patients with sickle cell hemoglobinopathies.
Patients with sickle cell hemoglobinopathies inherit an abnormal globin protein chain that results in occlusions in various vascular systems. Vascular occlusions occur from sickling of the erythrocytes, increased viscosity, and venostasis especially in the setting of hypoxia, acidosis, and inflammation. In the retina, common findings include salmon-patch hemorrhages, iridescent spots, and black sunbursts. Nonproliferative sickle retinopathy with arteriolar occlusions and arteriovenous anastomoses can progress to proliferative sickle retinopathy with sea-fan neovascularization, vitreous hemorrhage, and retinal detachment. Profound visual loss resulting from vitreous hemorrhage and tractional retinal detachment has been reported to be as high as 10% to 20% in symptomatic patients in a referral setting but rare in a recent observational cohort study.
Although sickle retinopathy primarily occurs in the retinal periphery, structural macular changes have been well documented by clinical examination, fluorescein angiography, and histopathology. These changes include enlargement of the foveal avascular zone with perifoveal capillary dropout, nerve fiber layer infarcts, and vascular abnormalities including microaneurysm-like dots and hairpin-shaped venular loops. The temporal horizontal raphe represents a watershed area and is subject to terminal arteriolar occlusions. Previous studies from our group using spectral-domain optical coherence tomography (SD-OCT) showed focal macular thinning in about 50% of eyes with sickle cell hemoglobinopathies (Chau FY, et al. IOVS 2010;51:ARVO E-Abstract 3554). In those sickle cell patients without obvious focal macular thinning based on SD-OCT, we found subclinical foveal thinning and splaying as well as thinning in the outer retina in the central foveal subfield and the temporal parafoveal regions, when compared to age-matched controls. However, the functional impairment caused by these structural changes is unknown, since a majority of these patients retain excellent visual acuity.
The introduction of microperimetry testing with a scanning laser ophthalmoscope (SLO) in 1982 added a useful tool for clinicians to evaluate macular function. In 2006, OPKO/OTI (OPKO Instrumentations, Miami, Florida, USA) developed an SLO microperimeter in conjunction with SD-OCT. The SLO provides high-resolution images of the posterior ocular structures and incorporates ocular tracking capabilities allowing excellent test reliability and reproducibility during SD-OCT and microperimetry testing. After data acquisition, this system superimposes perimetric sensitivity values on an SLO infrared image with associated retinal thickness values, thus allowing direct correlations of structural and functional abnormalities. In the current study, we used this device to examine the relationship between the retinal thickness and macular sensitivity in patients with sickle cell hemoglobinopathies.
Patients and Methods
All patients who participated in this prospective, unmasked, comparative investigational study were diagnosed at the University of Illinois at Chicago.
Patient Selection
All patients had electrophoretic confirmation of sickle cell disease (SS), sickle cell–hemoglobin C disease (SC), or sickle-cell thalassemia (S-thal). Medical histories and sickle hemoglobinopathy type were recorded from the medical record. Initial evaluation included best-corrected visual acuity (BCVA) measurement by using the Snellen chart, Goldmann applanation tonometry, slit-lamp biomicroscopy, and dilated fundus examination. Staging of sickle retinopathy was based on the classification developed by Goldberg (stage I: peripheral arteriolar occlusion; stage II: arteriovenous anastomoses; stage III: peripheral neovascularization; stage IV: presence of vitreous hemorrhage; stage V: tractional and/or rhegmatogenous retinal detachment). All patients were staged by the same observer (J.I.L.). Patients with lens or other ocular media opacities, extensive laser or cryotherapy treatment, diabetes mellitus, uncontrolled systemic hypertension, or clinical evidence of any other maculopathies were excluded from the current study.
SD-OCT Retinal Thickness Mapping
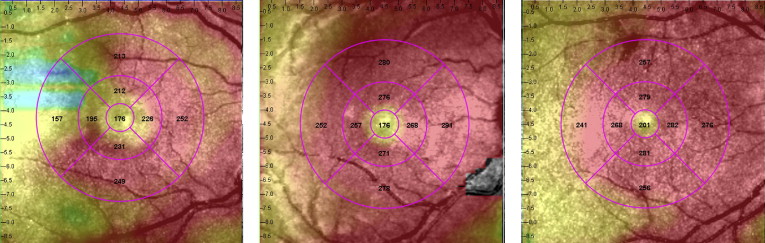
SD-OCT was performed using the Spectral OCT/SLO system (OPKO Instrumentations) to obtain both OCT and SLO images with an axial resolution of <10 μm and a transverse resolution of 20 μm (in tissue). The system uses an SLO fundus image for alignment, orientation, and registration of the OCT image topographic maps. Both the Line scan (B-scan) and the 3-Dimension Retinal Topography scan protocols were used for image acquisition. The Line scan mode allows the capture of cross-sectional B-scan OCT images of the vitreoretinal, retinal, and chorioretinal structures. A red scanning line on the SLO image represents the exact location of the cross-sectional OCT image. We used the “Max Frame Count” of 32 frames. The “Max Frame Count” is the maximum sequentially captured frames of OCT and SLO images, which are captured and displayed as individual frames. The 3D Retinal Topography mode covers an area of 9.0 × 9.0 mm with a 2.0-mm depth. The retinal thickness map is displayed as 9 Early Treatment Diabetic Retinopathy Study (ETDRS)-like subfields that correspond to the microperimetry testing area, including central, and parafoveal and perifoveal superior, temporal, inferior, and nasal, subfields ( Figure 1 ). The central subfield included the circle centered on the fovea with a radius of 0.5 mm. The parafoveal subfields included the concentric ring of retina around the central subfield with an inner radius of 0.5 mm and an outer radius of 1.5 mm from the fovea. The perifoveal subfields included the outer ring of retina beyond the parafoveal subfields concentric with the fovea and with an inner radius of 1.5 mm and an outer radius of 3 mm. Focal macular thinning was defined as abrupt asymmetric decrease in retinal thickness confirmed on thickness map and B-scan.
Macular Microperimetry Testing
Microperimetry was performed using the OPKO Spectral OCT/SLO system. All tests were performed after dilation of the pupil with 1% tropicamide and 2.5% phenylephrine. The nontested eye was patched during testing. The subjects underwent a practice test and were instructed to fixate on a red square and to depress a button as soon as they saw the stimulus light. The Polar 3 testing grid was used for all subjects. Polar 3 is a standardized grid composed of 28 points arranged in 3 concentric circles (2.3 degrees for inner, 6.6 degrees for middle, and 11 degrees for outer circle in diameter) within the central macula. The inner circle is composed of 4 points, whereas the middle and outer circles are each composed of 12 points. Parameters included a Goldmann III–size stimulus (area of 4 mm 2 , diameter of 26 minutes of arc or 0.4 degrees), a 200-millisecond duration of stimulus presentation, and a 4-2 test strategy. The 4-2 test strategy is the standard method in automated static perimetry for estimating threshold. It uses a staircase with an initial crossing of threshold in 4-dB increments and a final crossing in 2-dB increments.
The system automatically tracks fundus localization according to retinal vessel alignment to ensure accurate stimuli placement. If focal macular thinning was found on SD-OCT, a customized testing pattern was created and projected to the area of focal thinning in addition to the standard Polar 3 pattern. After retinal thickness and microperimetry maps were generated, the images were aligned using native software so that the retinal thickness at each microperimetry test location could be obtained.
Normative sensitivity values and intrasession repeatability were measured in 32 normal subjects with the same instrument for comparison with our study cohort. In summary, the sensitivity values averaged across 2 tests for inner, middle, and outer circles ranged from 14.3 to 18.8 dB (median value of 16.9 dB), 13.8 to 18.3 dB (median value of 17.2 dB), and 11.3 to 18.3 dB (median value of 16.6 dB), respectively. The mean intrasession sensitivity variability between 2 tests was small (0.13 dB). Based on these results, retinal sensitivity of 12 dB or lower was considered abnormal for our particular instrument.
Data Analysis
For data analysis purposes, Snellen chart visual acuity was converted to logarithm of minimal angle of resolution (logMAR) visual acuity. Eyes with focal macular thinning were grouped into Group A and those without thinning were grouped into Group B. Two-tailed, unpaired t test was performed between Group A, Group B, and controls using Microsoft Excel software. A P value less than .05 generated by the program was considered statistically significant.
Results
Thirty-seven eyes of 19 African-American patients with sickle cell hemoglobinopathies (SS, SC, S-thal) and 34 eyes of 34 age-similar, visually normal control subjects were included in this study. Fifteen patients had SS, 2 had SC, and 2 had S-thal disease. The sickle cell eyes were divided into 2 groups: those with focal macular thinning (Group A, 17 eyes of 10 patients) and those without (Group B, 20 eye of 11 patients), based on SD-OCT examination. Two patients had 1 eye in each group. Mean ages of Groups A and B were 39.7 years (range 20-66) and 36.5 years (range 22-66) respectively, which was not statistically different ( P = .64). Mean logMAR BCVA was not different between the 2 groups (0.0167 for Group A vs 0.015 for Group B, P = .93). The median stage of sickle cell retinopathy for both groups was II (range I to IV). Demographics of patients are summarized in the Table .
| With Focal Thinning (Group A) | Without Focal Thinning (Group B) | ||||||||||||
|---|---|---|---|---|---|---|---|---|---|---|---|---|---|
| Patient | Age | Eye | BCVA (Snellen) | BCVA (logMAR) | Sickle Type | Stage a | Patient | Age | Eye | BCVA (Snellen) | BCVA (logMAR) | Sickle Type | Stage a |
| 1 | 20 | OD | 20/20 | 0 | SS | II | 11 | 22 | OD | 20/20 | 0 | SS | II |
| 2 | 21 | OD | 20/15 | −0.1 | Sthal | III | OS | 20/25 | 0.1 | SS | I | ||
| OS | 20/15 | −0.1 | Sthal | II | 12 | 24 | OD | 20/20 | 0 | SS | II | ||
| 3 | 22 | OD | 20/25 | 0.1 | SS | II | OS | 20/20 | 0 | SS | II | ||
| OS | 20/20 | 0 | SS | II | 13 | 26 | OD | 20/20 | 0 | SS | II | ||
| 4 | 26 | OD | 20/20 | 0 | SS | I | OS | 20/20 | 0 | SS | II | ||
| 5 | 39 | OD | 20/20 | 0 | SS | II | 4 | 26 | OS | 20/20 | 0 | SS | I |
| OS | 20/25 | 0.1 | SS | II | 14 | 28 | OD | 20/20 | 0 | SS | I | ||
| 6 | 41 | OD | 20/20 | 0 | SS | II | OS | 20/20 | 0 | SS | I | ||
| OS | 20/25 | 0.1 | SS | II | 15 | 28 | OD | 20/25 | 0.1 | SS | I | ||
| 7 | 50 | OD | 20/25 | 0.1 | SS | IV | OS | 20/25 | 0.1 | SS | II | ||
| OS | 20/20 | 0 | SS | II | 16 | 39 | OD | 20/20 | 0 | SS | II | ||
| 8 | 54 | OD | 20/20 | 0 | SS | II | OS | 20/20 | 0 | SS | II | ||
| OS | 20/20 | 0 | SS | III | 17 | 40 | OD | 20/20 | 0 | SC | II | ||
| 9 | 58 | OD | 20/20 | 0 | SS | III | OS | 20/15 | −0.1 | SC | II | ||
| OS | 20/25 | 0.1 | SS | III | 18 | 43 | OD | 20/20 | 0 | SS | II | ||
| 10 | 66 | OD | 20/20 | 0 | SC | III | OS | 20/20 | 0 | SS | I | ||
| 19 | 59 | OD | 20/25 | 0.1 | Sthal | III | |||||||
| OS | 20/20 | 0 | Sthal | II | |||||||||
| 10 | 66 | OS | 20/20 | 0 | SC | IV | |||||||
Stay updated, free articles. Join our Telegram channel

Full access? Get Clinical Tree


