Purpose
To correlate the anatomic features of the macula with functional parameters like location and stability of fixation in patients with neovascular age-related macular degeneration treated with intravitreal ranibizumab injections.
Design
Retrospective analysis.
Methods
The location and stability of fixation were determined in 41 eyes of 41 patients treated with ranibizumab for neovascular age-related macular degeneration for at least 12 months. All patients underwent 3 injections of ranibizumab 1 month apart and were retreated according to predefined criteria. The fixation parameters measured with microperimetry were correlated to visual acuity, qualitative measures on optical coherence tomography, and patterns of autofluorescence.
Results
The location of fixation was predominantly central in 68.29%, poor central in 2.4%, and predominantly eccentric in 29.27%. The fixation was stable in 80.5%, relatively unstable in 7.3%, and unstable in 12.2%. The factors that determined central and stable location of fixation were better visual acuity ( P = .004), absence of subretinal thickening ( P = .003), intact subfoveal third hyperreflective band ( P = .006), and intact external limiting membrane ( P = .036). Autofluorescence pattern within the 4-degree circle of fovea did not correlate with fixation characteristics. However, complete absence of autofluorescence in this area was a poor prognostic indicator for central fixation.
Conclusions
Anatomic characteristics of the macula determine fixation patterns in patients with neovascular age-related macular degeneration treated with intravitreal ranibizumab injections. Further studies focused on eyes with complete absence of autofluorescence in the central 4-degree circle of fovea may help to define the disease characteristics in this group.
Neovascular age-related macular degeneration (AMD) remains a leading cause of visual impairment among the elderly in industrialized countries. Despite the recent availability of anti–vascular endothelial growth factor agents that improve vision in at least 30% of these patients, most of them require low visual aids to cope with their vision. The density of the central scotoma determines the degree of difficulty in performing tasks related to daily life. So, patients tend to develop a preferred retinal locus to compensate for the diseased macula. We have shown that fixation is more central and stable in ranibizumab-treated eyes compared with untreated eyes with disciform scars, suggesting that the smaller the area and the less severe the damage at the fovea, the more likely the eye is to retain central and stable fixation. Although the aim of ranibizumab and other anti–vascular endothelial growth factor agents is to dry the macula, the macula undergoes remodeling during the reparative process, and the morphologic features of the ranibizumab-treated macula may vary from subtle retinal pigment epithelial changes to submacular fibrosis. Visual rehabilitation depends on the position and characteristics of fixation. The aim of this study was to assess the anatomic features at the macula that may determine the fixation characteristics in eyes treated with ranibizumab for neovascular AMD.
Methods
The study was performed in the Laser and Retinal Research Unit of King’s College Hospital, London, United Kingdom.
Inclusion Criteria
Consecutive patients 55 years of age or older with neovascular AMD who were treated with ranibizumab therapy for at least 12 months were included in this study. The best-corrected visual acuity at baseline ranged between 24 and 73 Early Treatment Diabetic Retinopathy (ETDRS) letters. All the eyes were treatment naïve before initiation of ranibizumab therapy. All lesion subtypes were included: classic, minimally classic, and occult subtypes of choroidal neovascular membranes (CNV); retinal angiomatosis proliferans; and polypoidal choroidal vasculopathy. Exclusion criteria were CNVs resulting from causes other than AMD, prior photodynamic therapy or any other anti–vascular endothelial growth factor therapy, vitrectomy, or submacular surgery.
Retreatment Criteria
All included patients received 3 intravitreal injections with ranibizumab at monthly intervals. Decision to retreat after 3 injections was based on the following criteria: (1) recurrence of any subretinal fluid or intraretinal fluid on optical coherence tomography (OCT) in a previously dry macula, (2) persistent subretinal fluid or intraretinal fluid on OCT, (3) new-onset macular hemorrhages on fundus examination, (4) decrease of 5 letters or more associated with fluid on OCT, or (5) angiographic evidence of increase in lesion size. The numerical changes in central retinal thickness or presence of pigment epithelial detachments were not considered as retreatment criteria.
Visual Acuity Measurement
The best-corrected visual acuity for each eye was measured using the standard ETDRS protocol at 2 m with a modified ETDRS distance chart mounted on a retroilluminated box providing standardized illumination, by a clinical trials certified examiner (E.P.), on the day of the fixation test. All tests were carried out at the 12- to 14-month follow-up visit. Different charts were used for measurement of best-corrected visual acuity of the right eye and left eyes. If the patient could not read any letters at 2 m, the chart was brought closer to 1 m and the vision was tested again. If the patient could read more than 20 letters, 15 was added to the number read, to calculate the exact ETDRS visual acuity. Visual acuity was scored as the total number of ETDRS letters read correctly.
Fixation Characteristics
The Nidek Microperimeter (MP1; Nidek Instruments, Padova, Italy) was used to measure fixation with a white fixation cross 3 degrees in height presented on a dark background on the liquid crystal display screen of the microperimeter. The fixation cross was presented at the maximum luminance of the microperimeter. Subjects were encouraged to use peripheral retina to look toward the center of the cross if needed. After subjects had located the cross, fixation was measured for a period of 30 seconds.
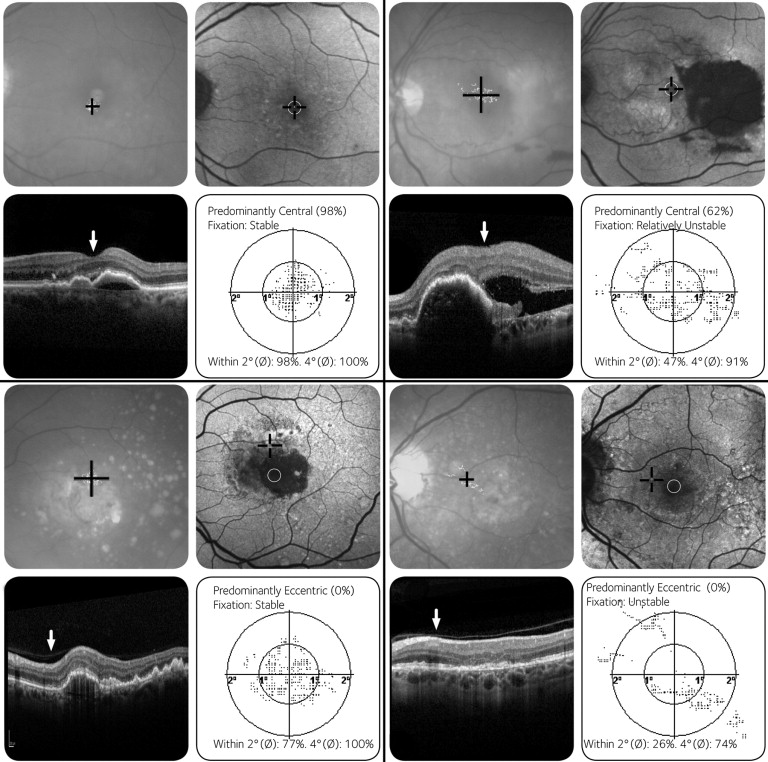
The pattern of fixation was classified based on location and stability using the MP-1 software as recommended by Fuji and associates. The location of fixation is defined as the position of fixation with respect to the center of the foveal avascular zone, and stability of fixation is defined as the ability of the eye to maintain a stable fixation at the preferred retinal locus.
The location of fixation was defined as predominantly central fixation when more than 50% of the preferred fixation points were located within 2 degrees of the center of the fovea; the location of fixation was defined as poor central fixation when less than 50% but more than 25% of the preferred fixation points were within 2 degrees of the center of the fovea; and the location of fixation was defined as predominantly eccentric fixation when less than 25% of the preferred fixation points were located within the 2-degree circle of the center of the fovea.
The stability of fixation was based on the variation of the preferred retinal locus. The location of fixation was defined as stable fixation when more than 75% of the fixation points were located within a predetermined limit area of variation of a 2-degree diameter circle centered at the gravitational center of all fixation points, regardless of the position of the foveal center. The location of fixation was classified as relatively unstable fixation when less than 75% of the fixation points were located within a 2-degree diameter circle, but more than 75% of the fixation points were located within a 4-degree diameter circle. The location of fixation was classified as unstable fixation when less than 75% of the fixation points were located within a 4-degree circle.
Optical Coherence Tomography
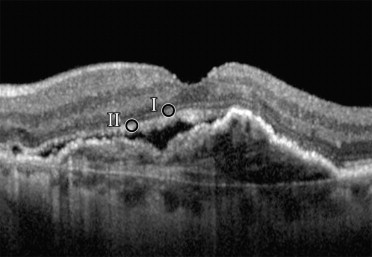
Spectral-domain OCT was performed with the Spectralis OCT (HRA+OCT; Heidelberg Engineering, Heidelberg, Germany). The OCT volume scan was performed on a 20 × 20-degree cube with 49 raster lines, each containing 1064 pixels, separated by 120 μm. The high acquisition speed of 40 000 A-scans/second avoids artifacts from microsaccades and improves image definition. The automatic eye-tracking technology (TruTrack and Tracking laser tomography) maintains fixation on the retina. The presence of macular fluid was defined as the presence of intraretinal or subretinal fluid, or both. The other OCT features included (1) foveal thinning or loss of inner retinal tissue, defined as center point thickness (centered on the fovea) less than 180 μm, (2) subretinal thickening or fibrosis defined as a uniform, spindle-shaped or fusiform hyperreflective band that straddles the RPE, (3) break or discontinuity of the third hyperreflective band that is assumed to represent the inner segment/outer segment junction of photoreceptors, and (4) break or discontinuity of external limiting membrane in the foveal area ( Figure 1 ) .
Fundus Autofluorescence
Fundus autofluorescence images were obtained using confocal scanning laser ophthalmoscopy (Heidelberg Retina Angiograph, HRA+OCT; Heidelberg Engineering) according to previously published protocol. In summary, acquisition of a series of 30 × 30-degree images (488 nm) was done focusing in the red-free reflection mode, and calculation of mean images after automated alignment (of 9 single images) was carried out to amplify signal-to-noise ratio with image analysis software (Heidelberg Eye Explorer; Heidelberg Engineering). For autofluorescence grading, the London AMD study protocol was modified. Autofluorescence images were analyzed with respect to whether the normal macular autofluorescence was present and continuous within the 4-degree diameter of the center of the fovea. The patterns of autofluorescence were classified as (1) intact autofluorescence, (2) presence of areas of increased or decreased autofluorescence, or both, within the 4-degree diameter of the foveal center, and (3) absence of normal autofluorescence within the 4-degree diameter of the foveal center ( Figure 2 ) .
Statistical Methods
Descriptive statistics were used to summarize study data. For the variables, medians and ranges were used for continuous variables and counts and percentages were used for categorical variables. An analysis of variance was used for continuous, normally distributed variables. Each of the variables was examined using Fisher exact test or Pearson chi-square test for categorical variables. Data were assumed significant if P < .05. Analyses were carried out using SPSS software version 17.0 (SPSS, Inc, Chicago, Illinois, USA). Agreement between graders for the fundus autofluorescence patterns and OCT morphologic features was measured by means of κ statistics and 95% confidence intervals.
Results
Baseline Characteristics
The mean age of the 41 patients was 77.9 ± 13.4 years. There were 48.8% males and 51.2% females. The median best-corrected visual acuity was 63 ETDRS letters (range, 25 to 81 ETDRS letters). The angiographic subtypes of membranes included 14.6% (6/41) predominantly classic, 7.3% (3/41) minimally classic, 58.5% (24/41) occult, 17.1% (7/41) retinal angiomatosis proliferans, and 2.4% (1/41) polypoidal choroidal vasculopathy.
Fixation Pattern
The location of fixation was predominantly central in 68.29% (28/41), whereas a small proportion of the patients (2.4%, 1/41) had poor central fixation. The fixation in the remaining cohort (29.27%, 12/41) was predominantly eccentric. The fixation was stable in 80.5% (30/41), relatively unstable in 7.3% (3/41), and unstable in 12.2% (5/41).
In patients with predominantly eccentric fixation (n = 12), the relation of the eccentric fixation relative to the center of the fovea was superior in 25% (3/12), inferior in 8.33% (1/12), nasal in 8.33% (1/12), and temporal in 58.33% (7/12). In patients with eccentric fixation, 58% (7/12) had stable fixation and 42% (5/12) had unstable fixation.
Fixation Pattern and Visual Acuity
Patients with central fixation had better vision (64.3 ± 12 ETDRS letters) than those with noncentral fixation (51.8 ± 14 ETDRS letters; P = .004). Similarly, the vision in eyes with stable fixation (63.2 ± 13 ETDRS letters) was better than that in eyes with unstable fixation (50 ± 12 ETDRS letters; P = .008).
Analysis of Anatomic Changes of the Retina on Optical Coherence Tomography
The anatomic features on OCT were compared between eyes with predominantly central fixation (that included the eyes with poor central fixation) and those with eccentric fixation and in eyes with stable and unstable fixation (that included eyes with relatively unstable and unstable fixation; Table 1 ).


