Purpose
To develop a method for automatizing the detection of subclinical keratoconus based on a tree classification.
Design
Retrospective case-control study.
Methods
setting : University Hospital of Bordeaux. participants : A total of 372 eyes of 197 patients were enrolled: 177 normal eyes of 95 subjects, 47 eyes of 47 patients with forme fruste keratoconus, and 148 eyes of 102 patients with keratoconus. observation procedure : All eyes were imaged with a dual Scheimpflug analyzer. Fifty-five parameters derived from anterior and posterior corneal measurements were analyzed for each eye and a machine learning algorithm, the classification and regression tree, was used to classify the eyes into the 3 above-mentioned conditions. main outcome measures : The performance of the machine learning algorithm for classifying eye conditions was evaluated, and the curvature, elevation, pachymetric, and wavefront parameters were analyzed in each group and compared.
Results
The discriminating rules generated with the automated decision tree classifier allowed for discrimination between normal and keratoconus with 100% sensitivity and 99.5% specificity, and between normal and forme fruste keratoconus with 93.6% sensitivity and 97.2% specificity. The algorithm selected as the most discriminant variables parameters related to posterior surface asymmetry and thickness spatial distribution.
Conclusion
The machine learning classifier showed very good performance for discriminating between normal corneas and forme fruste keratoconus and provided a tool that is closer to an automated medical reasoning. This might help in the surgical decision before refractive surgery by providing a good sensitivity in detecting ectasia-susceptible corneas.
Identifying corneas with risk of developing iatrogenic ectasia after laser in situ keratomileusis (LASIK) remains the major concern of the preoperative refractive surgery screening. Although its prevalence is low, estimated between 0.04% and 0.6%, post-LASIK ectasia is a severe and irreversible complication that compromises the visual prognosis and can lead to corneal transplant. Therefore, the great amount of time and energy spent by researchers to develop effective diagnostic tools for identifying patients at risk of such complication remains fully justified.
Identifying subclinical keratoconus (KC) remains one of the most challenging situations faced by the ophthalmologist when considering a refractive surgery procedure. The overlap of values between normal eyes and subclinical KC in most of the parameters analyzed with the topography and tomography does not allow the ophthalmologist to state with certainty to which category the eye belongs. Moreover, the high number and complexity of data provided by the current imaging systems represents a challenge of interpretation for the ophthalmologist. Therefore, decisions are often based on personal experience and subjective recognition of patterns or empiric cutoff values that are not necessarily the same between imaging systems. Recently, some authors have proposed new objective methods for the detection of forme fruste KC based on an artificial intelligence program using a combination of Placido and tomographic corneal indices and reported a high sensitivity. To date, these detection programs have been developed with parameters measured with the Orbscan II system (Bausch & Lomb, Rochester, New York, USA) and the Sirius system (CSO, Firenze, Italy).
In this study, we describe a new screening program for the detection of forme fruste KC using the GALILEI Dual Scheimpflug Analyzer (Ziemer Ophthalmic Systems AG, Port, Switzerland). The method is based on an automated decision tree classification that helps in discriminating between normal corneas, forme fruste KC eyes, and KC eyes in an objective and quantitative way and without requiring preliminary expertise in interpreting corneal imaging.
Methods
This retrospective case-control study was conducted at the University Hospital of Bordeaux, France, in the National Reference Center for Keratoconus, and approved by the Institutional Review Board of the Bordeaux University Hospital. The study was conducted in accordance with the tenets of the Declaration of Helsinki and all patients signed specific informed consent to participate in this research.
Study Population
A total of 372 eyes of 197 patients were enrolled between September 2011 and May 2012 and imaged with the GALILEI Dual Scheimpflug Analyzer System. Corneas were then classified into 3 groups based on eye conditions: normal (Group 1) included 177 eyes of 95 subjects, forme fruste of KC (Group 2) included 47 eyes of 47 patients, and KC (Group 3) included 148 eyes of 102 patients. Groups were defined as follows:
Group 1
Normal eyes were enrolled among suitable candidates undergoing a screening examination for refractive surgery and among the general population undergoing a routine ophthalmologic examination. All patients had discontinued daily-wear soft contact lens use at least 1 week before evaluation. Eyes were considered normal when no clinical signs of keratoconus and no suggestive topographic or tomographic patterns of suspect keratoconus were found, such as asymmetric bowtie with a skewed radial axes, focal or inferior steepening, central keratometry greater than 47.0 diopters, or corneas thinner than 500 μm. Exclusion criteria for this group were previous ocular surgery, ocular pathology, familial history of keratoconus, and contact lens wearing in the past week.
Group 2
Group 2 was composed of 47 forme fruste of KC, which are defined as the contralateral eyes of clinically evident keratoconus in the fellow eye (n = 47). These eyes had no clinical signs of keratoconus and a normal topographic aspect with no asymmetric bowtie and no focal or inferior steepening pattern. This condition is also known in the literature as “subclinical keratoconus” since it has already been reported that approximately 50% of clinically normal fellow eyes of patients with a unilateral keratoconus progressed to keratoconus within 16 years, with a greater risk during the first 6 years of onset.
Group 3
Eyes with keratoconus were enrolled among patients that were referred to the National Reference Center for Keratoconus for a regular control visit for moderate to advanced keratoconus. Diagnosis of clinical keratoconus was previously defined and includes a combination of findings characteristics of keratoconus : corneal topography with asymmetric bowtie pattern or localized steepening, irregular cornea determined by distortion of the retinoscopic or ophthalmoscopic red reflex, and at least 1 of the following slit-lamp findings: stromal thinning, Fleischer ring greater than 2 mm arc, Vogt striae, and corneal scarring consistent with keratoconus. Eyes that wear contact lenses and eyes that have already undergone a specific treatment for keratoconus, such as collagen cross-linking, intracorneal rings, or keratoplasty, as well as marginal pellucid degeneration, were excluded from the study.
Dual Scheimpflug Analyzer System and Procedure
Measurements were performed with the GALILEI system (software version 5.2.1) according to the manufacturer’s guidelines, and all the measurements were taken by the same experienced examiner (D.S.).
The GALILEI is a rotating Scheimpflug tomography-based device combining dual-channel Scheimpflug cameras and a Placido disk. The rotational scanning system acquires between 15 and 60 Scheimpflug images per scan and 2 Placido top view images at 90 degrees apart, as the cameras rotates around the central axis. Placido and Scheimpflug data are acquired simultaneously, and then a motion correction algorithm is applied to the combined data set. This correction compensates for a patient’s eye motion during scanning by a tracker that locates and tracks a patch on the iris, matching its location on every scan. Height data from the Scheimpflug images and slope data, converted into height data from the Placido, are merged to provide a surface fitted to the anterior corneal data, whereas posterior corneal surface data are measured using edge detection in images provided by the dual Scheimpflug system. Simultaneously, the system allows for a corneal aberration analysis separately from the aberrations of the lens and displays the total higher-order corneal wavefront aberrations calculated from the front and back surface. Both the displayed wavefront maps and the root mean square indices are recalculated recentered on the pupil center over a 6.0-mm optical zone. Individual Zernike coefficients for terms from second to sixth order are displayed in micrometers as well as in diopters.
Only measurements that satisfy the minimum quality required by the system were included in this study. Good quality of the measurement was reached when the scan registered as “OK” on the Instrument Quality Checking display. The overall scan quality takes into account the following 4 factors: quality of the Placido images, Scheimpflug images, motion compensation, and motion distance, which appear with respective percentage thresholds to reach for the measurement to be considered of sufficient quality.
Automated Machine Learning Classifier: The Tree Classification Method
Description
In our study, we used an automated classification method to discriminate between normal, forme fruste KC, and KC eyes in an objective and quantitative way. The classification and regression tree is a flexible nonparametric data analysis tool that has been adopted for data mining. It is generated by a machine learning algorithm (RPART software, R package version 3.1-50) using a sample of “training” data with a known class assignment (normal, forme fruste KC, or KC, in our case).
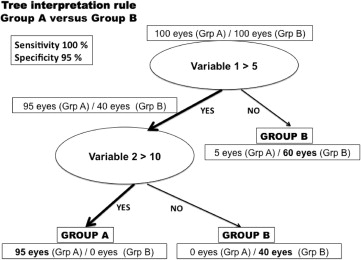
The decision tree consists of successive nodes that are defined by a discriminant variable and its cutoff value, branches that successively split the sample into 2 mutual subgroups, and leaves that correspond to the final decision of class assignment ( Figure 1 ). From all measured parameters, the algorithm automatically selects the variable and a cutoff value for that variable that best discriminates between the given groups.
A final decision tree that is too large, including too many nodes (large tree), risks overfitting the training data and thus poorly generalizing to new samples. Therefore, a pruning process is applied to the decision tree (pruned tree) in order to improve the predictive accuracy by omitting parts that provide little additional power and are considered as “noise.”
Interpretation rules
One of the major advantages of the tree classification is its ease of interpretation and of understanding. Moreover, the classification and regression tree has the advantage to fit the medical reasoning by building its discriminating rule based on a logical sequence of conditional statements “if, then.” Trees are represented graphically, with the root node, which represents the undivided data, at the top, and the branches and leaves beneath. Nodes represent a particular attribute of the data, which correspond to the most discriminant parameter automatically selected by the algorithm, with a specific cutoff value that best discriminates the groups. At each given split, eyes that meet the condition expressed by the parameter (ie, variable <4) are separated from eyes that do not meet this condition. All paths from the root node to the leaf node proceed by way of conjunction, or “and.” That way, final eye conditions assigned at the bottom of the tree will be characterized by a succession of variables with particular cutoff values that will be chosen for discriminating between eyes from different conditions, normal, forme fruste KC, and KC. An artificial example of a decision tree for classifying subjects (healthy vs sick) is represented in Figure 1 .
Validation method
The goodness of fit of the tree as a classification tool is characterized in terms of its misclassification rate. These estimated misclassification rates are underestimated because they are evaluated on the basis of the data that produced the classification rules. Thus, in the algorithm that produces the tree it is common to apply a 10-fold cross-validation method. This method is applied by randomly splitting the sample into 10 approximately equal-size subsamples. Trees are then produced 10 times. Each time the tree is constructed based on data in which 1 of the subsamples was left out. The omitted part is subsequently used to evaluate the “prediction error” when we apply on these omitted data the classification rule of the tree that was constructed without that omitted part. The final tree is selected to be the one with the smallest cross-validation estimate of error.
The tree classification was built by choosing automatically the most discriminant parameters among 55 variables measured by the system and submitted to the software. All the analyzed parameters are listed in Table 1 .
| Curvature-Derived Parameters | Elevation-Derived Parameters | Wavefront-Derived Parameters | Pachymetric-Derived Parameters | Biometric-Derived Parameters | Other Parameter |
|---|---|---|---|---|---|
| Anterior data: Kmax Axial SimKs, Kf, Cyl Axial MeanK (0-4 mm) Tang MeanK (4-7 mm) Tang MeanK (7-10 mm) Eccentricity (ε 2 ) I-S value Posterior data: Axial Ks, Kf, Cyl Axial MeanK (0-4 mm) Tang MeanK (4-7 mm) Tang MeanK (7-10 mm) Eccentricity (ε 2 ) Keratoconus indices: DSI, SAI, OSI, SRI, CSI, IAI, ACP, AA, SDP | Anterior data: With BFTA: Max elevation TP Max elevation Kmax Max elevation With BFS: Max elevation TP Max elevation Kmax Max elevation AAI Posterior data: With BFTA: Max elevation TP Max elevation Kmax Max elevation With BFS: Max elevation TP Max elevation Kmax Max elevation AAI | RMS total corneal HOA RMS corneal SA RMS corneal vertical coma RMS corneal horizontal coma RMS total corneal coma Corneal power Total corneal power (0-4 mm) Total corneal power (4-7 mm) Total corneal power (7-10 mm) Central CP ratio (0-4 mm) Paracentral CP ratio (4-7 mm) Peripheral CP ratio (7-10 mm) | Thinnest point Corneal volume | Anterior chamber depth Anterior chamber volume | Age |
Analyzed Parameters and Description
All patients had a detailed preoperative ophthalmic evaluation including uncorrected visual acuity, best spectacle-corrected visual acuity using Early Treatment Diabetic Retinopathy Study (ETDRS) charts, manifest refraction, slit-lamp evaluation, applanation tonometry, and fundus examination.
Both eyes were imaged by the GALILEI Analyzer and 55 parameters were extracted. Briefly, the analyzed parameters can be described as follows:
Curvature-based parameters
- •
Mean keratometry (MeanK) is the average keratometry calculated over the analyzed area, central (0-4 mm), paracentral (4-7 mm), or peripheral (7-10 mm) cornea. These values are derived from the axial curvature maps for the central cornea and from the tangential curvature maps for the paracentral and peripheral cornea.
- •
Kmax has been directly recorded from the curvature map and represents the maximal keratometric value.
- •
Eccentricity (ε 2 ) is 1 of the 4 parameters by which the shape of a conic section can be described. Q (asphericity), P value, and E (corneal shape factor) are the others. These terms are mathematically related by the following equation: ε = E = 1 − P = −Q. It is calculated within a central diameter of 8 mm averaged over all meridians of the anterior corneal surface. A positive value refers to a prolate shape of the corneal surface, whereas a negative value refers to an oblate shape.
- •
The I-S value, which has been described by Rabinowitz and McDonnell as the amount of steepening of the inferior cornea compared with that of the superior cornea.
- •
The opposite sector index (OSI), which has been described by Maeda and associates and represents the greatest difference in average area-corrected power between opposite 45-degree sectors.
- •
Posterior curvature data are basically the same as for the anterior surface; the only difference is that the keratometry values (Ks, Kf) are not simulated since they are calculated with the real indices of refraction of the cornea (1.376) and the aqueous humor (1.336).
Elevation-based parameters
- •
Elevation values were measured with 2 different reference bodies over a fixed 8-mm calculation zone: the best-fit sphere in float mode and the best-fit toric and aspheric body. Values were recorded in both anterior and posterior surfaces over 3 locations by manually guiding the cursor over the anterior and posterior elevation maps: highest elevation value within the 8-mm-diameter zone, elevation value at the thinnest point, and elevation value at the Kmax location.
- •
The quantification of asymmetry of asphericity of a corneal surface, the asphericity asymmetry index (AAI), has been proposed by Arce (Arce C. Electronic Poster, ASCRS Congress. April 9-14, 2010; Boston, Massachusetts). It is calculated over the best-fit toric and aspheric reference surface map display as the absolute value of the difference between the maximum negative elevation value and maximum positive elevation value within the central 6-mm-diameter data zone. This index has been recorded for the anterior and posterior surfaces.
Corneal wavefront-based parameters
Total corneal higher-order aberration root mean square from the third to the sixth order as well as the root mean square spherical aberration Z(4,0), root mean square vertical Z(3,−1) and horizontal Z(3,1) coma, and root mean square total coma through a 6-mm pupil size were recorded from the wavefront maps, displayed in micrometers.
Enantiomorphism was neutralized by inverting the sign of the mirror-symmetric coefficients of the left eyes as shown in the following equations:
Stay updated, free articles. Join our Telegram channel

Full access? Get Clinical Tree


