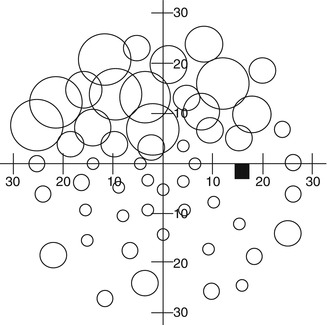
Fig. 9.1
A schematic representation of the hill of vision for a normal right eye. Sensitivity is plotted as a function of visual field location. The dark oval represents the location of the blind spot, and the peak of the hill of vision represents the fovea
Sensitivity losses produced by ocular or neurologic pathology, stimulus characteristics, or other conditions can be diffuse or widespread (Fig. 9.2a), localized (Fig. 9.2b), or a combination of diffuse and localized loss (Fig. 9.2c). The pattern, location, and shape of visual field sensitivity loss, in combination with monocular or binocular visual field deficits, are useful diagnostic clues used for detection, diagnosis, localization, and monitoring of pathologic conditions affecting the visual pathways. In this view, visual field information can be a powerful clinical tool for determining the specific location of damage to the visual system because the patterns of visual field loss mimic the anatomical arrangement of nerve fiber pathways throughout the visual system. Although this chapter will emphasize visual field losses produced by glaucoma, there are a variety of other references that provide a thorough assessment of patterns of visual field loss associated with different ocular and neurologic disorders affecting the visual system [26].
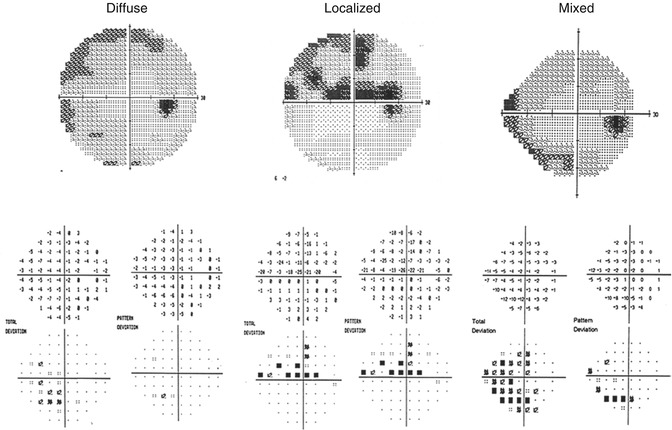
Fig. 9.2
Humphrey Field Analyzer visual field results for the right eye that demonstrates predominantly diffuse or widespread visual field loss (left panel), predominantly localized visual field loss (center panel), and a mixed combination of diffuse and localized visual field loss (right panel)
A representative sample of visual field deficits associated with glaucoma is shown in Fig. 9.3. The retinal ganglion cell nerve fibers enter the optic nerve head to form the optic nerve in three distinct patterns: (1) the papillomacular bundle, which is a candle flame-shaped group of nerve fibers subserving the region between the optic nerve head (visual field blind spot) and the macula, (2) superior and inferior arcuate nerve fiber bundles which enter the upper and lower portion of the optic nerve head, and (3) nerve fibers that enter the nasal portion of the optic nerve head (temporal visual field) in a radial pattern. In most instances, the papillomacular bundle is not affected until late in the glaucomatous disease process, so visual field deficits for this region are uncommon. Because the superior and inferior arcuate nerve fiber bundles are most often damaged during the early phases of glaucoma, the visual field deficits produced by this damage correspond to all or part of these nerve fiber bundles in the form of nasal steps (Fig. 9.3a), paracentral defects (Fig. 9.3b), partial arcuate (Fig. 9.3c), complete arcuate (Fig. 9.3d), or double arcuate (Fig. 9.3e) defects. Damage to the radial nerve fiber bundles is infrequent but can lead to temporal wedge visual field defects (Fig. 9.3f).
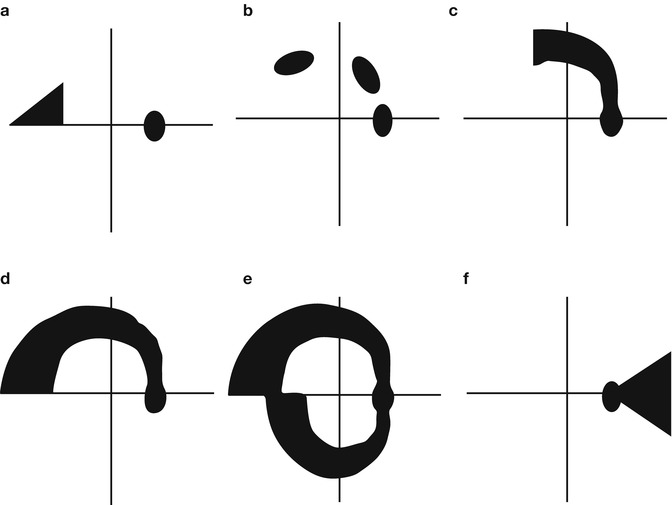
Fig. 9.3
A schematic representation of visual field defects produced by glaucoma: (a) Nasal step, (b) paracentral loss, (c) partial arcuate defect, (d) arcuate defect, (e) double arcuate defect, and (f) temporal wedge defect
Most of the current automated perimeters are able to provide an immediate quantitative comparison of an individual’s test results to those of a population with normal visual function, taking into account normal aging effects, variations in sensitivity for different visual field locations, reproducibility within the normal population, response reliability, and related factors. Additionally, changes in the visual fields of the same individual over repeated tests can also be accomplished and compared to results obtained from normal individuals and individuals with visual field loss but stable findings over a short period of time. Analysis of single and multiple visual field results will be presented in a later section of this chapter, although Fig. 9.4 presents a representative example of glaucomatous visual field progression.
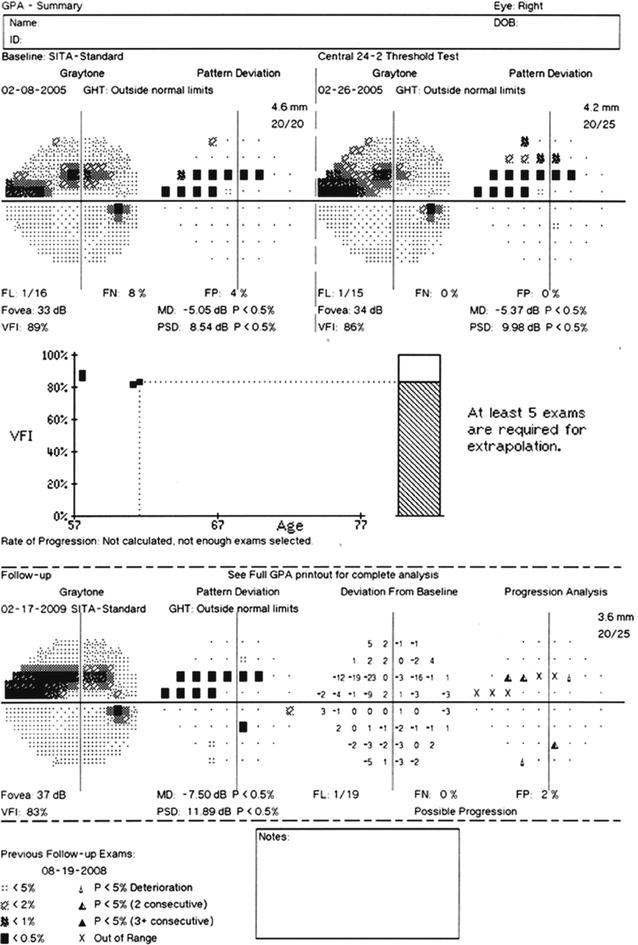
Fig. 9.4
An example of visual field progression as shown by the Glaucoma Progression Analysis (GPA) printed output for the right eye of a glaucoma patient tested with the Humphrey Field Analyzer II
Fig. 9.5
Characteristic rim defects due to an artifactual constriction of the field caused by a lens that is sitting too far from the eye. Testing of the left eye of the same patient when the lens rim is not obscuring part of the central visual field
Methods of Testing the Hill of Vision: Brief Descriptions
There are many different methods of testing the peripheral visual field. Although confrontation visual field testing (using fingers, hands, pencils, medicine bottle caps, or related objects to qualitatively map the visual field) is often performed, the most common form of testing consists of detecting a small white stimulus that is superimposed on a uniform white background known as projection perimetry. Kinetic, static, and suprathreshold static perimetry can be performed in this manner. Kinetic perimetry is usually conducted manually, although an automated perimetry program is now available on the Octopus perimeter [27]. Static and suprathreshold static perimetry can be performed in a manual or automated fashion. For each of these forms of perimetry, testing is normally performed on one eye that has a proper refractive correction for the testing distance, with the other eye occluded.
It is also important to perform quality control assessment procedures to minimize the influence of nonpathologic factors affecting the test results. There are a number of artifactual test results (lens rim artifacts, droopy eyelids, misalignment, blind spot mislocalization, etc.) that can be avoided by carefully observing the patient during testing [28]. It has also been reported that unreliable visual field results can be obtained in patients with visual field loss [29], but when quality control assessment procedures have been implemented, unreliable and artifactual test results can be mostly avoided [30, 31].
Kinetic perimetry involves the movement of a stimulus from a non-seeing to a seeing region of the visual field to map out the boundaries of detection of stimuli differing in size and luminance. In the hands of a highly skilled perimetrist, kinetic perimetry can provide an outstanding quantitative assessment of the full peripheral visual field. A detailed description of the techniques associated with kinetic perimetry is beyond the scope of this chapter, but an excellent review may be found in the perimetry book by Anderson [32]. Basically, a stimulus of predetermined size and luminance is moved (2–5 degrees per second) from the periphery towards fixation along different radii to map out areas of seeing and regions of non-seeing inside of the seeing boundaries. The iso-sensitivity regions of seeing a particular stimulus are connected to form isopters, and similarly, the non-seeing regions are connected to form scotomas for different targets, as depicted schematically in Fig. 9.6.
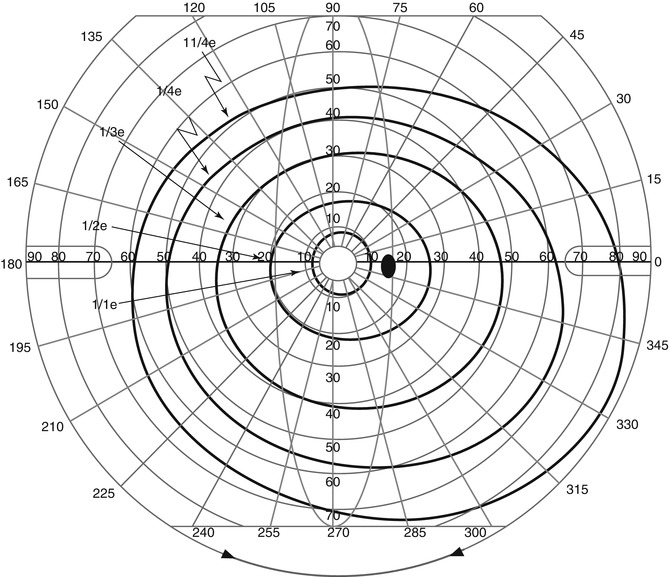
Fig. 9.6
Kinetic perimetry results for the right eye of a patient with a normal visual field, as performed using the Goldmann perimeter
Typically, the seeing regions for different stimuli are plotted in different colors, and the non-seeing regions for that stimulus are filled with that color. This produces a two-dimensional plot of the three-dimensional structure of the visual field’s differential light sensitivity, similar to the topographic geological survey maps used for landscape. In this view, the three-dimensional structure of visual field sensitivity (see Fig. 9.1) has often been referred to as the “hill of vision” or the “island of vision in a sea of blindness.”
Static perimetry involves a group of stationary targets whose threshold for detection is measured by varying its luminance. A collection of points along different radii or meridians (Fig. 9.7 – left) in polar coordinates, or grids (Fig. 9.7 – right) in Cartesian coordinates, may be used to determine sensitivity to light. This provides an alternate view of the hill of vision in the form of grayscale representations (Fig. 9.8 – left) or profile plots (Fig. 9.8 – right). Static perimetry is currently the most common form of quantitative visual field testing performed by eye care specialists.
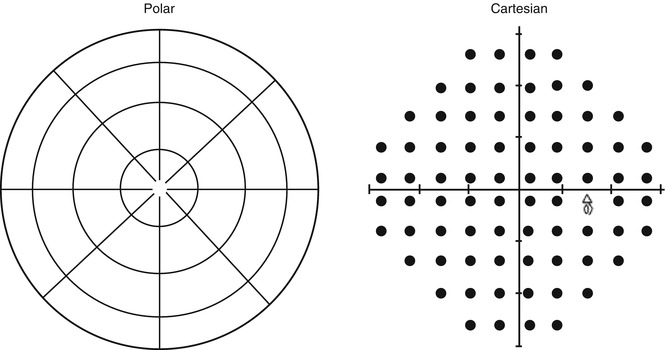
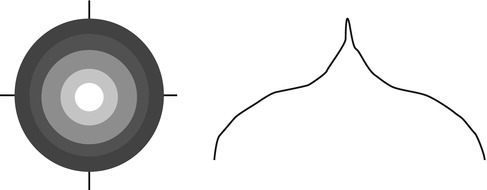
Fig. 9.7
A schematic representation of polar and Cartesian coordinate systems used for performing perimetry and visual field testing (Representation for a right eye is shown in this figure)
Fig. 9.8
A schematic representation of grayscale (left) and profile (right) sensitivity plots for perimetry test results
Suprathreshold static perimetry is a procedure that is primarily used as a screening technique to determine whether different locations of the visual field are within normal limits or are below normal limits (Fig. 9.9). In some instances, a rough estimate of the amount of abnormality can also be derived. These procedures usually are able to provide visual field information more rapidly than quantitative (kinetic and static) techniques, although research on these procedures has been limited to only a few clinical laboratories [33–39]. At the present time, there are a very large number of visual field screening procedures that are available, there is sparse information concerning the performance capabilities of these procedures, comparisons among different screening methods are rare, and their clinical significance is somewhat indeterminate. Additionally, the cost-effectiveness and societal-medical value of glaucoma screening has been a topic of debate among many investigators [40, 41].
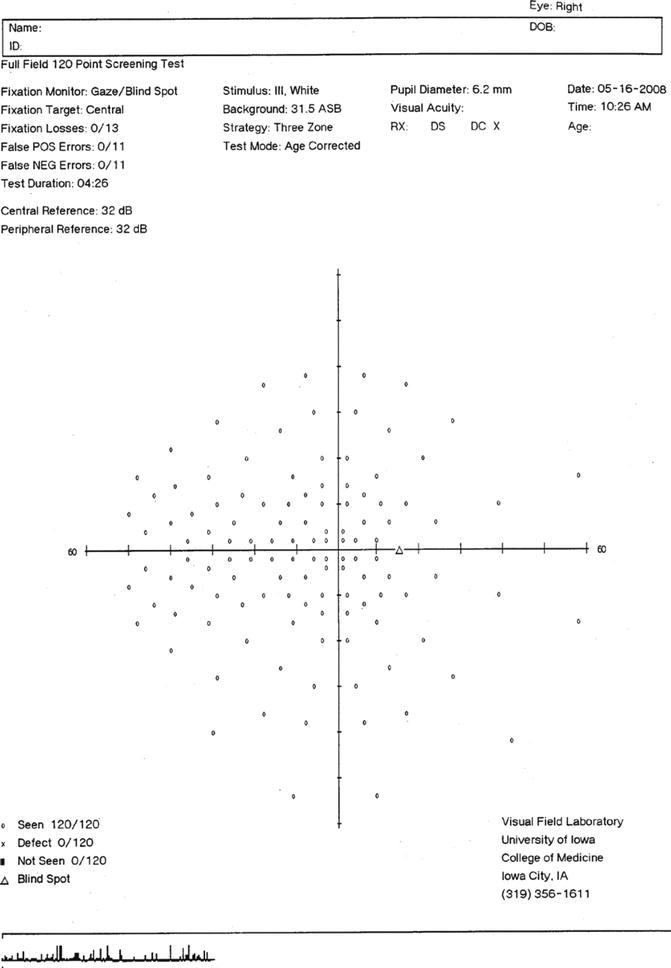
Fig. 9.9
Printed output for the 120 point visual field screening test for a right eye, as performed on the Humphrey Field Analyzer. The three zone test strategy is shown
In some instances, such as determining an individual’s fitness to drive, evaluating visual performance capabilities, assessing quality of life and activities of daily living issues, and related topics, it is important to measure an individual’s binocular visual field. Most perimetric devices do not have the ability to easily perform binocular visual field testing. However, several investigators have proposed methods of combining monocular visual field information to estimate the binocular visual field [42, 43]. For conjugate points in the visual field for the two eyes, the most sensitive threshold value and probability summation of sensitivity values between the two eyes can usually provide reasonably accurate estimates of binocular visual field threshold sensitivity [42, 43]. These procedures have now been employed by several laboratories for these purposes [42–46].
Sidebar 9.1. Lens-Induced Artifacts During Visual Field Testing
Andrew C. S. Crichton2
(2)
Department of Ophthalmology, University of Calgary, Calgary, AB, Canada
Correct lens selection and proper lens placement are paramount in promoting accurate and useful visual field studies. Lens artifacts can occur with either manual or automated perimetry.
The first and most obvious mistake is using the incorrect power of lens. Using too much plus power can artificially enlarge the field. Too much minus power can artificially minify the field. In both cases, the image seen by the patient may be blurry enough to cause an overall generalized depression of the field.
Another source of lens selection error during visual field testing is not noticing that the patient’s refraction may have changed since the last time the visual field exam was performed. The patient may have an unnoticed significant change in refractive error such as can occur after cataract surgery or in a patient under 60 years of age whose pupils are dilated. In these cases, the lens selected for visual field testing might be significantly different from what is needed. Patients should be asked at each exam if they have received new glasses or new contact lenses and of course if they have had any eye surgeries since the last visual field exam. It is always useful to measure their current spectacle correction with a lensometer.
Uncorrected astigmatism may also cause visual field artifacts. A significant amount of uncorrected astigmatism can result in blurry vision causing an overall depression in the field. Also, a lens set at an incorrect axis will blur the patient’s vision and produce incorrect field results.
In addition to selecting the correct power and setting the correct axis, the lens must be positioned properly in its holder in front of the patient. The first concern is centering the lens. A lens that is off center can restrict the field on the side, where the edge of the lens is closest to the visual axis. A second error is the possibility of induced prism from a decentered lens. Prentice’s Rule describes this effect as:
Induced Prism (PD) = lens power (D) × optical center displacement
This effect is more pronounced the larger the power of the lens being used. For example, a −8.00 lens displaced by 2 cm will induce 16 PD. This effect could shift the field and potentially mask small central or paracentral scotomas. These positioning defects may result not from the location of the lens itself in the lens holder, but rather from the seated position of the patient who is not centered directly behind the lens.
A lens that is sitting too far from the eye can cause the characteristic rim defect, as seen in (Fig. 9.5), because of an artifactual constriction of the field. A second effect from the distance a lens sits from the eye concerns vertex distance. The power of the lens for perimetry is generally determined from a patient’s spectacle refraction set at a certain vertex distance. If the trial lens during perimetry is not set at the same distance, the effective power can be different than intended. For lenses less than four diopters, the effective change in power is negligible. For minus lenses over four diopters, the effective power is reduced if the lens is sitting too close to the eye and increased if it is sitting too far. For plus lenses, the effective power is increased if it is sitting too close to the eye and reduced if too far. As with induced prism, the effect is larger with higher powered lenses.
In summary, the proper power of the lens and the proper position of the lens are very important when performing perimetry in order to have artifact-free results. Both technicians and physicians must know how to avoid lens-related visual field artifacts and also how to spot them when they do occur. These tips and caveats apply when performing and interpreting both manual and automated perimetry useful to measure their current spectacle correction with a lensometer.
Bibliography
Cassin B. Fundamentals for ophthalmic technical personnel. Philadelphia: Saunders; 1995.
Sidebar 9.2. Is It Useful to Perform Visual Field Screening for Glaucoma?
Andrew C. S. Crichton3
(3)
Department of Ophthalmology, University of Calgary, Calgary, AB, Canada
Screening for glaucoma has been a controversial topic, primarily because of the low prevalence and incidence of glaucoma, the high cost of performing screening, and the relatively low incidence of significant disabling visual impairment and binocular blindness [1]. In addition, recent investigations have demonstrated that compliance and adherence to medical glaucoma therapy are poor [2, 3]. On the other hand, recent multicenter trials indicate that treatment is effective in delaying or preventing glaucomatous damage [4–9], the impact of glaucoma on quality of life and activities of daily living occur at early stages of the disease [10–19], half or more of the individuals who have glaucoma remain undiagnosed [19], and certain populations are more susceptible to developing undiagnosed glaucoma [20, 21]. The value of early glaucoma detection has been succinctly and elegantly stated by Javitt, Lee, and Lum [22]. Until further information is available, the best alternatives for glaucoma screening today should be directed towards the assessment of risk factors for developing glaucoma, performing screening in populations at higher risk for developing glaucoma or who have limited access to traditional health care, and selecting test procedures that provide the best performance (sensitivity, specificity, predictive value) for detecting glaucoma. Additionally, a screening procedure that is directed towards many major ocular and neurologic disorders rather than just glaucoma would also be helpful.
References
1. Hattenhauer MG, Johnson DH, Ing HH, Herman DC, Hodge DO, Yawn BP, Butterfield LC, Gray DT. The probability of blindness from open-angle glaucoma. Ophthalmology. 1998;105:2099–104.
2. Friedman DS, Hahn SR, Gelb L, Tan J, Shah SN, Kim EE, Zimmerman TJ, Quigley HA. Doctor-patient communication, health-related beliefs, and adherence in glaucoma results from the Glaucoma Adherence and Persistency Study. Ophthalmology. 2008;115:1320–27.
3. Friedman DS, Quigley HA, Gelb L, Tan J, Margolis J, Shah SN, Kim EE, Zimmerman T, Hahn SR. Using pharmacy claims data to study adherence to glaucoma medications: methodology and findings of the Glaucoma Adherence and Persistency Study (GAPS). Invest Ophthalmol Vis Sci. 2007;48:5052–57.
4. The Advanced Glaucoma Intervention Study Group. The Advanced Glaucoma Intervention Study (AGIS): 4. Comparison of treatment outcomes within race. Seven-year results. Ophthalmology. 1998;105:1146–64.
5. Collaborative Initial Glaucoma Treatment Study: a summary of results to date. Curr Opin Ophthalmol. 2003;14:106–11.
6. Leske MC, Heijl A, Hussein M, Bengtsson B, Hyman L, Komaroff E, Early Manifest Glaucoma Trial Group. Factors for glaucoma progression and the effect of treatment: the early manifest glaucoma trial. Arch Ophthalmol. 2003;121:48–56.
7. Kass MA, Heuer DK, Higginbotham EJ, Johnson CA, Keltner JL, Parrish RK, Wilson MR, Gordon MO, The Ocular Hypertension Treatment Study Group. The Ocular Hypertension Treatment Study: safety and efficacy of topical ocular hypotensive medication in preventing or delaying the onset of primary open angle glaucoma. Arch Ophthalmol. 2002;120:701–13.
8. Anderson DR, Drance SM, Schulzer M, Collaborative Normal-Tension Glaucoma Study Group. Factors that predict the benefit of lowering intraocular pressure in normal tension glaucoma. Am J Ophthalmol. 2003;136:820–29.
9. Hyman LG, Komaroff E, Heijl A, Bengtsson B, Leske MC; Early Manifest Glaucoma Trial Group. Treatment and vision-related quality of life in the early manifest glaucoma trial. Ophthalmology. 2005;112:1505–13.
10. Guitierrez P, Wilson MR, Johnson C, Gordon M, Cioffi GA, Ritch R, Sherwood M, Meng K, Mangione CM. Influence of glaucomatous visual field loss on health-related quality of life. Arch Ophthalmol. 1997;115:777–84.
11. Parrish RK, Gedde SJ, Scott IU, Feuer WJ, Schiffman JC, Mangione CM, Montenegro-Pinella A. Visual function and quality of life among patients with glaucoma. Arch Ophthalmol. 1997;115:1447–55.
12. Mills RP, Janz NK, Wren PA, Guire KE. Correlation of visual field with quality-of-life measures at diagnosis in the Collaborative Initial Glaucoma Treatment Study (CIGTS). J Glaucoma. 2001;10:192–98.
13. Iester M, Zingirian M. Quality of life in patients with early, moderate and advanced glaucoma. Eye. 2002;16:44–9.
14. Nelson P, Aspinall P, Papasouliotis O, Worton B, O’Brien C. Quality of life in glaucoma and its relationship with visual function. J Glaucoma. 2003;12:139–50.
15. Ringsdorf L, McGwin G, Owlsey C. Visual field defects and vision-specific health-related quality of life in African Americans and whites with glaucoma. J Glaucoma. 2006;15:414–8.
16. Freeman EE, Munoz B, West SK, Jampel HD, Friedman DS. Glaucoma and quality of life: the Salisbury Eye evaluation. Ophthalmology. 2008;115:233–8.
17. McKean-Cowdin R, Wang Y, Wu J, Azen SP, Varma R, Los Angeles Latino Eye Study Group. Impact of visual field loss on health-related quality of life in glaucoma: the Los Angeles Latino Eye Study. Ophthalmology. 2008;115:941–8.
18. Jampel HD, Schwartz A, Pollack I, Abrams D, Weiss H, Miller R. Glaucoma patients’ assessment of their visual function and quality of life. J Glaucoma. 2002;11:154–63.
19. Coleman AL. Glaucoma. Lancet. 1999;354:1803–10.
20. Girkin CA. Primary open-angle glaucoma in African Americans. Int Ophthalmol Clin. 2004;44:43–60. Review.
21. Varma R, Ying-Lai M, Francis BA, Nguyen BB, Deneen J, Wilson MR, Azen SP, Los Angeles Latino Eye Study Group. Prevalence of open-angle glaucoma and ocular hypertension in Latinos: the Los Angeles Latino Eye Study. Ophthalmology. 2004;111:1439–48.
22. Javitt J, Lee P, Lum F. The value of regular examinations to detect glaucoma and other chronic conditions among older Americans. Ophthalmology. 2007;114:833–4.
Modern Methods of Checking the Visual Field and Their Relevance
In the previous section, various methods for performing standard (white-on-white) perimetric testing have been described. However, there are many other techniques for performing visual field testing that evaluate a variety of visual functions. Some of these test procedures have not provided much clinically useful information, whereas other have demonstrated an ability to detect glaucomatous damage at an earlier stage, predict future glaucomatous loss, provide better information about glaucomatous progression, generate a more objective measure of glaucomatous loss, and determine visual status in subjects with limited ability to perform conventional perimetric testing. In this chapter, only those procedures that have demonstrated the capabilities of providing helpful clinical information will be discussed.
Short-Wavelength Automated Perimetry (SWAP)
Stiles [47] developed a technique known as the two-color increment threshold technique, wherein it was possible to selectively isolate and measure the sensitivity of individual color vision mechanisms by using a chromatic background field (to adapt the other color vision mechanisms and reduce their sensitivity) and a different chromatic stimulus (to selectively measure the sensitivity of a single color vision mechanism). In this view, short-wavelength-sensitive (blue) mechanisms can be isolated by using a high-luminance broadband middle-wavelength (yellow) background to adapt and suppress the other (middle wavelength or “green” and long wavelength or “red”) color vision mechanisms in combination with a large (Goldmann size V) narrow band short-wavelength (“blue”) stimulus. Kitahara [48] and Kranda and King-Smith [49] were among the initial investigators to evaluate the efficacy of this procedure for evaluating short-wavelength sensitivity loss in glaucoma and other ocular and neurologic diseases. Unfortunately, complex calibration issues, long examination times, and difficult response characteristics precluded the implementation of this procedure for routine clinical use.
Sample and colleagues [50–59] and Johnson and collaborators [60–69] were able to modify existing automated perimeters to perform short-wavelength automated perimetry (SWAP). Cross-sectional and longitudinal investigations from these laboratories were able to establish that SWAP was capable of characterizing glaucomatous visual field defect patterns [50–53, 60–64], could detect glaucomatous visual field loss up to 10 years earlier than standard perimetric testing [70], could predict future glaucomatous damage on conventional perimetric testing [55–57, 60–66], and was able to determine a greater amount of progressive glaucomatous loss as compared to standard perimetric testing [52, 55, 61, 68].
A collaborative study was able to determine the optimal clinical test procedures for SWAP, which consisted of a high-luminance (100 cd/m2) broadband yellow background with a dominant wavelength of 530 nm (OG 530 Kodak Wratten filter), a narrow band (10 nm) large (Goldmann size V) “blue” stimulus (dominant wavelength of 440 nm, Omega filter) presented for 200 ms [54]. These conditions were able to minimize the effect of lens attenuation of short-wavelength light, maximize the dynamic range of SWAP, and provide the greatest amount of isolation of short-wavelength-sensitive mechanisms. Subsequent investigations were able to adapt Bayesian forecasting test procedures to SWAP to diminish testing time to 3–4 min per eye, expand the dynamic range by more than 4 dB, and slightly reduce variability while maintaining similar measurement procedures to the original SWAP procedure [71–74]. Several publications provide a review of SWAP findings in glaucoma [58, 59, 66, 67]. Additionally, many other characteristics were identified for SWAP, and it was also determined that SWAP was useful for characterizing damage from other ocular and neurologic disorders [75]. Several references have provided excellent review of the use of SWAP for evaluating visual field properties of patients with glaucoma and other ocular and neurologic conditions [58, 59, 67]. Figure 9.10 presents an example of SWAP results in the right eye of a patient with early glaucomatous visual field loss.
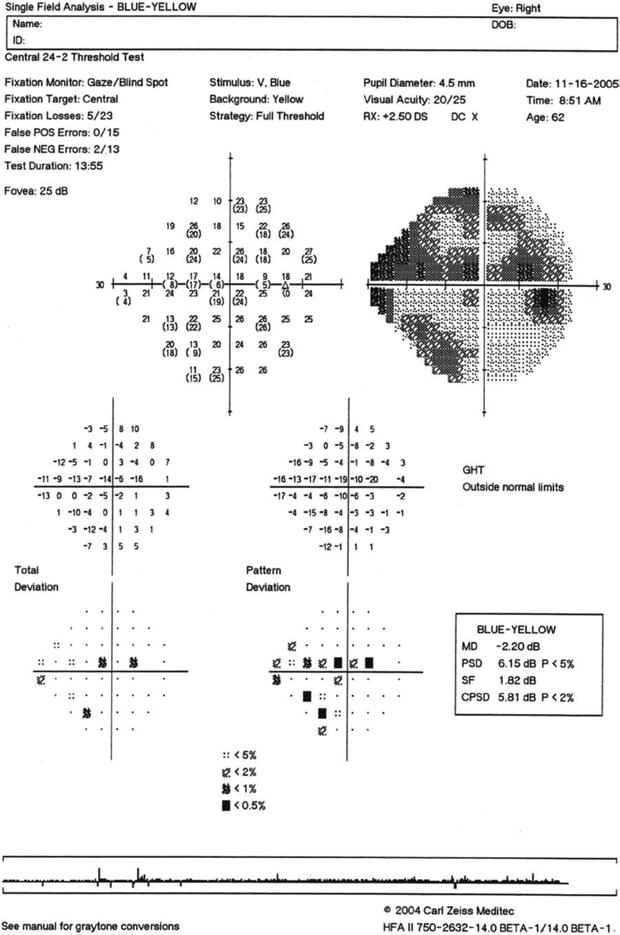
Fig. 9.10
Short-wavelength automated perimetry (SWAP) for the right eye of a patient with superior and inferior glaucomatous visual field loss
Frequency-Doubling Technology (FDT) Perimetry
When a low spatial frequency (less than 2 cycles per degree) sinusoidal grating undergoes high temporal frequency (greater than 15 Hz) counterphase flicker, the stimulus appears to have twice as many alternating light and dark bars in the grating (i.e., its spatial frequency appears to be doubled). The frequency-doubling effect was reported many years ago by Kelly [76, 77] and other investigators [78–82], but it was not until Maddess and Henry indicated that this psychophysical procedure could be used to characterize and evaluate glaucomatous visual field loss that it was considered for clinical ophthalmic diagnostic purposes [83]. Rather than evaluating the doubled appearance of this stimulus, they indicated that the contrast sensitivity for detecting the stimulus was the appropriate method of measuring FDT responses. Shortly thereafter, Johnson and Samuels reported a perimetric method of performing FDT testing that appeared to perform very well for detecting glaucomatous visual field loss, consisting of 19 large (10° by 10°) targets distributed over the central 20–30° radius [84].
Several modifications were made to the original FDT perimeter (including the use of the Modified Binary Search [MOBS] procedure, an adaptive staircase method of measuring contrast sensitivity values) [84], FDT perimetry was evaluated in ocular and neurologic conditions other than glaucoma [85–89], and the underlying basis and visual pathway location responsible for generating the FDT effect [90, 91] have been reported. A review of findings for FDT perimetry may be found in the literature [92].
Recently, a second generation FDT perimeter has been developed that is referred to as the Humphrey Matrix. The Humphrey Matrix provided a number of enhancements to FDT perimetry, including (1) the use of Zippy Estimation of Sequential Threshold (ZEST), a Bayesian forecasting procedure for estimating detection sensitivity, smaller (5° by 5°) targets with a number of different stimulus configurations (30-2, 24-2, and [2° by 2° targets] 10-2 and Macula tests), direct monitoring of eye position using a video camera display system, a more extensive analysis and test printout system, a greater amount of statistical analysis, enhanced storage and data transfer procedures, and many additional features [93–98]. The development of the Humphrey Matrix and the normative database and statistical analysis package has been published [93], and performance characteristics of the Humphrey Matrix have been reported for glaucoma and other ocular and neurologic conditions [94–98].
Primers that give a brief description of the FDT and Matrix tests, their underlying basis, and an assortment of results for different ocular and neurologic conditions have been made available for interested users for both instruments [99, 100]. The FDT testing procedure is preferred by most individuals over conventional perimetric test procedures. Additionally, it has been reported that there is a much lower amount of increase in variability in damaged visual field areas when compared to conventional perimetry, with the Matrix showing essentially equivalent reproducibility throughout the entire dynamic range of the instrument [101]. The FDT perimetry test has also been used for rapid screening of pathologic ocular and neurologic conditions, with one method that emphasizes high sensitivity and another method that emphasizes high specificity [102, 103]. Both procedures have been reported to offer very good performance and provide two alternatives for rapid testing of individuals, depending on the needs of the examiner. For both procedures, the testing can be performed in 30 s or less per eye for individuals with normal vision and in less than 2 min per eye for individuals with visual field loss [102]. Overall the FDT perimetry test procedure has been shown to have clinical value. Figure 9.11 presents Humphrey Matrix results for the left eye of a patient with moderate glaucomatous visual field loss.
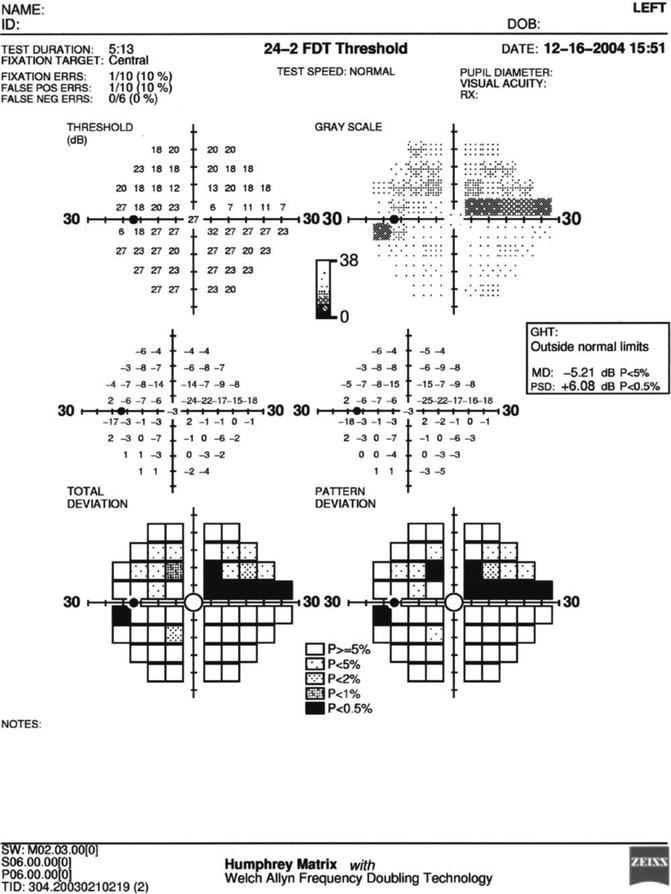
Fig. 9.11
Results for the left eye of a patient with superior arcuate visual field loss as performed on the Humphrey Matrix frequency-doubling perimeter using the 24–2 threshold test procedure
Sidebar 9.3. Pulsar Perimetry
Andrew C. S. Crichton4
(4)
Department of Ophthalmology, University of Calgary, Calgary, AB, Canada
Although it is a relatively new visual field test procedure, Pulsar Perimetry appears to be a technique that may be a useful clinical diagnostic tool for early detection and evaluation of glaucomatous visual field loss [1–4]. It is similar to FDT perimetry by presenting stimuli with a low spatial frequency and a high temporal frequency. However, it differs because it presents a two-dimensional sinusoidal grating (“bull’s-eye”) whose contrast is diminished at the outer edge of the target to reduce sharp edge effects, produces slight variations in the spatial and temporal characteristics of the target, and uses a different test strategy (Tendency Oriented Perimetry, or TOP) to estimate sensitivity thresholds, and reports sensitivity measures in terms of spatial contrast resolution (SRC) units that is a function of the spatial, temporal, and contrast properties of the stimulus that was derived by the developers of this procedure. (1,2). In this manner, it was possible to provide a single measurement value that takes all three of these functions (spatial frequency, temporal frequency, contrast sensitivity) into account Fig. 9.12 presents a representation of the spatial, temporal, and contrast characteristics that are used to perform Pulsar Perimetry.
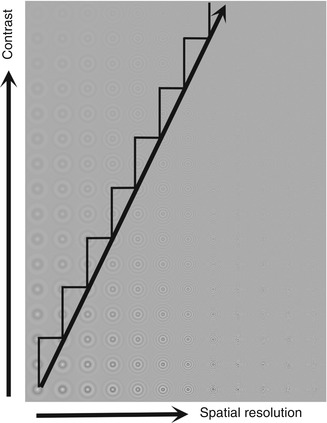
Fig. 9.12
Schematic representation of the stimuli used for Pulsar perimetry. The target is a two-dimensional sinusoidal grating pattern with reduced visibility at the edges by tapering the contrast. In the diagram contrast becomes greater from the top to the bottom of the graph and spatial frequency increases from left to right. The white sawtooth line indicates the spatial frequency and contrast steps used to obtain a detection threshold
To date, it has been determined that Pulsar Perimetry is at least as effective as FDT perimetry in detection of early glaucomatous visual field loss, has very good test-retest reproducibility, and has a negligible learning and practice effect for observers with prior experience with other forms of visual field testing [1–4]. At the present time, there is limited information available concerning the clinical utility of Pulsar Perimetry, but preliminary evaluations suggest that it may be a useful clinical tool. Future studies will be needed to determine its value for routine clinical assessment. Bibliography
1.
Gonzalez-Hernandez M, Garcia-Feijoo J, Mendez MS, de la Rosa MG. Combined spatial, contrast, and temporal functions perimetry in mild glaucoma and ocular hypertension. Euro J Ophthalmol. 2004;14:514–22.
2.
Gonzalez-Hernandez M, de la Rosa MG, de la Vega RR, Hernandex-Vidal A. Long-term fluctuation of standard automated perimetry, pulsar perimetry and frequency doubling technology in early glaucoma diagnosis. Ophthalmic Res. 2007;39:338–43.
3.
Zeppieri M, Brusini P, Parisi L, Johnson CA, Sampaolesi R, Salvatet ML. Pulsar perimetry in the diagnosis of early glaucoma. Am J Ophthalmol. 2010;149:102–12.
4.
Salvatet ML, Zeppieri M, Parisi L, Johnson CA, Sampaolesi R, Brusini P. Learning effect and test-retest variability of pulsar perimetry. J Glaucoma. 2013;22:230–7.
Motion Perimetry
The ability to detect target movement is a salient aspect of visual function in the periphery. Although movement perception has been a topic of interest to psychophysicists and physiologists for many years, it has only been in recent times that motion detection has been used as a clinical ophthalmic diagnostic tool [104–117]. There are two basic methods of conducting motion detection thresholds. One method evaluates the minimum spatial displacement of a target on a uniform background [104–106], and the other uses either a variable size random cluster of small dots that moves in the same direction while other dots are stationary (size thresholds) [107–109] or a proportion of dots move coherently in the same direction while other dots are moving randomly (coherence thresholds) [110–116]. Each of these procedures has been reported to be effective in detecting early glaucomatous visual field loss.
This visual field test procedure is quite robust, being minimally affected by the effects of moderate amounts of blur, contrast variations, and background luminance levels [118]. In addition, motion detection thresholds are a simple response property for peripheral visual function assessment, and most subjects prefer this procedure to standard automated perimetry methods. The reliability and reproducibility of motion perimetry are also quite good. Figure 9.13 presents an example of motion perimetry obtained in the left eye of a patient with glaucomatous visual field loss, using the techniques that present motion of a cluster of dots within a larger group of stationary dots.
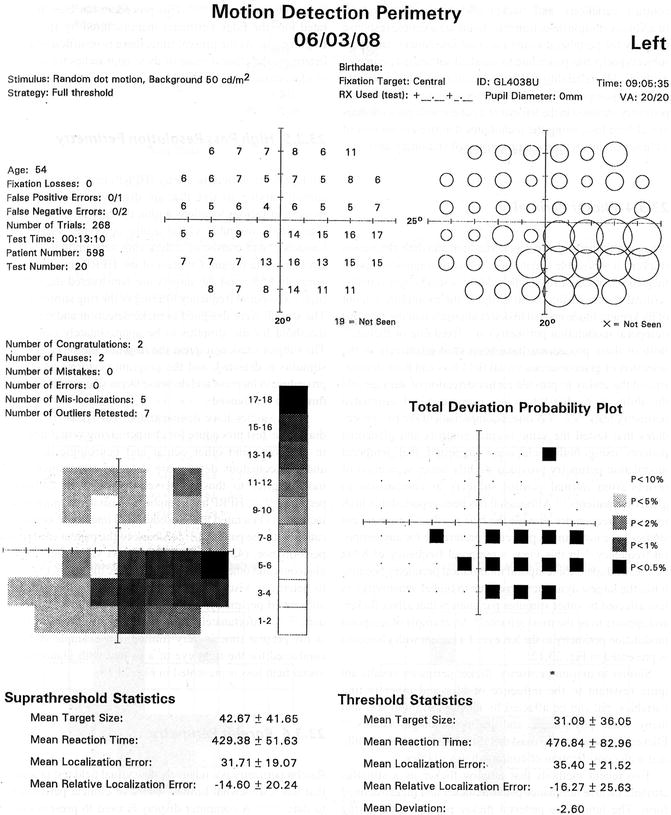
Fig. 9.13
Motion perimetry results for the left eye of a patient with inferior arcuate glaucomatous visual field loss
Flicker Perimetry
When a stimulus undergoes periodic light and dark alternation (flicker), it is possible to determine either the highest temporal frequency that can be distinguished from a steady light stimulus (critical flicker fusion)or to evaluate the minimum amount of flicker amplitude needed to detect alternation of the stimulus (temporal modulation perimetry) at a fixed rate of flicker [119]. Both of these procedures have been used effectively in the detection of glaucomatous visual field loss and have demonstrated the ability to provide earlier detection of damage and the ability to predict future loss using standard automated perimetry tests [68, 119–125]. A direct comparison of the two procedures that tested the same normal controls and glaucoma patients using both techniques suggested that temporal modulation perimetry provided slightly better separation of results from normal control subjects in comparison to glaucoma patients [119]. Although it has been reported that high temporal frequencies provide the best results [121], more recent studies have not found a particular preference for any temporal frequency [68]. In this view, a temporal frequency of 8 Hz has been adopted for temporal modulation perimetry because it has the largest dynamic range (due to higher sensitivity), is less affected by other stimulus parameters that affect flicker, and appears to be the most reliable [68]. An example of temporal modulation perimetry in the left eye of a patient with glaucoma is presented in Fig. 9.14.
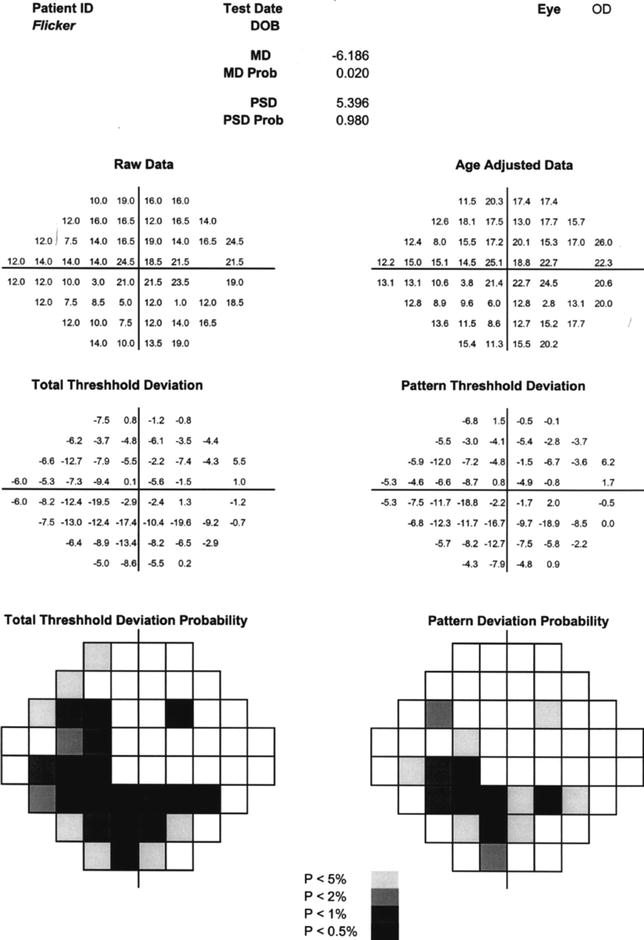
Fig. 9.14
Flicker perimetry results for the left eye of a patient with inferior arcuate glaucomatous nerve fiber bundle visual field loss. For this procedure the amplitude of flicker is varied for a constant flicker frequency of 8 Hz
Similar to motion perimetry, flicker perimetry results are quite resistant to the influence of blur and other testing variables but can be affected by changes in pupil size and many other physiological and pathophysiological factors [126–130]. Flicker perimetry testing must therefore be performed carefully and with consideration of confounding variables.
Two recent methods that employ flicker as a stimulus attribute include luminance pedestal flicker and flicker-defined form. Luminance pedestal flicker presents a flickering stimulus that is superimposed onto a steady pedestal of light, and the subject’s task is to determine whether the stimulus appears to be flickering or steady [131, 132]. Flicker-defined form presents a number of stimuli that are undergoing rapid temporal alternation, except that one of the targets is flickering in counterphase to the others (i.e., is dark when the others are light and vice versa) [133–135]. This procedure has been incorporated into the edge perimeter manufactured by Heidelberg Engineering. At the present time, there is insufficient data to determine the clinical value of these approaches for detection of glaucomatous visual field loss.
High-Pass Resolution Perimetry (HPRP)
High-pass resolution perimetry (HPRP) uses a series of ring stimuli varying in size that are displayed on a computer monitor at various locations within the central visual field [136]. The stimuli resemble visual acuity optotypes such as the Landolt C and consist of a dark ring surrounding a central circular white region. Contrast of the HPRP rings is approximately 85 %, and the targets are constructed digitally by high-pass spatial frequency filtering of the ring stimulus [136]. The stimuli were designed to make detection and resolution threshold for the stimulus to be approximately equivalent. The subject’s task is to press the response button each time a stimulus is detected, and the program performs a staircase procedure to increase and decrease target size until a detection threshold is achieved.
Many studies have demonstrated that HPRP is a useful diagnostic test procedure for characterizing visual field loss in glaucoma and other ocular and neurologic disorders, and glaucomatous deficits are detected approximately 18 months prior to those observed for standard automated perimetry [136–144]. HPRP has a number of desirable characteristics, including (1) a rapid test procedure, (2) interactive communication with the patient, (3) feedback to the patient concerning performance, (4) good ability to detect visual field loss in glaucoma and other ocular and neurologic disorders, (5) ability to determine visual field progression earlier than standard automated perimetry, and (6) an easy to follow test procedure [136–145]. Unfortunately, the commercial availability of HPRP at the present time is very limited. An example of HPRP conducted for the right eye of a patient with glaucomatous visual field loss is presented in Fig. 9.15.