Purpose
To determine the retinal nerve fiber layer (RNFL) thickness at which visual field (VF) damage becomes detectable and associated with structural loss.
Design
Retrospective cross-sectional study.
Methods
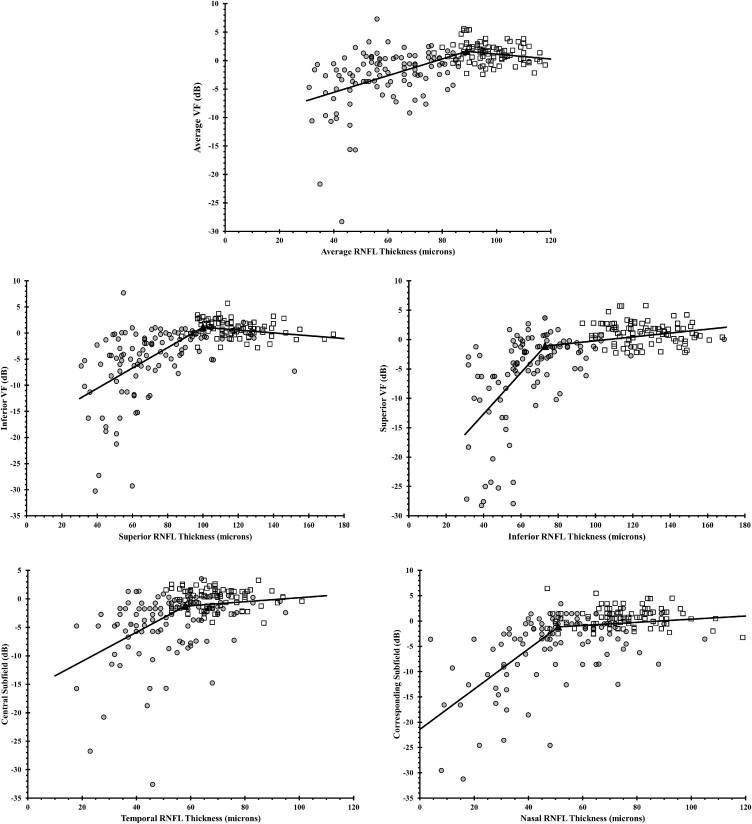
Eighty-seven healthy and 108 glaucoma subjects (1 eye per subject) were recruited from an academic institution. All patients had VF examinations (Swedish Interactive Threshold Algorithm 24-2 test of the Humphrey Visual Field Analyzer 750i) and spectral-domain optical coherence tomography RNFL scans. Comparison of RNFL thickness values with VF threshold values showed a plateau of VF threshold values at high RNFL thickness values and then a sharp decrease at lower RNFL thickness values. A broken stick statistical analysis was used to estimate the tipping point at which RNFL thickness values are associated with VF defects. The slope for the association between structure and function was computed for data above and below the tipping point.
Results
The mean RNFL thickness value that was associated with initial VF loss was 89 μm. The superior RNFL thickness value that was associated with initial corresponding inferior VF loss was 100 μm. The inferior RNFL thickness value that was associated with initial corresponding superior VF loss was 73 μm. The differences between all the slopes above and below the aforementioned tipping points were statistically significant ( P < .001).
Conclusions
In open-angle glaucoma, substantial RNFL thinning or structural loss appears to be necessary before functional visual field defects become detectable.
Glaucoma causes damage to the retinal ganglion cells (RGCs), their axons, and associated glial cells. This damage leads to characteristic structural changes of the optic disc and retinal nerve fiber layer (RNFL) and functional loss of vision.
Glaucoma specialists acknowledge the important challenges of detecting early glaucomatous damage and its progression over time. It has been reported that substantial RGC loss may occur at a specific location before a corresponding visual field loss is detected. Visual field testing is subjective and prone to inter-test variability, whereas optical coherence tomography (OCT) imaging of RNFL thickness measurements is objective. Nevertheless, both structural and functional tests are important in assessing early damage and progression in glaucoma.
The ability of any model to correlate structure and function depends on the map that is being used to accurately relate specific standard automated perimetric (SAP) field regions to their corresponding RNFL sectors. The Garway-Heath map is an example of one such model that has been validated in many previous studies. Wollstein and associates used the broken stick tipping point model to determine how much structural damage, as measured by Cirrus HD-OCT, is needed before functional loss is detected by visual field testing. Our study complements that work by using the Spectralis machine in a larger group of glaucoma patients. The main purpose of this paper is to determine the RNFL tipping point, or the RNFL values at which visual field loss is first detected.
Methods
Data Collection
We did a retrospective review of patients who were seen at the Glaucoma Service at the Massachusetts Eye and Ear Infirmary between February 1, 2009 and December 31, 2011. Study protocols were approved by the Massachusetts Eye and Ear Infirmary Institutional Review Board and were in accordance with the Health Insurance Portability and Accountability Act. The research adhered to the tenets of the Declaration of Helsinki for research involving human subjects. Study participants were recruited from the ongoing SIG study (Spectral-Domain OCT in Glaucoma study).
Subjects were included if they were either healthy volunteers or open-angle glaucoma patients aged 18 years or older. Subjects were excluded if any of the following were present: corneal scarring, media opacities, anterior segment dysgenesis, past chronic steroid use, history of diabetic retinopathy, or any other disease or medical treatment that might independently affect VF or retinal thickness. Other exclusion criteria included history of intraocular surgery except for uncomplicated cataract extraction at least a year prior to enrollment, best-corrected visual acuity worse than 20/40, refractive error outside the −6.00 to +6.00 diopter range, and any ocular abnormality other than glaucoma. One eye of each subject was randomly selected. In unilateral glaucoma cases, the affected eye was selected.
During the above study period, 195 eyes of 195 subjects were included in the current study after inclusion and exclusion criteria were applied.
Procedures
All patients had a complete history and eye examination by a glaucoma specialist (T.C.C.). Clinical data obtained included best-corrected visual acuity, Goldmann applanation tonometry, slit-lamp biomicroscopy, gonioscopy, pachymetry (PachPen; Accutome Ultrasound Inc, Malvern, Pennsylvania, USA), and dilated fundus examination. Age, race, sex, and spherical equivalent refractive error were recorded for all patients.
Visual field testing
Swedish Interactive Threshold Algorithm (SITA) 24-2 perimetry of the Humphrey Visual Field Analyzer 750i (Carl Zeiss Meditec, Dublin, California, USA) was performed in all subjects. Qualified tests had a false positive and a false negative of <20% and fixation losses of <33%. Healthy subjects had a glaucoma hemifield test (GHT) within normal limits and their mean deviation (MD) and pattern standard deviation (PSD) was within 95% of the healthy population. Glaucomatous visual fields (VFs) were defined as those with at least 1 of the following confirmed: GHT outside normal limits, or pattern standard deviation probability outside 95% of the healthy population.
VF total deviation values were recorded in all 52 testing points. The individual Humphrey visual field (HVF) values were grouped to correspond with sectors or regions on the spectral-domain optical coherence tomography (SDOCT) printout. This structure-function correlation was modeled after the Garway-Heath map. Total deviation values were unlogged, and the average of all values in each group was log transformed back to decibel scale. A secondary analysis was performed to correlate the visual field MD with the mean RNFL thickness.
Spectral-domain optical coherence tomography imaging
All patients had peripapillary SDOCT RNFL thickness measurements (Spectralis; Heidelberg Engineering, Heidelberg, Germany). The Spectralis OCT has a scan speed of 40 000 A-lines per second. Eye movement tracking is achieved by the TruTrack image alignment software. Using this system, multiple images can be obtained from exactly the same location and then averaged to reduce speckle noise. Real-time eye tracking also compensates for many of the involuntary eye movements that can occur during image acquisition and that result in motion artifacts. The scan circle around the optic nerve is 12 degrees in diameter, and the scan circle diameter in millimeters therefore depends on the axial eye length. For a typical eye length, the circle would be approximately 3.5–3.6 mm in diameter.
The Spectralis OCT software (version 4.0) allows for automatic segmentation of the upper and lower borders of the RNFL to calculate the average RNFL thickness. Peripapillary RNFL thickness values are divided into 4 quadrants. The superior and inferior quadrants are further divided into nasal and temporal sectors. Using this approach, we have previously reported an excellent degree of reproducibility in the measurement of peripapillary RNFL thickness values using Spectralis OCT.
Statistical Methods
A scatterplot was first used to show the relationship between RNFL thickness and VF threshold values, and the relationship was then described by a smoothing curve to visually identify the RNFL thickness region that showed changes between a plateau and a steep decrease in the relationship. A series of broken stick regression models with specified tipping point in the identified region were then fitted into the data and the model with the highest R 2 value was chosen as the final model. The tipping point from the final model was reported, along with the slopes above and below the tipping point and their corresponding 95% confidence intervals. P values < .05 were considered statistically significant.
Results
Patient Characteristics
One hundred ninety-five subjects were recruited for the study: 87 healthy and 108 open-angle glaucoma subjects. Of the open-angle glaucoma patients, 84 had primary open-angle glaucoma, 16 had pseudoexfoliation glaucoma, and 8 had normal tension glaucoma. Demographics are summarized in Table 1 .
| Healthy (n = 87) | Glaucoma (n = 108) | P Value | |
|---|---|---|---|
| Age (y) | 53.5 ± 13.2 | 68.7 ± 11.5 | <.001 a |
| Female/male | 56/31 | 61/47 | .27 |
| Visual field MD (dB) | −0.6 ± 1.5 | −11.3 ± 7.8 | <.001 a |
| Visual field PSD (dB) | 1.4 ± 0.3 | 7.3 ± 3.6 | <.001 a |
| OCT mean RNFL (μm) | 97.2 ± 9.2 | 60.2 ± 15.9 | <.001 a |
| Spherical equivalent (diopters) | −0.3 ± 2.31 | −0.58 ± 1.96 | .36 |
The mean RNFL thickness was 97.2 ± 9.2 (CI: 95.3–99.1) μm for the healthy subjects. We applied the ISNT rule for peripapillary RNFL thickness values and found that 42 of the 87 normal subjects in our study (48.3%) followed the ISNT rule for RNFL, where the average RNFL thickness values decreased starting from the thickest quadrant inferiorly to the thinnest quadrant temporally ( Table 2 ). The mean RNFL thickness was thinner in the glaucoma subjects at 60.2 ± 15.9 (CI: 57.2–63.2) μm. Only 7 of 108 glaucoma patients (6.5%) followed the RNFL ISNT rule ( Table 2 ).
| Quadrant | Normal (n = 87) | Glaucoma (n = 108) |
|---|---|---|
| Mean ± SD [95% CI] (μm) | Mean ± SD [95% CI] (μm) | |
| Inferior | 126.5 ± 17.1 [122.9-130.1] | 67.0 ± 21.9 [62.9-71.1] |
| Superior | 117.0 ± 17.1 [113.4-120.6] | 71.3 ± 23.6 [66.8-75.8] |
| Nasal | 75.9 ± 13.8 [73.0-78.8] | 49.9 ± 19.1 [46.3-53.5] |
| Temporal | 69.0 ± 10.4 [66.8-71.3] | 52.4 ± 15.2 [49.5-55.3] |
| ISNT rule met a | 42/87 (48.3%) | 7/108 (6.5%) |
a The ISNT rule holds when the retinal nerve fiber layer (RNFL) is thickest in the inferior quadrant, followed by superior, nasal, and then temporal quadrants.
Scatterplots of RNFL thickness and VF threshold values demonstrated a range of RNFL thickness values that were unrelated to VF values, followed by a range of RNFL thickness values that exhibited a strong relationship between these 2 parameters ( Figure 1 ). Estimates of the statistically optimal tipping points between these 2 ranges for average and quadrant RNFL thicknesses are listed in Table 3 . Using the mean RNFL thickness values for the normal subjects in our cohort, the percentage of RNFL loss necessary to reach the tipping point was also calculated for the mean and quadrant RNFL thickness values. The tipping point for the mean RNFL measurement occurred after an 8.4% loss from the mean normal value and after a 14.5% and 42.3% loss in the superior and inferior quadrants, respectively ( Table 3 ).
| RNFL Area | RNFL Tipping Point (μm) | Mean Normal RNFL Thickness (μm) | Average Percent RNFL Thickness Loss Associated With Each Tipping Point Value |
|---|---|---|---|
| Global | 89 | 97.2 | 8.4% |
| Temporal quadrant | 58 | 69.0 | 15.9% |
| Superior quadrant | 100 | 117.0 | 14.5% |
| Nasal quadrant | 51 | 75.9 | 32.8% |
| Inferior quadrant | 73 | 126.5 | 42.3% |
The slopes below the tipping point were significantly different than a zero slope. The slopes below the tipping points were significantly steeper than the slopes above the tipping point for all locations. The slopes for VF threshold as a function of RNFL thickness above and below the tipping points are listed in Table 4 .
| RNFL Area | Slopes Below the Tipping Point (dB per μm) | Slopes Above the Tipping Point (dB per μm) | Difference Between the Slopes Below and Above the Tipping Point (95% CI) | P Value a | ||
|---|---|---|---|---|---|---|
| Slope (95% CI) | P Value a | Slope (95% CI) | P Value | |||
| Global | 0.15 (0.11-0.18) | <.001 | −0.04 (−0.13 to 0.04) | .30 | −0.2 (−0.3 to −0.09) | <.001 |
| Temporal quadrant | 0.26 (0.18-0.33) | <.001 | 0.04 (−0.04 to 0.11) | .35 | −0.22 (−0.35 to −0.09) | <.001 |
| Superior quadrant | 0.2 (0.16-0.23) | <.001 | −0.03 (−0.08 to 0.02) | .3 | −0.22 (−0.3 to −0.15) | <.001 |
| Nasal quadrant | 0.4 (0.32-0.5) | <.001 | 0.03 (−0.02 to 0.08) | .2 | −0.37 (−0.5 to −0.26) | <.001 |
| Inferior quadrant | 0.4 (0.28-0.42) | <.001 | 0.03 (0.01-0.06) | .024 a | −0.32 (−0.41 to −0.22) | <.001 |
Stay updated, free articles. Join our Telegram channel

Full access? Get Clinical Tree


