Corneal Topography
Christopher B. Courville
Stephen D. Klyce
Corneal surface topography plays a critical role in the performance of the visual system, accounting for two thirds of the eye’s total refractive power. Irregularities in corneal shape and tear film distribution can lead to severe degradation in the optical quality of the cornea and, therefore, markedly reduce visual acuity. Hence, being able accurately to measure corneal shape is extremely important. Detection of surface distortions has been difficult because of often subtle nature and, thus, they have often gone undetected with traditional biomicroscope examination. Although retinoscopy can detect the presence of surface distortions, it is unable to pinpoint the source of the aberrations. The keratometer, measuring only four spots on the corneal surface, is not adequate to detect surface distortions over any great area. These limitations led to the application of the Placido disc. Projecting a series of mires onto the corneal surface and adding an instant film camera allowed a more complete surface area to be analyzed; this approach was embodied in the Photokeratoscope by Nidek (Nidek PKS-1000) (1) and in the Corneascope by Kera Corp. (2). This tool provided more details of the cornea’s topography, but was limited to the management of relatively severe irregularities in the corneal surface such as occur in corneal grafts, moderately advanced keratoconus, and trauma.
It was the advent of refractive surgery—particularly radial keratotomy—into U.S. clinics in 1979 that drove the need for a more accurate analysis of corneal topography. With concurrent advances in digital computers, corneal topographers quickly evolved to serve the needs of refractive surgeons in preoperative screening and investigation of problematic outcomes such as halos, glare, and reduced contrast. This chapter reviews the current status of corneal topography and its association with wavefront analysis. The clinical applications of corneal topography are briefly introduced; these are covered in greater depth in the clinical sections of this text.
BASIC PRINCIPLES OF MEASUREMENT
As the number of commercial corneal topographers continues to grow, their optical principles and techniques have varied somewhat, but their common purpose has been to display corneal curvature. The corneal topographers that have found widespread use in the clinic are all based on Placido disc technology. The measurement of corneal curvature with the scanning slit, laser holographic interferometry, and rasterstereography have not enjoyed productive clinical use, but it is instructive to view the different approaches that have been tried. Corneal topographers that have been developed are listed in Table 9-1.
Placido Disc
The first modern corneal topographer, the Corneal Modeling System (Computed Anatomy, Inc., New York, NY) (3), carried forward the concept of the Placido disc coupled with digital image processing and analysis to measure corneal power; this approach remains the only proven technology owing to its sensitivity, reproducibility, relative freedom from movement artifact, and noninvasiveness. The Placido disc consists of a circular target of alternating concentric light and dark rings that are reflected from the convex, mirror-like corneal surface. The resulting image is captured with a charge-coupled device (CCD)-equipped digital camera and is used automatically to transform mire shapes into the three-dimensional shape and power of the corneal surface. Several computer algorithms are available with which to reconstruct a model of the corneal surface, but because there is no exact solution, approximations can lead to inaccuracies. Fortunately, these are usually confined to the corneal periphery (4,5). Although these techniques can be very accurate (5), some have limitations that can lead to the false indication of keratoconus (6).
Two general types of Placido target are available (Fig. 9-1). The large-diameter target is less sensitive to magnification errors because of its long working distance, but these devices tend to lose data from the periphery because of shadows caused by the nose and the brow. The small-diameter, cone-shaped targets do not suffer from shadow-induced data loss and can project mires well out onto the sclera, but must rely on very accurate range compensation for
accuracy. As a result, the small cone Placido devices may be a more amenable adjunct to accurate contact lens fitting.
accuracy. As a result, the small cone Placido devices may be a more amenable adjunct to accurate contact lens fitting.
TABLE 9-1. LIST OF COMMERCIALLY AVAILABLE CORNEAL TOPOGRAPHERS | |||||||||||||||||||||||||||||||||||||||||||||||||||||||||
|---|---|---|---|---|---|---|---|---|---|---|---|---|---|---|---|---|---|---|---|---|---|---|---|---|---|---|---|---|---|---|---|---|---|---|---|---|---|---|---|---|---|---|---|---|---|---|---|---|---|---|---|---|---|---|---|---|---|
|
Rasterstereography
An approach that avoids the uncertainties of the Placido approximation calculations is rasterstereography (7, 8, 9). A drop of fluorescein is instilled into the cul de sac and a grid or raster pattern of cobalt blue light is projected onto the anterior surface of the eye. The stereo images are captured and processed using triangulation to reconstruct the cornea’s topography without approximating algorithms. A limitation of this technique is that direct measurement of surface position does not yield the same sensitivity of measurement as does reflected image positions. This, along with the uncertain effects of fluorescein on tear film stability and structure, reduces rasterstereography’s apparent usefulness in the clinic, and a commercial device may not be currently available.
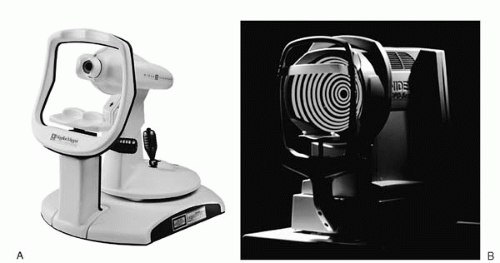 FIGURE 9-1. Two types of Placido target have been used in corneal topographers. A: The Nidek Magellan topographer uses the small, cone-shaped target. B: The Nidek OPD-Scan aberrometer/topographer uses the large-diameter target. |
Scanning Slit
Scanning slit technology allows the measurement of both anterior and posterior surfaces of the cornea. This was first implemented in the Corneal Modeling System (3). Because
both surfaces, along with corneal thickness, are needed accurately to calculate total corneal power, directly measuring the relative positions of the surfaces would seem to be a major advantage. This technique not only eliminates the need for elevation or shape measurement approximations, it has the important ability to measure corneal thickness over a broad area. The scanning slit measurement does have its limitations, however. First, measurement requires over 1 second for completion, leaving the data replete with motion artifact from fixation drift, muscle tremor, pulse, and nystagmus, which occur when the data are not captured in less than 30 msec. This error can be reduced with a tracking system or postcapture registration techniques, but this adds great expense and registration has proved difficult because landmarks are absent on the normally transparent cornea. Lack of sensitivity when reconstructing corneal topography from direct surface measurement is also a problem. To overcome this problem, corneal topography is measured with the addition of a Placido target in the Orbscan II model (Bausch & Lomb, Rochester, NY). Thus, although the scanning slit alone is not useful for measuring topography, there appears to be some utility in the thickness profiles that can be generated with this method.
both surfaces, along with corneal thickness, are needed accurately to calculate total corneal power, directly measuring the relative positions of the surfaces would seem to be a major advantage. This technique not only eliminates the need for elevation or shape measurement approximations, it has the important ability to measure corneal thickness over a broad area. The scanning slit measurement does have its limitations, however. First, measurement requires over 1 second for completion, leaving the data replete with motion artifact from fixation drift, muscle tremor, pulse, and nystagmus, which occur when the data are not captured in less than 30 msec. This error can be reduced with a tracking system or postcapture registration techniques, but this adds great expense and registration has proved difficult because landmarks are absent on the normally transparent cornea. Lack of sensitivity when reconstructing corneal topography from direct surface measurement is also a problem. To overcome this problem, corneal topography is measured with the addition of a Placido target in the Orbscan II model (Bausch & Lomb, Rochester, NY). Thus, although the scanning slit alone is not useful for measuring topography, there appears to be some utility in the thickness profiles that can be generated with this method.
Interferometry
The method with potentially the highest sensitivity is interferometry (10, 11, 12). Such techniques have been used by the optical industry to detect lens and mirror aberrations with subwavelength accuracy. With this procedure a reference surface, or its hologram, and the measured corneal surface are optically compared and the resulting interference fringes are used to calculate the difference between the two shapes. However, there is such wide variation in corneal shapes (even among normal subjects) that it is difficult to represent all variations with a single interference device.
PRESENTATION AND DISPLAY
Background
In 1981, Doss and coworkers (2,16) published a method for the automatic scanning of Corneascope photographs calculate corneal power. Klyce (17) took this a step further by devising a method for reconstructing corneal shape and power by digitally scanning the mires from Nidek photokeratoscope photographs and then displaying the data in a three-dimensional wire-mesh plot. Building on these advances, Maguire et al. (4) introduced the color-coded contour map as a display format for corneal powers, and this method soon became the international standard. Other, more recent developments include the plotting of contour maps directly onto the video image of the eye to relate scale and position, the display of multiple examinations simultaneously to view the progression of a disease or postsurgical results, and the construction of difference maps that aid in such aspects as showing early postoperative effects of a surgical procedure or the evolution of specific topographic features.
Units of Measure
Corneal topographers measure corneal surface curvature by design and, when used in contact lens fitting, this curvature is most usefully expressed in units of millimeters. However, when a corneal topographer is used to evaluate a pathologic process, the optics of the eye, and refractive errors, it is more convenient for the clinician to evaluate corneal power in units of diopters (D). It is important to distinguish between corneal surface power and total corneal power. Corneal surface power should be calculated using Snell’s law from the gradient in refractive index between air (1.000) and cornea (1.376). The curvature of the average corneal surface is 7.85 mm. The refractive power of that surface is 0.367/7.85 × 1000 mm/m or approximately 48 D. However, by convention from keratometry, clinicians have been accustomed to converting curvatures to the equivalent power of the whole cornea; this is done using the “keratometric index” (0.3375). Hence, the average corneal power becomes 0.3375/7.85 × 1000 mm/m or close to 43 D. This may seem confusing at first, but the latter calculation converts corneal topography measurements to the clinically familiar K reading values, and for this reason one of the first indexes that was derived for corneal topography data was the Simulated Keratometry (SimK) reading. One important caveat is that keratometry does not approximate well the power changes that occur with most refractive surgical procedures (18,19). The tissue subtraction procedures such as laser in situ keratomileusis change the anterior corneal curvature (but not the posterior surface) and corneal thickness. To calculate the refractive effect of changing corneal anterior surface curvature, one should use the refractive index, 1.376, whereas for general clinical use, the keratometric power with the index 1.3375 has been preferred.
Color-Coded Contour Map
With the introduction of the color-coded contour map, clinicians can now view topographic information through color association and pattern recognition (4). The palette of colors chosen was constructed so that powers near normal levels appear as green, lower powers as cool colors,
and higher than normal powers as warm colors (Fig. 9-2). Furthermore, only a few identifiable colors are selected for the central range of corneal powers so that specific power intervals can be identified easily. This allows for the recognition of certain characteristic patterns in corneal topography such as a cylinder, which presents as a “bow-tie” pattern (Fig. 9-3); keratoconus, which is characterized by a local area of steepening (Fig. 9-4); and pellucid marginal degeneration (usually inferior arcuate steepening; Fig. 9-5), as well as characteristics associated with refractive surgery, including optical zone size, centration, and, occasionally, defects such as central islands (Fig. 9-6).
and higher than normal powers as warm colors (Fig. 9-2). Furthermore, only a few identifiable colors are selected for the central range of corneal powers so that specific power intervals can be identified easily. This allows for the recognition of certain characteristic patterns in corneal topography such as a cylinder, which presents as a “bow-tie” pattern (Fig. 9-3); keratoconus, which is characterized by a local area of steepening (Fig. 9-4); and pellucid marginal degeneration (usually inferior arcuate steepening; Fig. 9-5), as well as characteristics associated with refractive surgery, including optical zone size, centration, and, occasionally, defects such as central islands (Fig. 9-6).
Stay updated, free articles. Join our Telegram channel

Full access? Get Clinical Tree


