Fig. 6.1
(a) Slit lamp image confirming corneal riboflavin uptake and anterior chamber flare. (b) Photograph of patient being treated with UVA 365 nm light at an irradiance of 3.0 mW/cm2
6.3 Clinical Outcomes
6.3.1 Visual Acuity and Refractive Outcomes
Generally, CXL appears to stabilize visual acuity and in many cases offers a modest improvement to patient’s uncorrected and best correct vision. Previous work has shown that, on average, at 1 year postoperatively, uncorrected vision changed by 0–2.7 Snellen lines (Caporossi et al. 2010; Vinciguerra et al. 2009a; Hersh et al. 2011). In a study of 71 eyes, performed by one of the authors (PSH) as a part of the US multicenter clinical trial of collagen cross-linking, about 25 % of patients gained two or more Snellen lines of uncorrected vision, and about 8.5 % patients lost two or more lines of uncorrected visual acuity at 1 year (Fig. 6.2a) (Hersh et al. 2011).
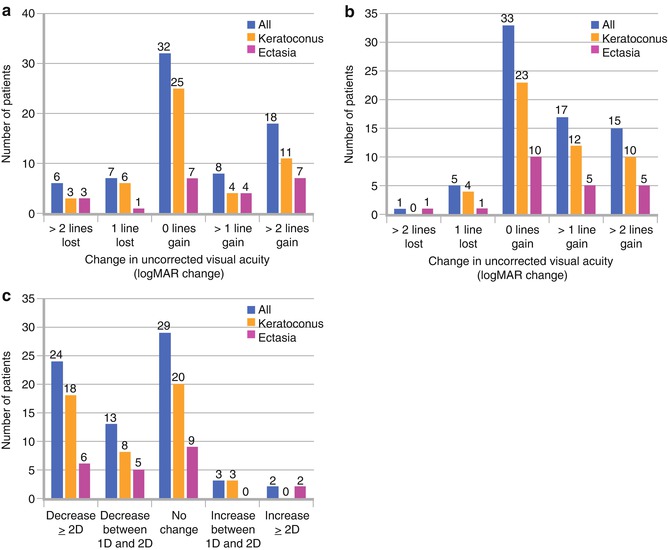
Fig. 6.2
(a) Number of individual patients who experienced a change in UCVA Snellen lines between baseline and 12 months after CXL. (b) Number of individual patients who experienced a change in BSCVA Snellen lines between baseline and 12 months after CXL. (c) Number of individual patients who experienced a change in maximum keratometry (D) between baseline and 12 months after CXL (Hersh et al. 2011)
In our study, while improvement of patient’s uncorrected visual acuity after CXL was notable, more clinically significant was the improvement of best corrected visual acuity. Mean 1 year best corrected visual acuity significantly improved by about 1 Snellen line, from logMAR 0.35 ± 0.24 (Snellen acuity = 20/45) to 0.23 ± 0.21 (Snellen acuity = 20/34). Postoperative improvement of best corrected visual acuity has been noted in numerous other CXL studies as well. Vinciguerra et al. (2009a, b) found that in patients with stage III keratoconus, mean best corrected vision (logMAR) improved from 0.28 to 0.14 at 12 months postoperatively. At 1-year follow-up, Raiskup-Wolf et al. (2008) and Caporossi et al. (2010) reported significant improvements in best corrected vision of logMAR 0.08 and 1.34 Snellen lines, respectively, with continued improvement after 1-year follow-up. In our study (Hersh et al. 2011), about 21 % of patients gained two or more Snellen lines of best corrected visual acuity, and only one patient (1.4 %) lost two or more lines of best corrected visual acuity (Fig. 6.2b). More recently, another study reported about 40 % of patients gained two or more lines postoperatively; however, 12 % of patients in this study lost two or more lines of best corrected vision as well (Asri et al. 2011).
Regarding refractive outcomes, significant changes in manifest astigmatism of 0.93 D (Raiskup-Wolf et al. 2008) and 0.26 D (Vinciguerra et al. 2009a) have been reported. However, in other studies, mean manifest astigmatism essentially remained unchanged following CXL (Hersh et al. 2011). A vector and double-angle plot analysis, performed 1 year after CXL, revealed that mean induced astigmatism at 12 months, compared with preoperative values, was 0.75 D × 76°. Mean induced astigmatism was 0.99 × 88.8 and 0.65 × 44.7, in the right and left eyes, respectively. These refractive analyses suggest that there are directional changes in the cones and cylinder of keratoconus patients following CXL; however, the changes are random and unpredictable (Hersh et al. 2011).
6.3.2 Topographic Outcomes
Maximum keratometry is a key topographic indicator of the success of CXL, since it measures, to some extent, the severity of the keratoconic cone. In the literature, average flattening of maximum keratometry ranges from about 1D to 3D, 1 year after CXL (Wollensak et al. 2003a; Caporossi et al. 2010; Vinciguerra et al. 2009a; Hersh et al. 2011; Caporossi et al. 2006; Koller et al. 2011). Furthermore, Raiskup-Wolf et al. (2008) and Caporossi et al. (2010) reported a continued flattening of maximum keratometry after 1-year follow-up. Individually, maximum keratometry decreased by 2D or more in 21 to 35 % of patients, change between −2D and 2D in 62.0 to 68 % of patients (essentially remaining stable), and steepen by 2D or more in 3 to 6 % of patients (Fig. 6.2c) (Hersh et al. 2011; Asri et al. 2011).
6.3.3 Topographic Keratoconus Indices
In general, topographic keratoconus indices (Table 6.1) are elevated over normal in patients with keratectasia and, therefore, a significant decrease in any of these postoperative measurements after CXL may indicate improvement in the contour of the cornea. Koller et al. (2011) reported a significant improvement in four of seven Pentacam topography indices [central keratoconus index (CKI), keratoconus index (KI), index of height asymmetry (IHA), and minimum radius of curvature (R min)] 1 year after CXL. Similarly, we noted an improvement in four of seven indices, including KI and R min as in the aforementioned study, but additionally, our study revealed improvements of index of surface variance (ISV) and index of vertical asymmetry (IVA) (Greenstein et al. 2011). The improvements observed in ISV indicate a decrease of the curvature variation compared to the mean curvature of the cornea, and IVA, a measurement of the difference between the superior and inferior curvature of the cornea, which may be analogous to an improvement in the more commonly used I-S ratio (Rabinowitz 1995). Furthermore, improvement in KI may indicate that there is a normalization of the keratoconic topographic appearance postoperatively (Fig. 6.3). The overall improvements in the above indices suggest, in general, that the cone is flattening and that the post-CXL cornea is becoming more optically regular and symmetric; however, it is unclear why, in the previous two studies, the improvements were demonstrated, in part, by different Pentacam indices.
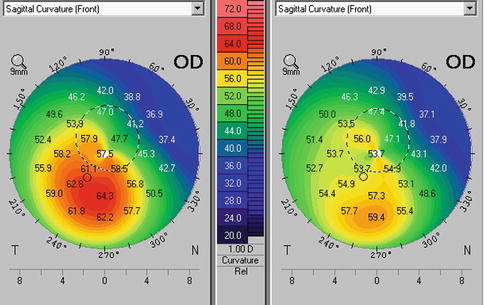
Table 6.1
List of the abnormal and pathological values for the Pentacam topographic indices (User manual for the Pentacam Oculus, Wetzlar, Germany)
Index | Description of index | Abnormal | Pathological |
|---|---|---|---|
ISV | A general measure of corneal surface irregularity | ≥37 | ≥41 |
IVA | A measure of the difference between superior and inferior curvature in the cornea | ≥0.28 | ≥0.32 |
KI | As determined by the Pentacam | ≥1.07 | ≥1.07 |
CKI | As determined by the Pentacam | ≥1.03 | ≥1.03 |
R min | A measurement of the smallest radius of curvature of the cornea | <6.71 | <6.71 |
IHA | A similar measurement to IVA, but based on corneal elevation | ≥19 | >21 |
IHD | A calculation with Fourier analysis of corneal height to quantify the degree of vertical decentration | ≥0.014 | ≥0.016 |
Fig. 6.3
Corneal topography before (left) and 1 year after CXL (right). Note improvement in corneal contour
6.3.4 Higher-Order Aberrations
Increased anterior corneal, posterior corneal, and total ocular higher-order aberrations are optical sequelae of keratoconus which contribute to the diminished visual function found in these corneal disease processes (Lim et al. 2007; Schlegel et al. 2009). Corneal collagen cross-linking, although developed primarily to mitigate progression of ectatic corneal processes, as discussed previously, has been found to improve visual acuity in many patients as well. Detailed analyses of higher-order aberrations showed significant improvements in ocular and anterior corneal higher-order aberrations 1 year after CXL (Fig. 6.4a–c) (Vinciguerra et al. 2009a; Hersh et al. 2011; Greenstein et al. 2012a). This finding corroborates the improvement in corneal topography seen. Although improvement both in topography and in aberration profile would be expected to improve vision, interestingly, neither the corneal nor total ocular aberrations were statistically associated with the improvements of postoperative visual acuity in our study. Furthermore, there did not appear to be any clinically relevant associations between improvement of higher-order aberrations and improvement of any subjective visual symptoms (e.g., glare, halos, sunbursts, etc.) after cross-linking as well (Greenstein et al. 2012a). Notwithstanding these statistical analyses, a general decrease in higher-order aberrations and improvement in corneal topographic contour would be expected to have overall beneficial effects to the patients visual function.
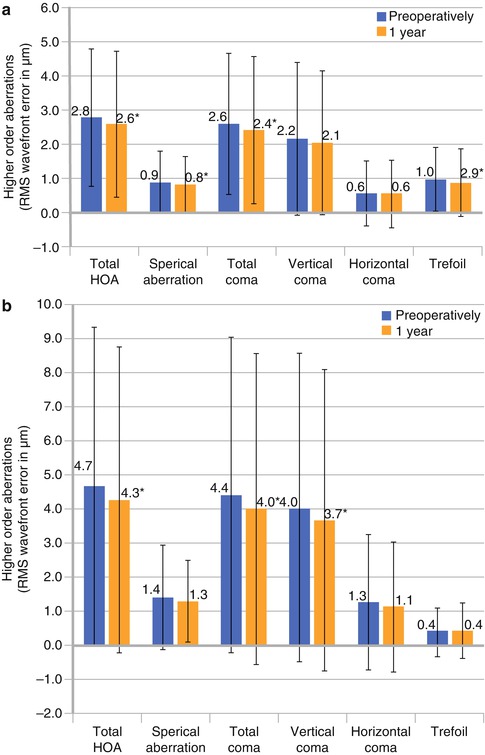
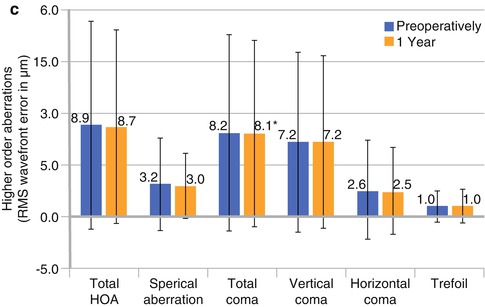
Fig. 6.4
Higher-order aberrations (root mean squared wave front error), measured preoperatively and at 1 year after CXL. Error bars represent 2 standard deviations from the mean. *Indicates a significant change compared to preoperative measurements (P < 0.05). (a) Total ocular aberrations. (b) Anterior corneal aberrations. (c) Posterior corneal aberrations (Greenstein et al. 2012a)
6.3.5 Patient Satisfaction
In an effort to expand on the objective postoperative assessment of the cross-linking procedure and to further elucidate the expected clinical response, a self-reported analysis of patients’ optical symptoms and visual function was instructive. In our study, we found that patients generally noted subjective improvement in visual symptoms. Specifically, night driving, difficulty reading, diplopia, glare, halo, starbursts, and foreign body sensation were all improved 1 year after CXL (Fig. 6.5) (Brooks et al. 2012). In addition to corroborating the objective postoperative improvements after corneal collagen cross-linking, this speaks to the positive subjective patient satisfaction after the procedure.
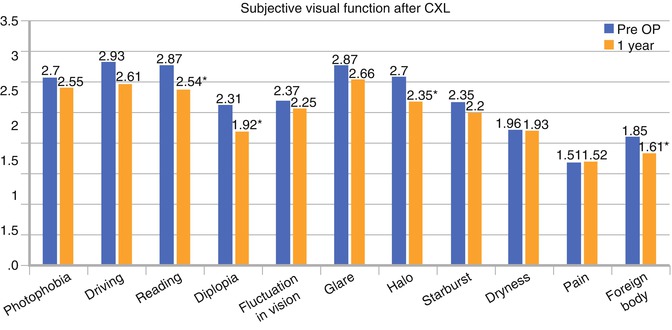
Fig. 6.5
Average rating of subjective visual parameters for keratoconus subgroup preoperatively and at 12 months after CXL. Subjective scale 1–5 (1 = no symptoms, 5 = severe symptoms). *Statistically significant (p < 0.05) (Brooks et al. 2012)
6.3.6 Postoperative Timecourse
Looking at the clinical timecourse after cross-linking, there was a significant worsening of vision and steepening of the keratoconic cones at 1 month postoperatively. These changes appear to improve at about 6 months and plateau thereafter (Fig. 6.6a). Interestingly, these postoperative outcomes appear to be congruous with the postoperative thinning and cross-linking-associated corneal haze changes over time (Fig. 6.6b). It is unclear whether this suggests a remodeling occurring during a “desired” haze and thinning process or if this time course suggests a natural process of corneal would healing irrespective of the changes in cross-linking-associated corneal haze and postoperative thinning (see Sect. 6.5).
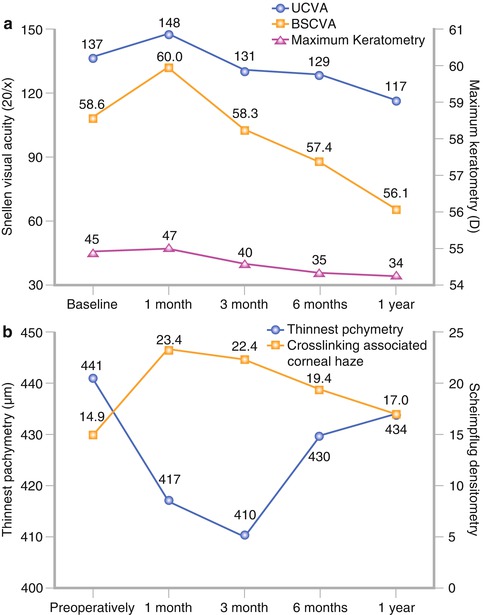
Fig. 6.6
(a) Change in UCVA, BSCVA, and maximum keratometry over time. (b) Change in thinnest pachymetry and cross-linking-associated corneal haze over time (Hersh et al. 2011)
6.4 Biomechanical Changes
In vitro, corneal collagen cross-linking has been reported to increase the biomechanical stability of the ecstatic cornea in keratoconus (see Sect. 6.2). Currently, the Ocular Response Analyzer (ORA, Reichert Inc., Buffalo, NY, USA) is one of the few commercially available tools to measure in vivo corneal biomechanics. Two core metrics are used to describe the biomechanical strength of the cornea: corneal hysteresis (CH) and corneal resistance factor (CRF). CH is a measurement of the viscous dampening in corneal tissue, and CRF is a measurement of the entire viscoelastic response of the cornea, in response to both the graded and time-dependent applanation pressures applied by the ORA. To measure CH and CRF, a tube is automatically aligned with the patient’s eye, and an air puff is released of a specific time and pressure gradient. Concomitant with the air pulse, the ORA measures two applanation pressures: the first pressure is measured when the cornea is moving inward, and the second pressure is measured when the cornea returns to its original position. In addition, a waveform of this temporal corneal deformation is captured. Measurements derived from the waveform signal such as peak amplitudes, timing of peaks, width of peaks, and others, have been used to determine the biomechanical properties of individual corneas (Kerautret et al. 2008; Fry et al. 2008; Gatinel and Luce 2009; Lam et al. 2010).
In vivo biomechanical measurements, CH and CRF appear to remain unchanged 1 year after CXL (Fournie et al. 2009; Goldich et al. 2009; Vinciguerra et al. 2010; Greenstein et al. 2012). Interpreting these results is challenging, since postoperative changes to either the viscous or elastic components of the cornea may be too subtle for these ORA metrics to capture and may in part contribute to the lack of significant results (Touboul et al. 2008; Glass et al. 2008). Moreover, the surface optical irregularity of these ectatic corneas may introduce error and variability into the ORA signal that may prevent meaningful quantitative comparison of preoperative and postoperative CH and CRF (Vinciguerra et al. 2009a; Shah et al. 2006). It is also possible that the biomechanical changes after CXL are inherently different than those measured by CH and CRF, and therefore, these metrics may not capture the true biomechanical effect of CXL over time. Development of interpretive models of the waveform itself, similar to those used to grade keratoconus, may better capture the true biomechanical properties of the cornea after CXL (Fry et al. 2008; Gatinel and Luce 2009). Moreover, development of new instrumentation to assess corneal biomechanics will help to better assess the stiffening effects of the cross-linking procedure clinically.
6.5 Complications
6.5.1 Postoperative Haze
On clinical examination, corneal haze has been noted after the cross-linking procedure (Fig. 6.7). Cross-linking-associated corneal haze is different in clinical character from haze after other procedures such as excimer laser photorefractive keratectomy. The former is a dustlike change in the corneal stroma or a mid-stromal demarcation line (Seiler and Hafezi 2006), whereas the latter has a more reticulated subepithelial appearance. Cross-linking-associated corneal haze is most likely a measure of backscattered and reflected light, causing decreased corneal transparency (Caporossi et al. 2010). This haze can be graded at the slit lamp (Wollensak and Iomdina 2009); however, grading slit lamp haze is subject to observer interpretation and is difficult to measure objectively. Moreover, corneal haze has been confirmed using confocal microscopy as well and can be objectively quantified using Scheimpflug densitometry (Fig. 6.8) (Mazzotta et al. 2007).
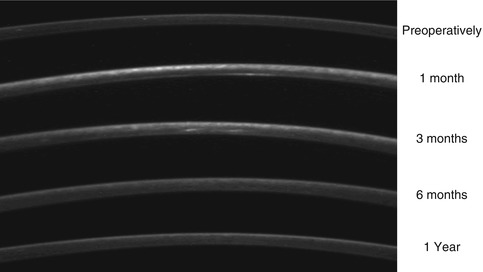
Fig. 6.7
Typical corneal stromal haze after collagen cross-linking
Fig. 6.8
Scheimpflug images of cross-linking-associated corneal haze over time
Similar to the timecourse of clinical outcomes after cross-linking, there appears to be an increase in haze, which peaks at 1 month and plateaus between 1 and 3 months. Between 3 and 6 months, the cornea begins to clear and continues to return toward baseline at 1 year (Fig. 6.6b) (Greenstein et al. 2010).
To date, it remains unclear whether this postoperative haze is a true complication or rather a desired wound healing effect demonstrating the efficacy of the cross-linking procedure. Transparency of the cornea is a result of the regular spacing, small uniform diameter of the collagen fibrils (Vinciguerra et al. 2009a), and the cellular structure of stationary keratocytes (Hersh et al. 2011). Increased spacing and changes in fibril diameter could cause increased light scatter and decreased transparency. Furthermore, stationary keratocytes have crystallins in their cytoplasm that have a refractive index similar to that of the extracellular matrix. During wound healing, migratory keratocytes have decreased crystallins, leading to an increase in refracted light and a subsequent increase in haze (Hersh et al. 2011). In vitro and ex vivo studies have shown that collagen cross-linking led to an almost immediate loss of keratocytes in the corneal stroma (Gefen et al. 2009; Raiskup-Wolf et al. 2008). Confocal microscopy, in patients with keratoconus, revealed activated keratocytes repopulating the corneal stroma starting at 2 months, and stromal repopulation was almost complete at 6 months (Mazzotta et al. 2007). It is possible that these activated keratocytes contribute to the development of haze, as seen on Scheimpflug imagery. Additionally, a significant increase in collagen fibril diameter, with increased spacing between collagen fibrils, following UVA/riboflavin therapy may play an important role in the decreased corneal transparency as well (Wollensak et al. 2004b; Hersh et al. 2011).
6.5.2 Corneal Pachymetry
Corneal thinning is a general concomitant of the early CXL postoperative course (Fig. 6.6a). Previous studies have noted that intraoperative ultrasound pachymetry decreased after the initial 30 min of riboflavin administration (Wollensak et al. 2004a), and several others have noted corneal thickness changes after CXL (Seiler et al. 1998; Salgado et al. 2011; Hafezi et al. 2007; Roberts 2000; Wollensak and Iomdina 2009; Ahearne et al. 2008; Wollensak et al. 2004a, b). Postoperatively, similar to the timecourse of cross-linking-associated corneal haze, and cross-linking clinical outcomes, the cornea appears to thin at 1 and 3 months and to re-thicken between 3 and 12 months (Greenstein et al. 2011). At 1 year, cornea treated with standard dextran riboflavin alone remained slightly thinner than preoperative measurements.
Stay updated, free articles. Join our Telegram channel

Full access? Get Clinical Tree


