Purpose
To evaluate the short-term functional and anatomic outcomes of patients with persistent diabetic macular edema (DME) who were converted from bevacizumab and/or ranibizumab to aflibercept.
Design
Retrospective, interventional, noncomparative, consecutive case series.
Methods
Only eyes treated with at least 4 consecutive injections of ranibizumab/bevacizumab spaced 4–6 weeks apart prior to conversion and with at least 2 aflibercept injections afterward were considered for inclusion. Pertinent patient demographic, examination, and treatment data were extracted from clinical charts and tabulated for analysis.
Results
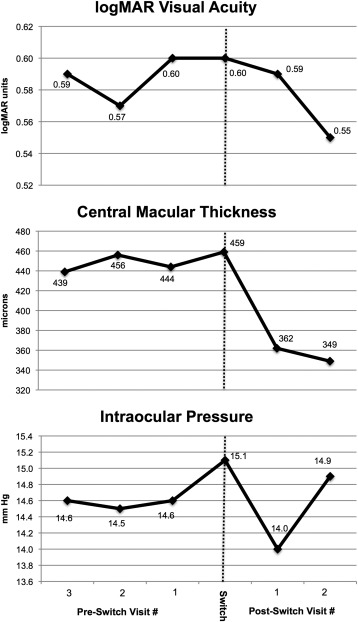
Fifty eyes of 37 patients were included. Eyes received a mean of 13.7 bevacizumab/ranibizumab injections prior to conversion, followed by 4.1 aflibercept injections over 4.6 months of subsequent follow-up. The mean logMAR visual acuity at the pre-switch visit was 0.60 ± 0.43 (Snellen equivalent, 20/80). This improved to 0.55 ± 0.48 (Snellen equivalent, 20/70) by the second visit after conversion, corresponding to a mean logMAR change of −0.05 ± 0.22 ( P = .12). The average central macular thickness from the pre-switch spectral-domain optical coherence tomography scan was 459.2 ± 139.2 μm. This significantly improved to 348.7 ± 107.8 μm by the second visit following conversion, reflecting a mean decrease of 112 ± 141 μm ( P < .0001). The mean intraocular pressure (IOP) recorded at the pre-switch visit was 15.1 ± 3.3 mm Hg. At the second follow-up after converting to aflibercept, the IOP averaged 14.9 ± 3.2 mm Hg, with a mean decrease of 0.2 ± 3.0 mm Hg ( P = .63).
Conclusions
Conversion to aflibercept for persistent DME resulted in significant anatomic improvements. While trends towards improved visual acuity and reduction in IOP were observed, these were not statistically significant.
Diabetic macular edema (DME) is the leading cause of visual impairment in patients with diabetic retinopathy. In 2010, approximately 20.6 million out of a projected 92.6 million adults with diabetic retinopathy worldwide were estimated to have concurrent DME. This global healthcare burden will likely continue to increase at alarming rates, as some models estimate the number of diabetics will double by the year 2030.
With the Early Treatment Diabetic Retinopathy Study (ETDRS) in the 1980s, macular laser photocoagulation became the mainstay of DME management, and it remained the standard of care in the decades that followed. The advent of intravitreal pharmacotherapy agents, primarily driven by the class of vascular endothelial growth factor (VEGF) inhibitors, has since revolutionized how this condition is treated. Validated through the RISE and RIDE phase 3 clinical trials, ranibizumab (Lucentis; Genentech, South San Francisco, California, USA) became the first VEGF inhibitor approved by the Food & Drug Administration (FDA) for this indication in 2012. While off-label, bevacizumab (Avastin; Genentech) has been evaluated through smaller trials, such as the BOLT study. Most recently, aflibercept (Eylea; Regeneron, Tarrytown, New York) gained FDA approval to treat DME in July 2014 with the VIVID and VISTA phase 3 clinical trials.
While there is ample evidence supporting the safety and efficacy of the 3 anti-VEGF agents in the management of DME, a head-to-head comparison only recently became available when the Diabetic Retinopathy Clinical Research Network (DRCR) published the 1-year outcomes of its Comparative Effectiveness Study of Intravitreal Aflibercept, Bevacizumab, and Ranibizumab for DME (Protocol T). The results demonstrated that when baseline visual acuity (VA) loss was mild (≥20/40), there was no clinical difference between the 3 medications. However, when the initial acuity loss was more severe (≤20/50), a greater visual benefit was derived from aflibercept.
Since the FDA approval of aflibercept for DME, and in light of Protocol T’s findings, many retinal specialists are converting eyes from ranibizumab or bevacizumab to aflibercept with the goal of optimizing treatment outcomes, particularly in cases of refractory DME. In the current study, we evaluated the short-term functional and anatomic responses of patients with persistent DME after multiple previous anti-VEGF injections that were converted to aflibercept therapy.
Methods
Following approval from the Institutional Review Board at Wills Eye Hospital, a retrospective, interventional, noncomparative, consecutive case series of patients treated for DME at the Retina Service of Wills Eye Hospital and the outpatient offices of Mid Atlantic Retina was performed. Research adhered to the tenets of the Declaration of Helsinki and was conducted in accordance with regulations set forth by the Health Insurance Portability and Accountability Act.
Electronic billing records of all patients with DME (International Classification of Diseases, 9th revision code 362.07) seen between August 1, 2014 and March 31, 2015 were evaluated to identify eyes previously treated with ranibizumab (0.3 mg) and/or bevacizumab (1.25 mg) that were subsequently converted to aflibercept (2.0 mg) therapy. Eligible participants were aged 18 years or older with a history of diabetes mellitus (type 1 or type 2), baseline evidence of clinically significant macular edema as defined by the ETDRS, and commensurate center-involving DME (central macular thickness [CMT] ≥300 μm) by spectral-domain optical coherence tomography (SD OCT) imaging. Indications for transitioning to aflibercept included persistent exudative fluid on examination and/or SD OCT as determined by the treating physician. Persistent DME was defined as no reduction, incomplete resolution, or an increase in central subfield thickening by SD OCT, necessitating additional anti-VEGF therapy at the time of conversion. Only eyes treated with at least 4 consecutive injections of ranibizumab/bevacizumab performed at the exact same interval (eg, every 4, 5, or 6 weeks) prior to conversion and with at least 2 aflibercept injections afterward at that same interval were considered for study inclusion.
Patients were excluded if they had any of the following treatments during the 6-month period prior to anti-VEGF conversion or after: intravitreal or sub-Tenon injections of corticosteroids, corticosteroid implants, focal/grid macular laser photocoagulation, panretinal photocoagulation, cataract surgery, or pars plana vitrectomy. Additionally, individuals were excluded if they had any of the following concomitant ocular diseases aside from nonproliferative diabetic retinopathy in the treated eye: age-related macular degeneration, central/branch retinal vein occlusion, choroidal neovascularization, history of ocular trauma, or any other history of prior intraocular surgery (with the exception of cataract surgery >6 months prior to conversion). Treatment schedules as well as injection methods were at the discretion of the supervising retinal specialist. However, in order to mitigate any confounding effect from injection frequency, only eyes maintained on the same treatment interval after switching were included in this series. The pre-switch visit was defined as the date when conversion to aflibercept occurred.
Pertinent patient demographic, examination, and treatment data were extracted from clinical charts and tabulated for analysis. Snellen VA measurements were collected from patients using their most up-to-date distance correction or best pinhole correction. Intraocular pressure (IOP) recordings were performed using the handheld Tono-Pen XL (Medtronic Solan, Jacksonville, Florida, USA) prior to dilation and injection at each visit. Ancillary SD OCT scans obtained using the Heidelberg Spectralis (Heidelberg Engineering, Heidelberg, Germany) were reviewed at each visit to document the presence/absence of intraretinal/subretinal fluid and associated vitreoretinal interface abnormalities (vitreomacular adhesion [VMA], vitreomacular traction [VMT], or epiretinal membrane [ERM]). SD OCT images were interpreted independently by 2 experienced reviewers (E.R., A.S.). CMT values were obtained using the integrated software.
Statistical Analysis
Snellen VA was converted into logarithm of the minimal angle of resolution (logMAR) scores for statistical analysis. For evaluating the effect of switching to aflibercept on VA, CMT, and IOP, we performed the comparison of these outcomes at the pre-switch visit vs post-switch visits using generalized linear models. The intereye correlation was accounted for using generalized estimating equations. Similarly, we also performed the comparison of VA change from the pre-switch visit between eyes with VA ≥20/40 vs ≤20/50, and between eyes with vs without concurrent ERM present at the time of conversion. The outcomes at each visit were summarized as mean ± standard deviation. Statistical significance was set at P < .05. All analyses were performed using SAS v9.4 (SAS Institute Inc, Cary, North Carolina, USA).
Results
Sixty-five eyes were transitioned from bevacizumab, ranibizumab, or both to aflibercept between August 1, 2014 and March 31, 2015. A total of 15 eyes were excluded from the study for the following reasons: 9 eyes had an irregular treatment interval and follow-up schedule after conversion to aflibercept and 6 eyes reverted back to ranibizumab or bevacizumab therapy at some point after converting to aflibercept. Ultimately, a total of 50 eyes from 37 consecutive individuals with DME meeting inclusion criteria for the study were evaluated. The mean patient age ± standard deviation was 69.9 ± 9.4 years (range, 44–88 years). Baseline demographics and ocular characteristics are outlined in Table 1 .
| Age (y) | |
| Mean (SD) | 69.6 (9.4) |
| Median (min, max) | 71 (44, 88) |
| Sex | |
| Male | 19 (51.4%) |
| Female | 18 (48.6%) |
| Duration of known diabetes (y) | |
| Mean (SD) | 20.4 (10.3) |
| Median (min, max) | 21 (1, 43) |
| Hemoglobin A1c level | |
| Mean (SD) | 7.0 (0.9) |
| Median (min, max) | 7.1 (5.6, 9.5) |
| Hypertension | |
| No | 9 (24.3%) |
| Yes | 28 (75.7%) |
| Lens status | |
| IOL | 29 (58.0%) |
| Phakic | 21 (42.0%) |
| Number of anti-VEGF injections pre-switch | |
| Mean (SD) | 13.7 (6.1) |
| Median (min, max) | 13 (4, 30) |
| Anti-VEGF regimen pre-switch | |
| Ranibizumab only | 36 (72.0%) |
| Bevacizumab only | 2 (4.0%) |
| Both | 12 (24.0%) |
| Other prior treatments (>6 months from conversion) | |
| Panretinal photocoagulation | 14 (28%) |
| Focal macular laser | 22 (44%) |
| Intravitreal triamcinolone | 4 (8%) |
| Pars plana vitrectomy | 3 (6%) |
Treatment Characteristics
The average number of anti-VEGF injections the cohort received before transitioning to aflibercept was 13.7 ± 6.1 (median, 13; range, 4–30 injections). Thirty-six eyes (72%) had been treated with ranibizumab exclusively, 2 eyes (4%) were treated only with bevacizumab, and the remaining 12 eyes (24%) received some combination of both intravitreal agents. After conversion, a mean number of 4.1 ± 1.7 aflibercept injections (median, 4; range, 2–9 injections) were then performed over an average follow-up period of 4.6 ± 1.7 months (median, 4.5; range, 2–9 months). Clinical follow-up was available for all eyes through the second visit following aflibercept conversion, which averaged 2.5 ± 0.5 months (median, 2.3; range, 2–3 months). As such, this time point was used for primary outcome analysis. Beyond this visit, 29 eyes (58%) had 3 or more post-switch follow-ups, 22 (44%) had at least 4 follow-ups, and 10 (20%) had at least 5 follow-ups.
Visual Outcomes After Switching to Aflibercept
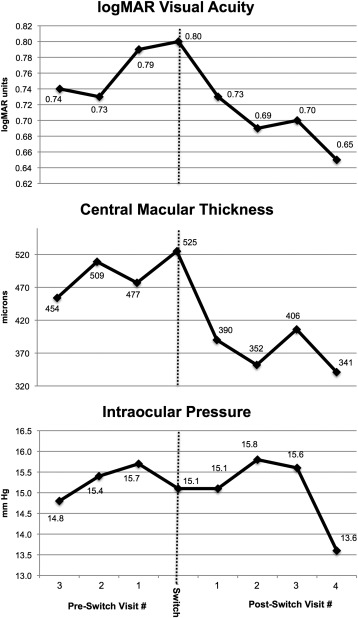
The mean logMAR VA of the affected eye at the pre-switch visit was 0.60 ± 0.43 (Snellen equivalent, 20/80). This improved to 0.55 ± 0.48 (Snellen equivalent, 20/70) by the second visit following conversion, corresponding to a mean logMAR change of −0.05 ± 0.22 ( P = .12). Notably, after 2 injections of aflibercept, 25 eyes (50%) had gained ≥1 line of vision, of which 11 (11/50; 22%) gained ≥2 lines and 6 (6/50; 12%) gained ≥3 lines. Consecutive VA measurements at subsequent visits are outlined in Table 2 and Figure 1 . While there was a trend toward improved mean VA during the course of treatment, this was not statistically significant overall. However, of note, the cohort that completed at least 4 post-switch visits (22 eyes, 44%) did experience a significant improvement in vision from a mean logMAR VA of 0.80 ± 0.52 at the pre-switch visit to 0.65 ± 0.46 at the fourth visit following conversion ( P = .003, Figure 2 ).
| 1 Visit Pre-switch | Pre-switch Visit | First Visit Post-switch | Second Visit Post-switch | Third Visit Post-switch | Fourth Visit Post-switch | |
|---|---|---|---|---|---|---|
| Eyes with data | 50 | 50 | 50 | 50 | 29 | 22 |
| VA levels, n (%) | ||||||
| 20/25 | 4 (8.0) | 3 (6.0) | 3 (6.0) | 6 (12.0) | 1 (3.5) | 2 (9.1) |
| 20/30 | 9 (18.0) | 4 (8.0) | 11 (22.0) | 7 (14.0) | 3 (10.3) | 3 (13.6) |
| 20/40 | 7 (14.0) | 9 (18.0) | 2 (4.0) | 7 (14.0) | 5 (17.2) | 1 (4.6) |
| 20/50 | 4 (8.0) | 6 (12.0) | 7 (14.0) | 6 (12.0) | 2 (6.9) | 2 (9.1) |
| 20/60 | 5 (10.0) | 4 (8.0) | 9 (18.0) | 6 (12.0) | 4 (13.8) | 3 (13.6) |
| 20/70 | 2 (4.0) | 3 (6.0) | 1 (2.0) | 2 (4.0) | 1 (3.5) | 1 (4.6) |
| 20/80 | 0 | 4 (8.0) | 4 (8.0) | 3 (6.0) | 3 (10.3) | 2 (9.1) |
| 20/100 | 6 (12.0) | 5 (10.0) | 1 (2.0) | 3 (6.0) | 2 (6.9) | 0 |
| 20/200 | 8 (16.0) | 9 (18.0) | 8 (16.0) | 7 (14.0) | 5 (17.2) | 6 (27.3) |
| 20/300 | 0 | 0 | 0 | 0 | 1 (3.5) | 0 |
| 20/350 | 1 (2.0) | 0 | 0 | 0 | 0 | 0 |
| 20/400 | 1 (2.0) | 1 (2.0) | 1 (2.0) | 0 | 1 (3.5) | 1 (4.6) |
| CF | 3 (6.0) | 2 (4.0) | 3 (6.0) | 3 (6.0) | 1 (3.5) | 1 (4.6) |
| Mean (SD) logMAR VA | 0.60 (0.48) | 0.60 (0.43) | 0.59 (0.47) | 0.55 (0.48) | ||
| Median (Q1, Q3) logMAR VA | 0.5 (0.2, 1.0) | 0.5 (0.3, 0.7) | 0.5 (0.2, 0.7) | 0.4 (0.2, 0.7) | ||
| VA change from pre-switch visit | ||||||
| Mean (SD) | −0.01 (0.2) | −0.05 (0.22) | −0.06 (0.20) | −0.14 (0.23) | ||
| P value from paired t test for comparison of mean | .63 | .12 | .09 | .003 | ||
| ≥3 lines gain, n (%) | 4 (8.0) | 6 (12.0) | 4 (13.8) | 4 (18.2) | ||
| 1–2 lines gain, n (%) | 15 (30.0) | 19 (38.0) | 5 (17.2) | 7 (31.8) | ||
| Within 1 line change, n (%) | 21 (42.0) | 16 (32.0) | 14 (48.3) | 10 (45.5) | ||
| 1–2 lines loss, n (%) | 5 (10.0) | 7 (14.0) | 6 (20.7) | 1 (4.6) | ||
| ≥3 lines loss, n (%) | 5 (10.0) | 2 (4.0) | 0 (0) | 0 (0) |
Subgroup analysis was conducted to determine the impact of the pre-switch VA—separated into VA ≥20/40 (16 eyes) or ≤20/50 (34 eyes)—on the visual response to change in therapy ( Table 3 ). After 2 aflibercept injections had been administered, no significant difference in VA change was observed between both groups. Further analysis was then performed to determine the effect of macular ERM on the visual response after conversion ( Table 3 ). Similarly, no significant difference was noted in either baseline pre-switch VA or the visual outcomes after 2 injections based on presence (18 eyes, 36%) or absence (32 eyes, 64%) of concurrent ERM on SD OCT.
| ERM Pre-switch | Baseline VA Pre-switch | |||||
|---|---|---|---|---|---|---|
| No (n = 32) | Yes (n = 18) | P Value a | ≥20/40 (n = 16) | ≤20/50 (n = 34) | P Value a | |
| VA at Pre-switch Visit | ||||||
| Mean (SD) logMAR VA | 0.50 (0.49) | 0.62 (0.31) | .78 | 0.24 (0.06) | 0.77 (0.42) | <.0001 |
| VA change from pre-switch to first visit post-switch | ||||||
| Mean (SD) | 0.01 (0.22) | −0.06 (0.15) | .16 | −0.01 (0.12) | −0.02 (0.23) | .80 |
| ≥3 lines gain, n (%) | 2 (6.3) | 2 (11.1) | 0 (0.0) | 4 (11.8) | ||
| 2 lines gain, n (%) | 4 (12.5) | 2 (11.1) | 2 (12.5) | 4 (11.8) | ||
| 1 line gain, n (%) | 6 (18.8) | 3 (16.7) | 4 (25.0) | 5 (14.7) | ||
| <1 line change, n (%) | 11 (34.4) | 10 (55.6) | 5 (31.3) | 16 (47.1) | ||
| 1 line loss, n (%) | 3 (9.4) | 0 (0.0) | 3 (18.8) | 0 (0.0) | ||
| 2 lines loss, n (%) | 2 (6.3) | 0 (0.0) | 2 (12.5) | 0 (0.0) | ||
| ≥3 lines loss, n (%) | 4 (12.5) | 1 (5.6) | 0 (0.0) | 5 (14.7) | ||
| VA change from pre-switch to second visit post-switch | ||||||
| Mean (SD) | −0.04 (0.24) | −0.07 (0.17) | .58 | −0.03 (0.11) | −0.06 (0.25) | .47 |
| ≥3 lines gain, n (%) | 3 (9.4) | 3 (16.7) | 0 (0.0) | 6 (17.7) | ||
| 2 lines gain, n (%) | 2 (6.3) | 3 (16.7) | 2 (12.5) | 3 (8.8) | ||
| 1 line gain, n (%) | 12 (37.5) | 2 (11.1) | 4 (25.0) | 10 (29.4) | ||
| <1 line change, n (%) | 10 (31.3) | 6 (33.3) | 7 (43.8) | 9 (26.5) | ||
| 1 line loss, n (%) | 2 (6.3) | 3 (16.7) | 2 (12.5) | 3 (8.8) | ||
| 2 lines loss, n (%) | 2 (6.3) | 0 (0.0) | 1 (6.3) | 1 (2.9) | ||
| ≥3 lines loss, n (%) | 1 (3.1) | 1 (5.6) | 0 (0.0) | 2 (5.9) | ||
a For comparison of mean using paired t test for paired data for overall change from baseline or 2-group t test for comparison between 2 subgroups.
Anatomic Outcomes After Switching to Aflibercept
The average CMT from the pre-switch SD OCT scan was 459.2 ± 139.2 μm (median, 411; range, 382–549 μm). This significantly improved to 348.7 ± 107.8 μm (median, 351; range, 282–387 μm) by the second visit following conversion, reflecting a mean decrease of 112 ± 141 μm ( P < .0001). Central macular thickness measurements at consecutive visits are outlined in Table 4 and Figure 1 . At each subsequent visit after the initial conversion to aflibercept, a statistically significant improvement in CMT compared to the pre-switch value was measured. Altogether, 28 eyes (56%) demonstrated improvement of DME on SD OCT at their most recent follow-up, defined as both a reduction in CMT and decrease in retinal thickness, intraretinal cysts, and/or subretinal fluid as determined by the interpreters (E.R., A.S.); 12 eyes (24%) had complete resolution of fluid; while 10 eyes (20%) remained unchanged ( Figure 3 ). The number of eyes with vitreoretinal interface abnormalities (VMA, VMT, and ERM) remained stable during the course of therapy ( Table 4 ).
| 1 Visit Pre-switch | Pre-switch Visit | First Visit Post-switch | Secnd Visit Post-switch | Third Visit Post-switch | Fourth Visit Post-switch | |
|---|---|---|---|---|---|---|
| Eyes with data | 50 | 50 | 50 | 48 | 28 | 22 |
| CMT (μm) | ||||||
| Mean (SD) | 444 (131) | 459 (139) | 362 (118) | 349 (108) | ||
| Median (Q1, Q3) | 411 (382, 549) | 411 (382, 549) | 361 (296, 409) | 351 (282, 387) | ||
| Change from pre-switch visit | ||||||
| Mean (SD) | −95 (130) | −112 (141) | −117 (110) | −184 | ||
| P value | <.0001 | <.0001 | <.0001 | .0003 | ||
| ERM, n (%) | ||||||
| No | 32 (64.0) | 32 (64.0) | 32 (64.0) | 28 (58.3) | 18 (64.3) | 13 (59.1) |
| Yes | 18 (36.0) | 18 (36.0) | 18 (36.0) | 20 (41.7) | 10 (35.7) | 9 (40.9) |
| VMT, n (%) | ||||||
| VMA | 10 (20.0) | 10 (20.0) | 10 (20.0) | 4 (8.3) | 3 (1.1) | 3 (13.6) |
| VMT | 2 (4.0) | 2 (4.0) | 2 (4.0) | 4 (8.3) | 1 (0.4) | 1 (4.6) |
Stay updated, free articles. Join our Telegram channel

Full access? Get Clinical Tree


