Fig. 9.1
Computer-aided screening consists of subsequent building blocks: Initially, the anamnesis and image data of the entire screening collective is analyzed to preselect unsuspicious cases. The remaining set has to be manually assessed for further exclusion of unremarkable subjects. Only a small proportion of the initial set will be forwarded to clinical assessment to gain a final diagnosis and follow-up treatment if necessary
Computer–aided diagnostics (CAD) supports an ophthalmologist in the preparation of a medical diagnosis based on automatic data-mining methods. In particular, CAD is applicable in screening setups in order to reduce the number of normals for manual judgment, which helps to increase the efficiency of the reading centers (Fig. 9.1 step (2)). This is done by an upstream analysis of the personal data, e.g. images or anamnesis data, utilizing pattern recognition techniques that automatically perform a preselection of suspicious cases. Here, a computer-aided assessment augments the manual assessment provided by the reading center. As depicted in Fig. 9.1, this approach is considered as computer-aided screening (CAS). The proposed strategy can also be realized in a telemedical setup where image acquisition and examination are done spatially and temporally separated.
Scope
This contribution provides an overview on the recent advances in the development of pattern recognition techniques for automatic glaucoma detection. We will focus on fully automatic techniques applicable within a screening environment utilizing pure structural retinal fundus data published in 2008 or later.
Outline
The remainder of this chapter is organized as follows: After the introduction of common imaging modalities to document ONH morphology, we provide an excursus on pattern recognition. As major part of this work, two methodologies are presented that arise from current automatic glaucoma detection literature on structural retinal image data: (i) structure-driven and (ii) data-driven techniques. Finally, the methods are compared and evaluated toward the application in CAS.
9.2 Imaging Modalities
One main part in diagnosing glaucoma is the assessment of the ONH morphology. Besides the slit lamp that allows a live examination of the eye background, several digital imaging modalities got established. These devices allow the documentation of the ONH’s structure by acquiring 2-dimensional (2-D) or 3-dimensional (3-D) image data as shown in Fig. 9.2.
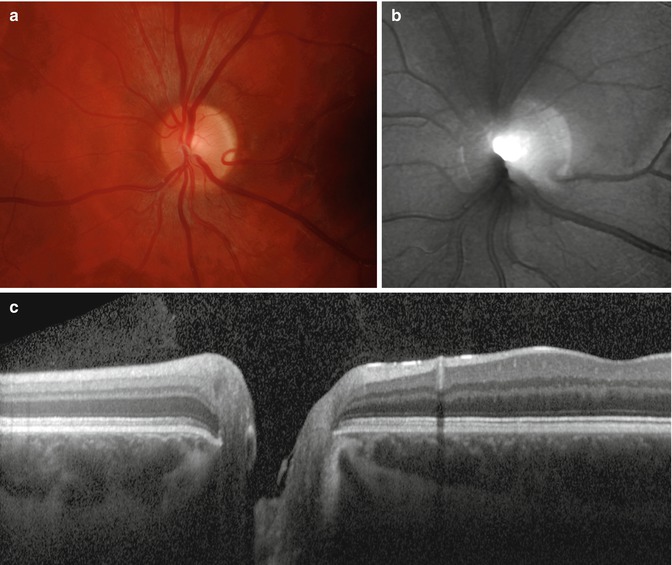
Fig. 9.2
Sample images capturing the optic nerve head (ONH) region: (a) high-resolution color fundus image, (b) topographic image acquired with Heidelberg retina tomograph (HRT), and (c) OCT line scan intersecting the ONH and depicting the different retinal layers including the retinal nerve fiber layer as the top one (Reprinted from [6] with permission from Elsevier)
Fundus imaging is one of the most commonly used technologies in ophthalmology to obtain high-resolution color photographs of the human retina [7, 8]. The fast image acquisition and relatively low costs of a digital fundus camera make this modality attractive to document the retina during screening. The acquired images can be analyzed to detect pathological degenerations caused, e.g., by glaucoma [9].
Confocal laser ophthalmoscope commercially available as Heidelberg retina tomograph (HRT) [10] acquires topographic and gray-scaled reflectance images of the ONH. In particular, the topographic images capturing the ONH’s shape allow the extraction of parameters to discriminate between normals and glaucomatous subjects [11].
Optical coherence tomography (OCT) [12] as the optical pendant to ultrasound enables the acquisition of depth profiles and even entire 3-D volumes of the retina. As the image data also records the retinal nerve fiber layer (RNFL), OCT data allows a detailed judgment of the retinal constitution and a reliable diagnosis of glaucoma. In addition, OCT data can be utilized for CAD applications as it was demonstrated by Huang and Chen [13] and Burgansky et al. [14]. As an alternative device for measuring the RNFL thickness, also scanning laser polarimetry (SLP) can be utilized.
From this retinal image data, pattern recognition techniques can extract glaucoma-related markers utilized during the computer-aided assessment within a screening scenario as shown in Fig. 9.1.
9.3 Excursus: Pattern Recognition Pipeline
The goal of pattern recognition is to analyze and classify patterns such as images or speech. For this purpose, pattern recognition systems are divided into multiple processing stages that are organized as a pipeline with similar underlying structure for different real-world problems [15]. In terms of glaucoma detection based on retinal image data, this pipeline is outlined in Fig. 9.3. Please also refer to Fig. 9.1 as the pattern recognition pipeline can be embedded within the automated glaucoma assessment step.
Fig. 9.3
Pattern recognition pipeline applied to automated glaucoma detection: Retinal image data is (i) acquired with an eye imaging modality such as fundus imaging or optical coherence tomography (OCT), (ii) preprocessed and analyzed as preparation for pattern recognition techniques, (iii) used to extract relevant features to detect traces of glaucoma, and (iv) used in a classification stage trained with manually classified image data. A common example workflow is visualized for glaucoma detection based on fundus photographs
Data Acquisition
In an initial data acquisition stage, sensor data such as images or speech is captured. Analog sensor data is commonly converted into a discrete mathematical representation for further processing by means of pattern recognition methods.
Example: For image-based glaucoma detection, the human eye is captured with an imaging modality. In a common clinical workflow, digital fundus cameras are employed to analyze the optic nerve for traces of glaucoma. As glaucoma detection relies on the quality of the acquired image, data acquisition also involves quality assessment for image data. In case of fundus imaging, several automatic and objective quality indices have been proposed to recognize images not usable for further processing [16–18].
Data Preprocessing and Analysis
Pattern recognition techniques require an appropriate preparation of the acquired data. Therefore, preprocessing steps are required to correct invalid or erroneous measurements present in the raw data. Different parts of the acquired signal that are relevant for a specific pattern recognition problem are extracted and analyzed. Then, these parts are used to measure certain parameters and to classify patterns in the underlying sensor data.
Example: Retinal image analysis [19] provides methods to process and analyze retinal image data in order to measure clinical parameters of the eye. In terms of fundus imaging, preprocessing for image enhancement includes illumination correction [20] to adjust uneven contrast and denoising techniques [21] to enhance the quality of noisy data. Preprocessing is also beneficial to remove features not related to glaucoma and to make the measurement of disease-specific parameters more reliable [22]. Common analysis steps include a segmentation of the ONH for glaucoma assessment [23–25].
Feature Extraction
Feature extraction reduces the complexity of the prepared data by modeling it with a finite set of features organized as a feature vector  . Each single feature x i is a mathematical description of a certain parameter or measurement. Features can be either continuous, e.g., geometric measurements such as lengths or diameters of anatomical structures, or discrete, e.g., the sex of a human subject. Additionally, dimensionality reduction may be used in an optional step to reduce the complexity of raw features x to obtain a compressed feature vector
  where d′ < d. Feature selection techniques learn the most meaningful features x′ in an automatic manner based on example data. Opposed to this approach, principal component analysis (PCA) is a common tool to perform dimensionality reduction in an unsupervised procedure.
. Each single feature x i is a mathematical description of a certain parameter or measurement. Features can be either continuous, e.g., geometric measurements such as lengths or diameters of anatomical structures, or discrete, e.g., the sex of a human subject. Additionally, dimensionality reduction may be used in an optional step to reduce the complexity of raw features x to obtain a compressed feature vector where d′ < d. Feature selection techniques learn the most meaningful features x′ in an automatic manner based on example data. Opposed to this approach, principal component analysis (PCA) is a common tool to perform dimensionality reduction in an unsupervised procedure.Example: Features that can be extracted from fundus images are geometric parameters of the ONH segmented in the previous stage of the pipeline. This includes the well-known cup-to-disk ratio (CDR) denoted as x 1 or the size of the optic disk denoted as x 2. The associated feature vector is given by x = (x 1, x 2)⊺.
Pattern Classification
Sensor data represented by a feature vector x is characterized by a class label  where
where 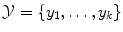 denotes a discrete set of k classes. However, the true class label is unknown and must be determined from the features. A classifier predicts a class label y* from the features x in an automatic manner. Therefore, the classifier is derived from a training set
  to learn the relationship between the features x i and the associated class y i . The set
  is composed from n training patterns x 1, …, x n , where the true class label y i for each x i is known and is used as gold standard. State-of-the-art classifiers commonly used in practical applications are support vector machines (SVM), random forests, artificial neural networks (ANN), or boosting methods such as AdaBoost [15].
where denotes a discrete set of k classes. However, the true class label is unknown and must be determined from the features. A classifier predicts a class label y* from the features x in an automatic manner. Therefore, the classifier is derived from a training set to learn the relationship between the features x i and the associated class y i . The set is composed from n training patterns x 1, …, x n , where the true class label y i for each x i is known and is used as gold standard. State-of-the-art classifiers commonly used in practical applications are support vector machines (SVM), random forests, artificial neural networks (ANN), or boosting methods such as AdaBoost [15].Example: In glaucoma detection, we are interested in the state of glaucoma, and the aim is to solve a two-class problem with y ∈ {N, G} whereas y = N for a normal subject and y = G for a subject suffering from glaucoma, respectively. Nayak et al. [9] proposed an ANN to discriminate between healthy normals and glaucomatous eyes based on features gained from fundus images. Therefore, the ANN is trained with patterns obtained from manually labeled fundus images provided by an ophthalmologist.
9.4 Glaucoma Detection by Means of Imaging
One trend in ophthalmology is the quantitative survey of the retinal fundus based on image data acquired in a noninvasive and in vivo way. These techniques utilize characteristics of the ONH as parameter and can be embedded within glaucoma screening programs [26]. As already depicted in Sect. 9.1, they can be automatically employed within a computer-aided assessment step to detect traces of glaucoma based on image data and to provide an initial exclusion of most likely normal cases.
Two major types of methodologies can be distinguished:
Structure–driven techniques commonly automate the extraction of established structural parameters of the ONH, e.g., the diameters of the optic disk and cup. These parameters are already known in the medical community and also statistically verified but are often determined manually.
Data–driven techniques utilize data-mining methods applied on the entire image to obtain discriminative markers for glaucoma detection. In contrast to structure-driven techniques, no direct relation between the ONH structure and the marker can be further obtained.
9.4.1 Structure-Driven Glaucoma Detection
In structure-driven glaucoma detection, disease-specific indicators of clinical significance are measured quantitatively. In general, glaucoma is characterized by a continuous, irreversible loss of ganglion cells [3]. This loss is the root cause for a set of structural ONH changes which can be captured by fundus imaging modalities as introduced in Sect. 9.2: (i) Thinning of the neuroretinal rim and (ii) a simultaneous extension of ONH cupping can be measured in fundus photographies and HRT images [27] as shown in Fig. 9.4 for an example fundus image [8]. (iii) The thinning of the retinal nerve fiber layer can be quantified, e.g., by OCT devices, and correlates with visual field defects due to glaucoma [28].
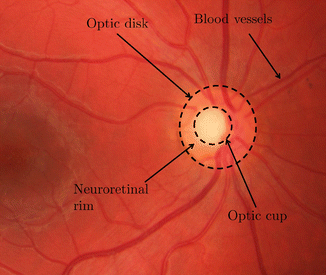
Fig. 9.4
Fundus image showing the optic nerve head (ONH): The optic cup is visible as bright spot inside the optic disk enclosed by the neuroretinal rim (Image data is taken from the high-resolution fundus (HRF) database
9.4.1.1 2-D Optic Nerve Head Analysis
A medically established feature accepted for glaucoma diagnosis is the cup–to–disk ratio (CDR) defined as:
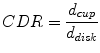
where d cup and d disk denote the vertical cup and disk diameter, respectively. With a thinned neuroretinal rim and an enlarged cup in case of glaucomatous eyes, a larger CDR indicates an increased risk of glaucoma.
(9.1)
Originally, the CDR was manually determined. An automated calculation is possible when utilizing recent image segmentation algorithms. A supervised procedure employs pixel classification to discriminate between disk, cup, and remaining background, e.g., based on superpixels [25]. Contrary, region-based methods rely on active contour models for disk segmentation and vessel-bend detection [23]. In case of stereo fundus imaging, the depth map obtained from a stereo image pair can be utilized to increase the reliability of the cup segmentation [29]. Once disk and cup are segmented, d cup and d disk are measured to determine the CDR according to Eq. (9.1).
The CDR may also be combined with further structural features such as the blood vessel areas in inferior, superior, nasal, and temporal (ISNT) quadrants or the distance between optic disk center and ONH as proposed by Nayak et al. [9]. The optic disk size should also be included to glaucoma classification as it highly correlates with CDR [30].
9.4.1.2 Topographic Optic Nerve Head Analysis
One inherent limitation of the CDR is that it ignores the underlying surface of the ONH as it is a 2-D feature only. HRT imaging enables the topographic analysis of the optic nerve which has been also investigated for glaucoma detection [11, 31].
In the approach of Swindale et al. [11], a surface model  estimated from ONH images defines the depth z as a function of the position (u, v) on the ONH. This model consists of two parts modeling the surface: (i) the parabolic retinal fundus and (ii) the ONH cup, which is parameterized by ten features. These encode meaningful structural features such as center, radius, slope, or depth of the optic cup as well as secondary parameters such as cup gradient measures derived from the model. They differ for healthy and glaucomatous subjects and are utilized for glaucoma detection. The resulting glaucoma probability score (GPS) is obtained by a Bayes classifier which allows to introduce an adapted loss functions [15] in order to penalize a misclassification of a glaucoma patient as a healthy one, usually referred to as false negative. This is useful in a screening scenario where unrecognized cases should be avoided.
estimated from ONH images defines the depth z as a function of the position (u, v) on the ONH. This model consists of two parts modeling the surface: (i) the parabolic retinal fundus and (ii) the ONH cup, which is parameterized by ten features. These encode meaningful structural features such as center, radius, slope, or depth of the optic cup as well as secondary parameters such as cup gradient measures derived from the model. They differ for healthy and glaucomatous subjects and are utilized for glaucoma detection. The resulting glaucoma probability score (GPS) is obtained by a Bayes classifier which allows to introduce an adapted loss functions [15] in order to penalize a misclassification of a glaucoma patient as a healthy one, usually referred to as false negative. This is useful in a screening scenario where unrecognized cases should be avoided.Twa et al. [32] modeled the ONH depth profile utilizing pseudo-Zernike radial polynomials. The parameters are then used as features within a decision tree classification. This method can be considered as a generalization of Swindale et al. [11] as a generic parametric function is used in comparison to a cup-specific parametric model.
9.4.1.3 Volumetric Retinal Nerve Fiber Layer Analysis
In addition to 2-D and topographic modalities, OCT imaging enables an in-depth analysis of the retinal layers. To enable a reliable determination of the RNFL, modality-specific image artifacts such as speckle noise [33–35] and motion artifacts [36] need to be compensated beforehand. Afterward, an automatic analysis of the RNFL by image processing and classification methods is promising for glaucoma detection [13, 14].
Stay updated, free articles. Join our Telegram channel

Full access? Get Clinical Tree


