Purpose
To investigate the progression rates of superior and inferior hemifield defects and each hemifield in bihemifield defects in normal-tension glaucoma patients and to compare the progression rates of each hemifield between groups in eyes with similar baseline hemifield defects.
Design
Retrospective, observational cohort study.
Methods
Medical records of 142 normal-tension glaucoma patients who performed more than 5 reliable standard visual field tests with superior (group 2; n = 51), inferior (group 1; n = 44), or both hemifield (group 3; n = 47) defects were analyzed retrospectively. The changes in the mean thresholds of the 10 zones of the glaucoma hemifield test and the entire hemifield were inspected. A linear mixed effect model was used with age, gender, initial intraocular pressure, mean deviation, and pattern standard deviation controlled.
Results
There were no significant differences in age and systemic and ocular factors between groups except for female gender, which showed a significant difference among the 3 groups ( P = .032). The progression rate in group 2 was significantly faster than in group 1 (−0.713 dB/year vs −0.516 dB/year; P = .019), especially in central and nasal zones or than in the superior hemifield of group 3 (−0.717 dB/year vs −0.470 dB/year; P = .001). There was no significant difference in the progression rates between group 1 and the inferior hemifield in group 3 (−0.508 dB/year vs −0.441 dB/year; P = .312) or between the superior and inferior hemifields in group 3 (−0.468 dB/year vs −0.442 dB/year; P = .662).
Conclusions
More careful examination and caution is required in the treatment of normal-tension glaucoma patients with superior hemifield defect.
Glaucoma is a progressive optic neuropathy characterized by damage to the retinal nerve fiber layer (RNFL) and the optic nerve head associated with corresponding visual field (VF) loss. Normal-tension glaucoma (NTG) has been recognized as causing predominantly localized damage in the optic nerve head and RNFL defects with VF loss that is steeper in slope, greater in depth, and close to the fixation. RNFL defects in NTG most frequently occur at the inferotemporal meridian followed by the supertemporal meridian. The VF defect often is observed in a more localized upper area with NTG, but generally in a more diffuse area with primary open-angle glaucoma.
Although patterns of VF injury vary in patients, glaucomatous field loss often begins with a localized injury that respects the horizontal meridian and subsequently spreads in an arcuate pattern consistent with the orientation of the retinal nerve fiber bundles. Mikelberg and Drance reviewed the pattern of VF progression using static and kinetic perimetry and found that 70% of eyes had initial damage limited to a single hemifield; at the completion of follow-up, 57% still had only single-hemifield involvement, whereas 13% had involvement of both hemifields. Boden and associates found that early glaucomatous field loss rarely crossed the horizontal midline.
The primary purpose of treatment of glaucoma is to maintain the patient’s quality of life and quality of vision. From the perspective of quality of life and quality of vision, the inferior VF is more susceptible to subjective symptoms and daily activities. To achieve a balance between treatment intensity and disease severity, several factors such as stage of glaucoma, life expectancy, and rate of progression should be considered. Therefore, it is important to recognize the progression rates of superior and inferior hemifield defects in the treatment of glaucoma.
De Moraes and associates compared progression rates in cases with damage to a single hemifield (either superior or inferior) and cases with damage to both hemifields in primary open-angle glaucoma, including pseudoexfoliative glaucoma. Fukuchi and associates compared progression rates in high-tension glaucoma and in NTG with respect to total, upper, and lower VF defects.
We are unaware of previous reports of this finding regarding the effect of the initial location of the VF defect corresponding to the initial location of the RNFL defect on the progression of NTG and found no reference to such a finding in a computerized search of PubMed. We evaluated eyes with similar baseline hemifield defects in the superior or inferior hemifield and also eyes with similar hemifield defects in both hemifields in NTG patients. We investigated the progression rate of each hemifield and compared the rates of progression of the disease in the superior, inferior, and both hemifield defect groups.
The Collaborative Normal Tension Glaucoma Study group reported that, although approximately half of cases showed confirmed localized VF deterioration by 7 years, the change typically is small and slow and often is insufficient to affect the mean deviation (MD) index measurably. Our study evaluated the progression rate directly from changes in the mean thresholds in 10 zones of the glaucoma hemifield test and the entire superior and inferior hemifields.
Methods
Inclusion Criteria
In a retrospective study involving the medical records of 219 patients who were diagnosed with NTG and had more than 5 VF tests at the Department of Ophthalmology, Samsung Medical Center, 142 subjects (142 eyes) were selected for the study based on the inclusion criteria described below. Patients who underwent more than 5 reliable VF tests with superior or inferior defects or both hemifield defects were included. Each patient was followed up regularly in the outpatient clinic and underwent a VF test at least once yearly. A diagnosis of NTG was made when a patient with an intraocular pressure (IOP) of 21 mm Hg or less without treatment had findings of glaucomatous optic disc damage and corresponding VF defects, an open angle observed by gonioscopic examination, and no underlying cause for optic disc damage aside from glaucoma. The central 30-2, Swedish Interactive Threshold Algorithm-standard strategy program of the Humphrey Field Analyzer (HFA model 640; Humphrey Instruments Inc, San Leandro, California, USA) was used for VF testing. A reliable VF test had to fulfill 3 criteria: fixation loss less than 20% and false-positive and false-negative rates of less than 15%. The definition of a glaucoma hemifield defect included the following: (1) 3 or more adjacent points with P < . 05 and at least 1 with P < . 01 or smaller on the pattern deviation probability map in a superior or inferior hemifield; (2) no point with P < . 01 or smaller on the pattern deviation probability map of the opposite hemifield; (3) a glaucoma hemifield test result that was outside of normal limits. If both eyes met the inclusion criteria, the eye with the smaller MD was chosen.
Exclusion Criteria
We excluded from the study patients with any of the following: (1) lens opacities more severe than C2, N2, or P2 according to lens opacities classification system III criteria ; (2) best-corrected visual acuity of less than 20/40; (3) spherical equivalent less than −6.0 diopters or more than 6.0 diopters; (4) initial MD of −20 dB or less for whom glaucoma progression would be difficult to evaluate from a VF test; (5) nonglaucomatous secondary causes affecting the VF (eg, diabetic retinopathy or other diseases of the optic nerve or retina); (6) other intraocular diseases or neurologic diseases affecting the VF (eg, pituitary lesions, demyelinating diseases, intracranial abnormalities); or (7) a history of laser treatment or intraocular surgery, except for uncomplicated cataract surgery.
Study Groups
The patients were divided into 3 groups. Group 1 consisted of patients showing superior RNFL defects with corresponding inferior hemifield defects, group 2 included patients showing inferior RNFL defects with corresponding superior hemifield defects, and group 3 comprised patients who showed both superior and inferior RNFL defects with corresponding bihemifield defects. RNFL defects identified by red-free photographs were confirmed by Stratus OCT (Carl Zeiss Meditec, Dublin, California, USA).
Treatment
When NTG was diagnosed, the patients received betaxolol (5 mg/mL; Alcon, Inc, Fort Worth, Texas, USA) twice daily. If glaucoma progressed, the target IOP was not reached during follow-up, or both, betaxolol was replaced by latanoprost (50 μg/mL; Pfizer Inc, New York, New York, USA). The first target of IOP reduction was to reduce basal IOP by 30%. If the first target IOP was not reached, 14 mm Hg was set as the second target IOP. If latanoprost did not have sufficient effect, brimonidine (2 mg/mL; Allergan Inc, Irvine, California, USA) usually was added. A Goldmann applanation tonometer was used for IOP measurement. The basal IOP was calculated as the mean IOP before the administration of a topical hypotensive agent at each hospital visit. The posttherapeutic IOP was calculated as the mean IOP after the administration of a topical hypotensive agent at each hospital visit.
Analysis of Visual Field
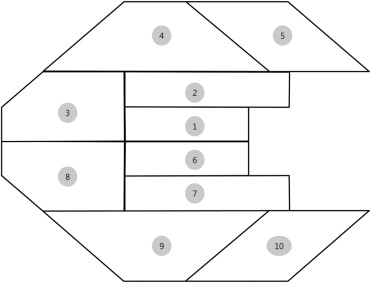
The mean thresholds of the 10 zones corresponding to those of the glaucoma hemifield test ( Figure 1 ), the central 10-degree zone, the peripheral zone other than the central 10-degree zone, the entire superior hemifield zone, and the entire inferior hemifield zone based on glaucoma change probability maps of total deviation (TD) were collected from each follow-up VF test for all 142 study subjects. All follow-up results of the VF tests were compared with an average of 2 baseline VF tests from the same eye. The change in mean threshold from the baseline mean threshold of each designated zone was used to calculate the progression rate.
Statistical Analysis
Follow-up period, age, refractive error, central corneal thickness, maximum untreated IOPs, posttherapeutic IOP, initial MD, and initial pattern standard deviation (PSD) were compared between groups 1 and 2, between groups 1 and 3, and between groups 2 and 3 using the independent t test or the Mann–Whitney U test. Gender ratio, family history of glaucoma, disc hemorrhage detection, the presence of β-zone peripapillary atrophy, and systemic factors were compared between groups using the chi-square test or Fisher exact test. Bonferroni correction was used for multiple comparisons. The above-listed factors were compared among the 3 groups using the analysis of variance (ANOVA) or the Kruskal-Wallis test. P < .05 was considered significant.
To calculate the progression rate, which is the slope of the mean thresholds of each zone, a linear mixed-effect model with unequal random-effect variances was used. The probability levels considered statistically significant were P < .005 for the slope of 10 zones, P < .0125 for the slope of the superior and inferior central and peripheral zones, and P < .025 for the slope of the entire superior and inferior hemifield zones. Only significant values were selected for the calculation of mean progression rates. Covariates such as age, gender, initial IOP, initial MD, initial PSD, and initial VF index were controlled. The progression rates of each zone between groups 1 and 2, between groups 1 and 3, and between groups 2 and 3 also were compared using the linear mixed-effect model. The probability levels considered statistically significant were P < .005 and 99.5% confidence interval for the 10 zones, P < .0125 and 98.75% confidence interval for the superior and inferior central and peripheral zones, and P < .025 and 97.5% confidence interval for the entire superior and inferior hemifield zones.
All statistical analyses were conducted using SAS software version 9.1.3 (SAS, Inc, Cary, North Carolina, USA) and SPSS software version 17.0 (SPSS, Inc, Chicago, Illinois, USA).
Results
Baseline Characteristics
Clinical characteristics
Of the 142 eligible patients who met the inclusion criteria, group 1 included 44 subjects (44 eyes), group 2 included 51 subjects (51 eyes), and group 3 included 47 subjects (47 eyes). The mean follow-up period was 8.19 ± 3.30 years for all subjects, 8.25 ± 3.13 years in group 1, 7.75 ± 3.34 years in group 2, and 8.38 ± 3.45 years in group 3. There was no significant difference in the length of the follow-up period among the 3 groups ( P = .606, ANOVA). The mean age at first visit was 50 ± 12 years for all subjects, 49.75 ± 12.58 in group 1, 50.94 ± 11.63 in group 2, and 49.74 ± 11.79 in group 3. There was no significant difference in initial age among the 3 groups ( P = .850, ANOVA). Female gender was characteristic of 47.18% (67/142) of all subjects, 34% (15/44) in group 1, 60% (31/51) in group 2, and 45% (21/47) in group 3. There was a statistically significant difference in female gender among the 3 groups ( P = .032, ANOVA), and the presence female gender in group 2 was significantly higher than in group 1 ( P = .027, chi-square test). There were no significant differences in family history of glaucoma; systemic factors such as diabetes mellitus, hypertension, migraine, orthostatic hypotension, or peripheral vascular disease; or ocular factors such as spherical equivalent, central corneal thickness, disc hemorrhage detection, presence of β-zone peripapillary atrophy, baseline IOP, or posttherapeutic IOP between groups 1 and 2, between groups 1 and 3, or between groups 2 and 3 (all P > .05, chi-square test, Fisher exact test, or independent t test with Bonferroni correction because of multiple testing) ( Table 1 ).
| Characteristics | Group 1: Inferior Hemifield Defect (n = 44) | Group 2: Superior Hemifield Defect (n = 51) | Group 3: Bihemifield Defect (n = 47) | P Value | ||
|---|---|---|---|---|---|---|
| Group 1 vs Group 2 | Group 1 vs Group 3 | Group 2 vs Group 3 | ||||
| Follow-up (year) | 8.25 ± 3.13 | 7.75 ± 3.34 | 8.38 ± 3.45 | .606 | ||
| Demographic factors | ||||||
| Age (year) | 49.75 ± 12.58 | 50.94 ± 11.63 | 49.74 ± 11.79 | >.999 a .850 b | >.999 a | >.999 a |
| Female gender (%) | 15 (34%) | 31 (60%) | 21 (45%) | .027 c | .906 c | .333 c |
| .032 d | ||||||
| Family history of glaucoma (%) | 5 (11%) | 4 (8%) | 2 (4%) | >.999 e | .771 e | >.999 e |
| Systemic factors (%) | ||||||
| Diabetes mellitus | 4 (9%) | 6 (12%) | 4 (8%) | >.999 e | >.999 e | >.999 e |
| Hypertension | 9 (20%) | 7 (14%) | 12 (26%) | >.999 c | >.999 c | .420 c |
| Migraine | 1 (2%) | 0 (0%) | 1 (2%) | >.999 e | >.999 e | >.999 e |
| Orthostatic hypotension | 1 (2%) | 0 (0%) | 0 (0%) | >.999 e | >.999 e | >.999 e |
| Peripheral vascular diseases | 2 (4%) | 2 (4%) | 0 (0%) | >.999 e | 0.693 e | >.999 e |
| Ocular factors | ||||||
| Spherical equivalent (D) | −1.89 ± 2.38 | −1.68 ± 2.29 | −2.35 ± 2.56 | >.999 a | >.999 a | .528 a |
| CCT (μm) | 529.18 ± 37.06 | 528.30 ± 42.07 | 523.41 ± 31.72 | >.999 a | >.999 a | >.999 a |
| Disc hemorrhage | 8 (18%) | 16 (31%) | 9 (19%) | .420 c | >.999 c | .498 c |
| β-zone PPA | 38 (86%) | 47 (92%) | 45 (96%) | >.999 e | .447 e | >.999 e |
| Baseline IOP | 17.16 ± 3.22 | 17.31 ± 3.15 | 17.26 ± 3.05 | >.999 a | >.999 a | >.999 a |
| Posttherapeutic IOP | 14.67 ± 2.26 | 15.17 ± 1.87 | 14.46 ± 1.82 | .708 a | >.999 a | .174 a |
e Fisher exact test, Bonferroni correction because of multiple testing.
Perimetric parameters
The mean number of VF tests was 8.24 ± 2.31 in total, 8.68 ± 2.36 in group 1, 8.20 ± 2.50 in group 2, and 7.87 ± 2.03 in group 3. There was no significant difference in the number of VF tests among the 3 groups ( P = .640, ANOVA). Initial MD was −3.89 ± 3.73 in group 1, −4.31 ± 3.47 in group 2, and −7.97 ± 4.62 in group 3. There was no significant difference in initial MD between groups 1 and 2 ( P = .570), but the initial MD was significantly higher in group 3 than in group 1 ( P < .001) or group 2 ( P < .001, independent t tests with Bonferroni correction because of multiple testing). Initial PSD was 7.34 ± 4.57 in group 1, 7.72 ± 4.33 in group 2, and 9.90 ± 4.08 in group 3. There was no significant difference in initial MD between groups 1 and 2 ( P = .681), but initial PSD was significantly higher in group 3 than in group 1 ( P < .001) or group 2 ( P < .001, independent t tests with Bonferroni correction because of multiple testing). The mean thresholds in each hemifield on total deviation plot were −6.87 ± 6.22 in the inferior hemifield in group 1, −7.45 ± 6.92 in the superior hemifield in group 2, −10.81 ± 7.52 in the superior hemifield of group 3, and −7.14 ± 5.12 in the inferior hemifield of group 3. There was no significant difference in initial mean threshold between the inferior hemifield of group 1 and the superior hemifield of group 2 ( P > .999). There was also no significant difference in initial mean threshold between the inferior hemifield of group 1 and the inferior hemifield of group 3 ( P > .999) or between the superior hemifield of group 2 and the superior hemifield of group 3 ( P = .072, independent t tests with Bonferroni correction because of multiple testing; Table 2 ).
| Perimetric Parameters | Group 1: Inferior Hemifield Defect (n = 44) | Group 2: Superior Hemifield Defect (n = 51) | Group 3: Bihemifield Defect (n = 47) | P Value | |||
|---|---|---|---|---|---|---|---|
| Group 1 vs Group 2 | Group 1 vs Group 3 | Group 2 vs Group 3 | Among 3 Groups | ||||
| No. of visual fields | 8.68 ± 2.36 | 8.20 ± 2.50 | 7.87 ± 2.03 | .640 a | |||
| MD (dB) | −3.89 ± 3.73 | −4.31 ± 3.47 | −7.97 ± 4.62 | .570 b | <.001 b | <.001 b | <.001 a |
| PSD (dB) | 7.34 ± 4.57 | 7.72 ± 4.33 | 9.90 ± 4.08 | .681 b | <.001 b | <.001 b | <.001 a |
| Mean threshold of superior hemifield on TD | −0.06 ± 0.92 | −7.45 ± 6.92 | −10.81 ± 7.52 | .072 b | |||
| Mean threshold of inferior hemifield on TD | −6.87 ± 6.22 | −0.36 ± 1.01 | −7.14 ± 5.12 | >.999 b | >.999 b | ||
a Among groups 1, 2, and 3: analysis of variance.
b Group 1 vs group 2 or group 1 vs group 3 or group 2 vs group 3: independent t test, Bonferroni correction because of multiple testing.
Progression Rates in Each Hemifield in Each Group
Progression rates of the inferior hemifield in group 1 versus the superior hemifield in group 2
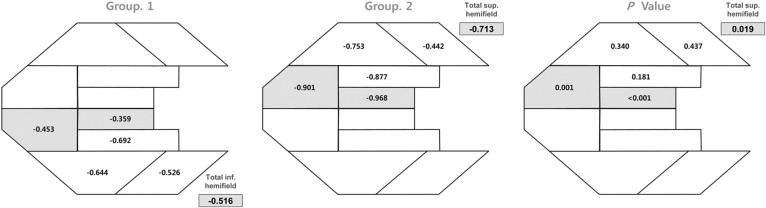
The progression rates were calculated as regression coefficients from the linear mixed-effect model. The regression coefficients of 10 zones of the glaucoma hemifield test and the entire hemifield from group 1 (inferior hemifield defect) and group 2 (superior hemifield defect) are shown in Figure 2 . The regression coefficients of other designated zones in groups 1 and 2 are as follows: the inferior central 10 degrees in group 1 and the superior central 10 degrees in group 2 were −0.160 dB/year and −0.911 dB/year, respectively; the inferior peripheral zone other than the central 10-degree zone in group 1 and the superior peripheral zone other than the central 10-degree zone in group 2 were −0.545 dB/year and −0.697 dB/year, respectively; and the entire inferior hemifield in group 1 and the entire superior hemifield in group 2 were −0.516 dB/year and −0.713 dB/year, respectively. There were no significant differences in the regression coefficients of zone 7 in group 1 and zone 2 in group 2, of zone 9 in group 1 and zone 4 in group 2, of zone 10 in group 1 and zone 5 in group 2, or of the inferior peripheral zone other than the central 10-degree zone in group 1 and the superior peripheral zone other than the central 10-degree zone in group 2 ( P = .181, P = .340, P = .437, and P = .085, respectively). However, there were significant differences in regression coefficient between zone 6 in group 1 and zone 1 in group 2, between zone 8 in group 1 and zone 3 in group 2, and between the inferior central 10 degrees in group 1 and the superior central 10 degrees in group 2 ( P < .001, P = .001, and P < .001, respectively). The progression rates of group 2 in these central and nasal zones were significantly faster than those in the corresponding zones of group 1. The progression rate of the entire superior hemifield in group 2 was significantly faster than that of the entire inferior hemifield in group 1 ( P = .019; Figure 2 ).
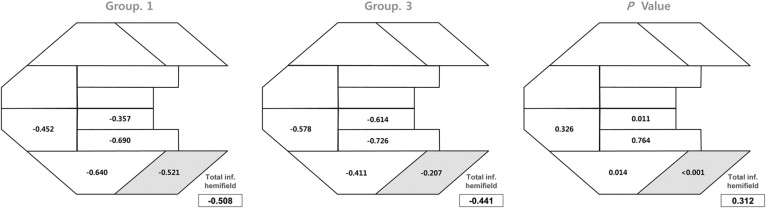
Progression rates of the inferior hemifield of group 1 versus the inferior hemifield of group 3
The regression coefficients of 10 zones of the glaucoma hemifield test and the entire hemifield from group 1 (inferior hemifield defect) and group 3 (bihemifield defect) are shown in Figure 3 . The regression coefficients of other designated zones in groups 1 and 3 are as follows: inferior central 10 degrees in groups 1 and 3, −0.157 dB/year and −0.434 dB/year, respectively; inferior peripheral zone other than the central 10-degree zone in groups 1 and 3, −0.537 dB/year and −0.442 dB/year, respectively; and the entire inferior hemifield in groups 1 and 3, −0.508 dB/year and −0.441 dB/year, respectively. There were no significant differences in the regression coefficients of group 1 and the inferior hemifield of group 3 in zones 6, 7, 8, 9, or the inferior peripheral zone other than the central 10-degree zone ( P = .011, P = .764, P = .326, P = .014, and P = .170, respectively). There were significant differences in the regression coefficients between group 1 and the inferior hemifield of group 3 for zone 10 and the inferior central 10-degree zone ( P < .001 and P = .005). However, for the entire inferior hemifield in group 1 and the entire inferior hemifield in group 3, there was no significant difference in progression rate ( P = .312; Figure 3 ).