Purpose
To compare the Ocular Surface Disease Index (OSDI) questionnaire and tear osmolarity, to screen ocular surface alterations in video display terminal (VDT) users.
Design
Cross-sectional study.
Methods
Sixty-four VDT workers were screened for ocular surface alterations using OSDI and tear osmolarity. Furthermore, tear film break-up time (TBUT), fluorescein corneal stain, and assessment for meibomian glands dysfunction (MGD) were carried out. The alteration of 2 or more among these parameters was considered a sign of ocular surface dysfunction. Data for the statistical analysis were obtained from the eyes with the worst tear osmolarity score. Main outcome measures were OSDI and tear osmolarity. For the statistical analysis the receiver operating characteristic (ROC) curves and Spearman correlation coefficient were used. A P < .05 was considered statistically significant.
Results
The area under the ROC curve (AUC) for tear osmolarity (ranging from 0.71 to 0.86) showed, for all the classification variables considered, statistically significantly higher values than those obtained with OSDI (ranging from 0.51 to 0.58) ( P < .01). Furthermore, tear osmolarity showed a direct correlation with corneal stain and ocular surface dysfunction and an inverse correlation for TBUT. No correlation was found between OSDI and the parameters considered.
Conclusions
Tear osmolarity can be considered a more reliable test than OSDI, when screening VDT users for possible ocular surface alterations.
Video display terminal (VDT) work is recognized as a high-risk factor for the onset of ocular discomfort symptoms. Several conditions were indicated as possible causes of eye symptoms, including environmental, ocular, and occupational factors: indoor air pollution, high room temperature, low relative room humidity, and lighting conditions were the most common environmental factors reported, while among the ocular factors were meibomian gland and other ocular surface dysfunctions, glare and poor contrast, accommodation, gaze position, and visual nervous system impairment. Furthermore, work stress, an inadequate work station (from an ergonomic point of view), and a reduced number of breaks during the work shift were also indicated as possible occupational causes of eyestrain.
Among the screening tools used in health surveillance programs for VDT workers, questionnaires are the most common; they are usually carried out by specialists in occupational medicine or by paramedical personnel and do not directly involve ophthalmologists. The Ocular Surface Disease Index (OSDI) was validated as one of the most valuable tests to detect dry eye in a population of VDT users; however, it was established that it can be biased by possible mistakes owing to misunderstanding of words, reflecting individual and regional differences in word choice, rather than different quality of responses. A consequence of this could be that some symptom questions could more likely result in lower scores than others (eg, pain vs tiredness).
Ocular discomfort was often related to increased tear osmolarity, a global indicator of ocular surface impairment and inflammation, regardless of its pathogenesis.
The aim of the present study is to compare the ability of the OSDI questionnaire and tear osmolarity test in bringing into evidence, for screening purpose, those subjects at risk to develop ocular surface dysfunction in a population of VDT users.
Material and Methods
Study Population
This observational, cross-sectional study was carried out on VDT operators working at screens for at least 20 hours a week. The Institutional Review Board of the Department of Experimental Medical-Surgical Sciences of the University of Messina, Messina, Italy, approved the protocol prospectively and the study was conducted in concordance with the tenets of the Declaration of Helsinki. Informed consent was obtained from all the participants after explanation of the nature and the possible consequences of the study.
The subjects involved worked in an environment characterized by air conditioning during the working hours. The study was carried out at the work place of the VDT operators, at the end of their work shift, by personnel of the Section of Occupational Health, Department of Social and Environmental Health, and of the Regional Referral Center for the Ocular Surface Diseases, Section of Ophthalmology of the Department of Experimental Medical-Surgical Sciences of the University of Messina, Messina, Italy.
Inclusion criteria were: living in the Messina metropolitan area, working at a VDT for at least 20 hours a week, willingness and ability to attend the required study visit, and lack of any systemic disease.
Exclusion criteria were as follows: presence of systemic or ocular disease, postmenopausal status, uncorrected refractive error, ocular hypertension, use of any ocular medication within 1 month before the beginning of the study, and any systemic treatment with drugs such as β-blocking agents, diuretics, benzodiazepines, hormones, antihistamines, and other drugs that could interfere with tear production.
Tests Performed
Ocular Surface Disease Index Questionnaire
The OSDI questionnaire, designed to assess dry eye disease severity (normal, mild to moderate, and severe), was administered to all the subjects included in the study by a specialist in occupational medicine, at the end of the work shift, immediately before the ophthalmologic examination. Twelve questions about the respondent’s past-week experience with ocular symptoms, vision-related functioning, and environmental triggers were asked. The details of the questions are reported in Table 1 . A score equal to or below 12 was considered normal.
| Domains | Questions |
|---|---|
| Ocular symptoms |
|
| Vision-related functions |
|
| Environmental triggers |
|
Ophthalmologic Examination
Ophthalmologic examination, carried out by an ophthalmologist, included ocular surface study, visual acuity assessment, tonometry, and fundus examination. The tests were performed at the end of the work shift, after at least 5 hours of work at a VDT.
For the ocular surface study, the following tests were performed: tear osmolarity test evaluated by TearLab (TearLab Osmolarity System, TearLab Corp, San Diego, California, USA), slit-lamp examination of the ocular surface to assess tear film break-up time (TBUT), corneal fluorescein staining, and meibomian gland assessment.
For the determination of tear osmolarity a sample of 50 nL was collected from the temporal part of the lower tear meniscus. Tear osmolarity was measured in milliosmoles per liter (mOsm/L). The measurement was carried out in both eyes and the higher value obtained was considered for statistical analysis. A cut-off value of 308 mOsm/L was considered to identify even mild cases of dry eye, as previously described.
TBUT was used to measure the stability of the tear film. A single drop of unit dose saline (Sodio Cloruro 0.9%; S.A.L.F. S.p.A. Laboratorio Farmacologico, Cenate Sotto [BG], Italy) was instilled onto a fluorescein-impregnated strip (Fluorescein paper; Haag Streit AG, Köniz, Switzerland) and then released in the conjunctival sac. Patients were asked to blink several times, to mix the fluorescein with the tear film, and then were asked to keep the eyes open, without blinking. The time elapsing between the last blink and the formation of small dry areas (which appear darker) on the corneal surface was obtained by computing the average of 3 determinations. A TBUT ≤ 5 seconds was considered altered.
The fluorescein staining, used to evaluate the epithelium of the cornea, was performed after the assessment of the TBUT. The corneal fluorescein stain was assessed 3 minutes after the instillation of fluorescein, observing the cornea through a cobalt blue light. Five corneal areas were considered. The area of corneal staining was evaluated with a score from 0 (absent) to 3 (widespread loss of epithelium); therefore, the total score for corneal staining ranged from 0 to 15. A score ≥3 was considered abnormal.
For the meibomian gland dysfunction (MGD) assessment, the score reported in Table 2 was used.
| Score | Definition |
|---|---|
| Grade 0 | No meibomian gland dropout and expressed meibum with clear appearance |
| Grade 1 | No meibomian gland dropout and mildly turbid meibum |
| Grade 2 | Anatomical abnormalities around the meibomian gland orifices (presence of 1 or more of the following is considered positive: (1) vascular engorgement; (2) anterior or posterior displacement of mucocutaneous junction; (3) irregularity of the lid margin; (4) turbid meibum) |
| Grade 3 | Meibomian gland dropout extending for less than half the inferior lid margin length or thick meibum with toothpaste appearance |
| Grade 4 | Gland dropout for more than half the lid margin or complete keratinization of the ducts and nonexpressible meibum |
According to the presence of at least 2 altered signs among TBUT, cornea fluorescein stain, and MGD, the subjects were divided as having an ocular surface dysfunction or not.
Statistical Analysis
A receiver operating characteristic (ROC) curve was used to study the accuracy of OSDI and tear osmolarity tests to detect possible ocular surface impairment, using as classification variables TBUT, corneal fluorescein test, MGD results, and presence of ocular surface dysfunction. A comparison between OSDI and tear osmolarity ROC curves was used for each classification variable. Also the sensitivity and specificity were reported. Furthermore, a Spearman correlation coefficient was calculated for both OSDI and tear osmolarity with the clinical tests performed.
A level of significance of α = 0.05 was fixed. The tests were performed in both eyes, and only the test results from the eye with the worst tear osmolarity value were used for statistical analysis.
MedCalc 12.2.1.0 (MedCalc Software, Ostend, Belgium) statistical software for Windows was used for statistical analysis.
Results
In the course of a routine health surveillance program carried out on VDT workers, 64 subjects of the 80 screened fulfilled the criteria for inclusion in the present study (25 male and 39 female, age range 41–63, mean age ± standard deviation 51.1 ± 7.6). From the cohort of 80 subjects, 16 were excluded for the following reasons: 8 subjects were using systemic treatment for blood hypertension, 6 were postmenopausal women, and 2 were diabetic.
Out of the 64 subjects included in the study, 32 (50%) had an OSDI score above 12, 37 (57.8%) had tear osmolarity above 308 mOsm/L, 56 (87.5%) showed a BUT < 6 seconds, 28 (43.7%) had a corneal score at slit-lamp examination equal to or above 3, and 24 (37.5%) had relevant clinical signs of MGD. Furthermore, 36 subjects (56.3%) had 2 altered tests out of 3 and were classified as having an ocular surface dysfunction ( Table 3 ).
| Whole Population (n = 64) | Mean ± SD | Normal Tests n (%) | Altered Tests n (%) |
|---|---|---|---|
| Age (y) | 51.1 ± 7.6 | – | – |
| OSDI (score) | 13.5 ± 9.4 | 32 (50) | 32 (50) |
| Tear osmolarity (mOsm/L) | 309.8 ± 23.8 | 27 (42.2) | 37 (57.8) |
| TBUT (seconds) | 3.6 ± 1.4 | 8 (12.5) | 56 (87.5) |
| Cornea (score) | 1.6 ± 1.7 | 28 (43.7) | 36 (56.3) |
| MGD (score) | 1.4 ± 0.8 | 40 (62.5) | 24 (37.5) |
| Ocular surface dysfunction | 28 (43.7) | 36 (56.3) |
The ROC curve analysis for OSDI and tear osmolarity was carried out using the following classification variables: TBUT, as a general indicator of tear film dysfunction; corneal score, as an indicator of ocular surface damage; MGD, as a condition that may result in alteration of the tear film, symptoms of eye irritation, clinically apparent inflammation, and ocular surface disease; presence of ocular surface dysfunction, intended as an altered response to at least 2 tests among those noted above.
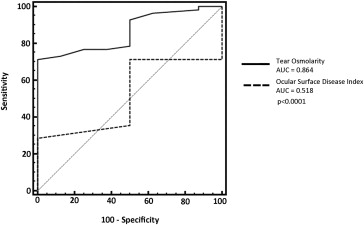
Considering the TBUT as classification variable, the ROC curve analysis demonstrated a statistically significant difference between the area under the ROC curves (AUC) of OSDI (0.518; 95% confidence interval [CI] 0.385–0.645) and tear osmolarity (0.864; 95% CI 0.755–0.937) ( P < .0001) ( Figure 1 ).
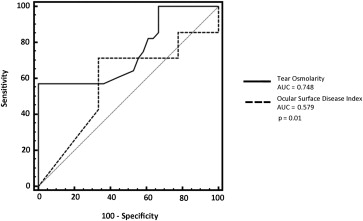
With the corneal score as classification variable, the AUC for OSDI was 0.579 (95% CI 0.449–0.702) and for tear osmolarity was 0.748 (95% CI 0.624–0.848) ( P = .01) ( Figure 2 ).
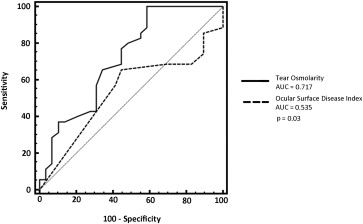
Using the MGD as classification variable, the ROC curve analysis demonstrated a statistically significant difference between the AUC of OSDI (0.535; 95% CI 0.391–0.680) and tear osmolarity (0.717; 95% CI 0.588–0.847) ( P = .03) ( Figure 3 ).
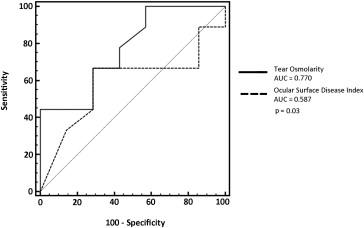
Also, using the presence of ocular surface dysfunction as classification variable, there was a statically significant difference between the AUC of OSDI (0.587; 95% CI 0.457–0.709) and tear osmolarity (0.770; 95% CI 0.648–0.866) ( P = .03) ( Figure 4 ).
Stay updated, free articles. Join our Telegram channel

Full access? Get Clinical Tree


