Purpose
To compare the accuracy of the Hoffer Q and Haigis formulae according to the anterior chamber depth (ACD) in cases of short axial length (AL).
Design
Retrospective cross-sectional study.
Methods
A total of 75 eyes from 75 patients with an AL of less than 22.0 mm implanted with an Acrysof IQ intraocular lens (IOL) were enrolled. The median absolute errors (MedAEs) predicted by the Hoffer Q and Haigis formulae were compared. The correlations between ACD and the predicted refractive error calculated using the 2 formulae were analyzed.
Results
There were no significant differences in the MedAEs predicted by the Hoffer Q and Haigis formulae (0.40 and 0.40 diopter [D], respectively). The difference between the refractive errors predicted by the Hoffer Q and Haigis formulae increased significantly as the ACD decreased ( R 2 = 0.644, P < .001). The MedAE predicted by the Haigis formula (0.40 D) was significantly smaller than that predicted by the Hoffer Q formula (0.66 D) in eyes with an ACD of less than 2.40 mm ( P = .027). There were no significant differences found between the MedAEs predicted by the Hoffer Q and Haigis formulae in eyes with an ACD of 2.40 mm or more.
Conclusions
The differences between the predicted refractive errors of the Hoffer Q and Haigis formula increased as ACD decreased in short eyes. Therefore, ACD should be taken into consideration when evaluating the accuracy of the IOL power calculation formulae in short eyes.
Intraocular lens (IOL) power calculation is important for attaining optimal refractive outcomes in cataract surgery. IOL power is calculated using preoperatively measured corneal power (K), axial length (AL), and an estimation of postoperative effective lens position. Modern IOL power calculation formulae show similarly accurate refractive outcomes in eyes with an average AL. However, the accuracy of these formulae is different in eyes with long and short ALs, and thus refractive outcomes become more inaccurate in eyes with long or short ALs than in eyes with average ALs.
Errors in effective lens position estimation account for the majority of errors in IOL power calculations by optical biometry using the IOLMaster (Carl Zeiss Meditec, Jena, Germany). Olsen showed that the predicted refractive error produced by an error in effective lens position prediction is strongly dependent on AL and has a greater effect in eyes with a short AL than in eyes with a long AL.
Previous studies on IOL power calculations have demonstrated that the Hoffer Q formula is best for eyes with a short AL. However, none of these studies directly compared the Hoffer Q and Haigis formulae. Another study, which compared Hoffer Q and Haigis formulae directly, showed that the Haigis formula had the lowest predicted refractive error in eyes with short ALs. The Hoffer Q formula relies on personalized anterior chamber depth (ACD), AL, and K for the estimation of postoperative effective lens position. However, in the Haigis formula, effective lens position is calculated using measurements of ACD and AL. Thus, the accuracy of the Hoffer Q and Haigis formulae in eyes with short ALs may differ according to the ACD, even in eyes with the same K and AL. The aim of this study was to compare the accuracy of the Hoffer Q and Haigis formulae using the IOLMaster and to evaluate the effects of ACD on the accuracy of IOL calculations in eyes with short ALs.
Subjects and Methods
Study Population
This retrospective cross-sectional study included 75 eyes from 75 patients who underwent uncomplicated phacoemulsification with Acrysof IQ IOL (Alcon Laboratories Inc., Fort Worth, Texas, USA) implantation at our institute between April 1, 2008 and September 30, 2013. Eyes with AL measurements of less than 22.0 mm, as determined by the IOLMaster, and with at least 3 valid measurements with a signal-to-noise ratio (SNR) above 1.5 for a single measurement and an SNR above 2.0 for the composite signal were included. Patients with best-corrected visual acuities (BCVA) less than 20/40 after cataract surgery, history of traumatic cataracts, previous ocular surgery (eg, penetrating keratoplasty or refractive surgery), previous complicated cataract surgery (eg, anterior or posterior capsular ruptures), sulcus-fixated lenses, or postoperative complications (eg, decentered or tilted IOL) were excluded. Institutional Review Board approval was obtained from the Korea University Anam Hospital and Korea University Guro Hospital, Seoul, South Korea, for this study. All research and data collection adhered to the tenets of the Declaration of Helsinki.
Patient Examination
Preoperative K, AL, and ACD were measured using an IOLMaster (version 5.02 or higher). IOL power was calculated using the Hoffer Q and Haigis formulae. The pseudophakic ACD (pACD) was 5.64 for the Hoffer Q formula and the a0, a1, and a2 constants were -0.767, 0.220, and 0.219, respectively, for the Haigis formula. Postoperative uncorrected visual acuity (UCVA), BCVA, and objective refractive error, measured with an autorefractor/keratometer (RK-F1; Canon, Tokyo, Japan), were measured at postoperative visits between 3 and 10 weeks.
Surgical Technique
All phacoemulsification and IOL implantations were performed by 1 of 3 experienced surgeons (J.S.S, Y.Y.K., and H.M.K.) at 1 of the 2 hospitals in our institute. After topical anesthesia with proparacaine hydrochloride 0.5% (Alcaine; Alcon Laboratories Inc) a 2.2-2.75 mm temporal clear corneal incision was made and a continuous curvilinear capsulorrhexis slightly smaller than the IOL optic size was created with a 26 gauge needle. A standard phacoemulsification technique was used and the IOL was inserted into the capsular bag using an injector system.
Main Outcome Measures
The median absolute error (MedAE) was defined as the median absolute value of the predicted refractive error. The predicted refractive error was defined as the difference between the objective refractive spherical equivalent when measured between 3 and 10 weeks postoperatively and the preoperative refraction predicted by the IOLMaster using the Hoffer Q and Haigis formulae (predicted refractive error = postoperative spherical equivalent – preoperative predicted refraction). The data-adjusted pACD for the Hoffer Q formula was calculated using the Haigis constant optimization Excel spreadsheet (Microsoft Inc, Redmond, Washington, USA) for optical biometry, which also optimizes a lens constant for the Hoffer Q formula.
Investigation of the Differences in the Predicted Refraction Between the Hoffer Q and Haigis Formulae
Differences in the predicted refraction between the Hoffer Q and Haigis formulae were defined by subtracting the predicted refraction of the Hoffer Q formula from that of the Haigis formula. To calculate the predicted refraction of the Hoffer Q and Haigis formulae, values of AL (22.0 mm and 24.0 mm), K (range, 42-49 diopters [D]), and ACD (range, 2.00-4.00 mm) were entered into the IOLMaster. IOL power was selected based on the predicted refraction of the Hoffer Q formula between -0.5 and 0 D. The predicted refraction of the Haigis formula, which is based on ACD, was obtained using the same IOL power as the Hoffer Q formula.
Statistical Analysis
Statistical analyses included the Wilcoxon signed rank test, linear regression analysis, and multiple linear regression analysis, performed with the Statistical Package for the Social Sciences version 12.0 (SPSS Inc, Chicago, Illinois, USA). Results were considered statistically significant if the P value was < .05.
Results
The mean patient age was 70.1 ± 6.8 years (range, 52-85 years). The mean K was 46.34 ± 1.28 D (range, 43.67-49.46 D), the mean ACD was 2.63 ± 0.39 mm (range, 1.87-3.51 mm), and the mean AL was 21.69 ± 0.29 mm (range, 20.32-21.99 mm). Patient sex, laterality, and calculated IOL power are given in Table 1 .
| Parameter | Mean (SD) a | Range |
|---|---|---|
| Age, y | 70.1 (6.8) | 52-85 |
| Sex, n (%) | ||
| Male | 5 (6.7) | – |
| Female | 70 (93.3) | – |
| Laterality, n (%) | ||
| Right eye | 39 (52.0) | – |
| Left eye | 36 (48.0) | – |
| Corneal power, D | 46.34 (1.28) | 43.67-49.46 |
| Anterior chamber depth, mm | 2.63 (0.39) | 1.87-3.51 |
| Axial length, mm | 21.69 (0.29) | 20.32-21.99 |
| IOL power, D | 24.8 (1.6) | 20.5-28.0 |
The Wilcoxon signed rank test revealed that there was no significant difference between the MedAEs predicted by the Hoffer Q (0.40 D) and Haigis formulae (0.40 D). The percentages of eyes that achieved a postoperative predicted refractive error within ±0.25, ±0.50, and ±1.00 D from the preoperative predicted refraction were, respectively, 29.3%, 62.7%, and 88.0% for the Hoffer Q formula, and 37.3%, 66.7%, and 88.0% for the Haigis formula ( Table 2 ).
| Formula | Hoffer Q | Haigis | P Value |
|---|---|---|---|
| MedAE, D | 0.40 | 0.40 | .413 |
| MAE, D | 0.49 | 0.46 | |
| RE, D (range) | −0.23 (−1.65∼0.97) | 0.20 (−1.09∼1.54) | |
| ±0.25 D (%) | 29.3 | 37.3 | |
| ±0.50 D (%) | 62.7 | 66.7 | |
| ±1.00 D (%) | 88.0 | 88.0 | |
| >±2.00 D (%) | 0.0 | 0.0 |
Refractive errors predicted by the Hoffer Q formula showed a significant positive correlation with the ACD ( R 2 = 0.156, P < .001; Figure 1 ); however, the predicted refractive error was not correlated with the K or AL. In the Hoffer Q formula, the refractive outcome was myopic when the ACD was shallower than 3.01 mm and hyperopic when the ACD was deeper than 3.01 mm. However, the predicted refractive errors determined with the Haigis formula only showed a correlation with K ( R 2 = 0.084, P = .012; Figure 1 ) and not ACD or AL. Differences between refractive errors predicted by the Hoffer Q and Haigis formulae showed a significant positive correlation with the ACD ( R 2 = 0.644, P < .001; Figure 2 ). However, no correlation was observed between K and differences between refractive errors predicted by the Hoffer Q and Haigis formulae.
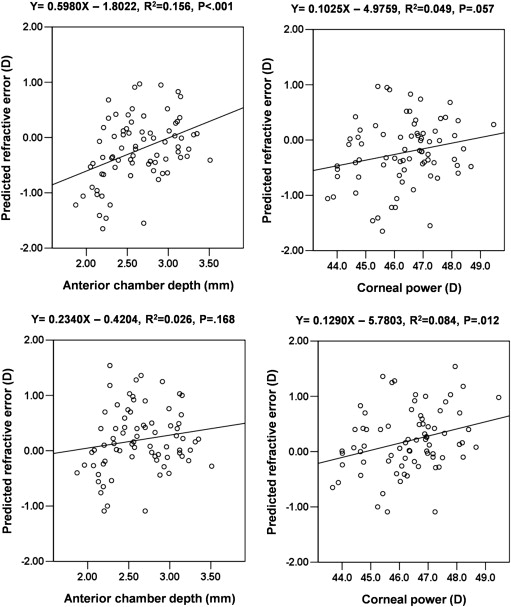
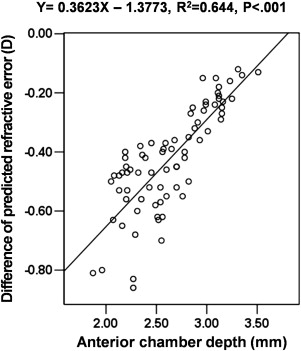
Table 3 shows the MedAEs and predicted refractive errors of subgroups according to ACD values (2.40 and 2.90 mm) determined by the Hoffer Q and Haigis formulae. The MedAE predicted by the Haigis formula (0.40 D) was significantly smaller than that predicted by the Hoffer Q formula (0.66 D) in eyes with an ACD of less than 2.40 mm ( P = .027). There were, however, no significant differences found between the MedAEs predicted by the Hoffer Q and Haigis formulae in eyes with an ACD of 2.40 mm or more.
| Hoffer Q | Haigis | P Value | |
|---|---|---|---|
| ACD < 2.40 mm (n = 25) | |||
| MedAE, D | 0.66 | 0.40 | .027 |
| MAE, D | 0.72 | 0.48 | |
| RE, D (range) | −0.59 (−1.65∼0.68) | −0.04 (−1.09∼0.154) | |
| ±0.25 D (%) | 12.0 | 36.0 | |
| ±0.50 D (%) | 40.0 | 60.0 | |
| ±1.00 D (%) | 68.0 | 88.0 | |
| >±2.00 D (%) | 0.0 | 0.0 | |
| 2.40 mm ≤ ACD < 2.90 mm (n = 28) | |||
| MedAE, D | 0.36 | 0.42 | .151 |
| MAE, D | 0.40 | 0.50 | |
| RE, D (range) | −0.11 (−1.55∼0.97) | 0.36 (−1.09∼1.36) | |
| ±0.25 D (%) | 39.3 | 32.1 | |
| ±0.50 D (%) | 75.0 | 64.3 | |
| ±1.00 D (%) | 96.4 | 85.7 | |
| >±2.00 D (%) | 0.0 | 0.0 | |
| 2.90 mm ≤ ACD (n = 22) | |||
| MedAE, D | 0.32 | 0.28 | .537 |
| MAE, D | 0.35 | 0.38 | |
| RE, D (range) | 0.03 (−0.65∼0.95) | 0.25 (−0.41∼1.25) | |
| ±0.25 D (%) | 36.4 | 45.5 | |
| ±0.50 D (%) | 72.7 | 77.3 | |
| ±1.00 D (%) | 100.0 | 90.9 | |
| >±2.00 D (%) | 0.0 | 0.0 |
The data-adjusted pACD for the Hoffer Q formula was calculated as 5.55. When the optimized predicted refraction of the Hoffer Q formula was used, there was no significant improvement of the MedAE among the study subjects. However, the MedAE significantly decreased from 0.66 D to 0.51 D in eyes with an ACD less than 2.40 mm ( P = .012). When subjects were divided into 3 subgroups based on ACDs of 2.40 and 2.90 mm, the corresponding pACDs for the Hoffer Q formula were calculated as 5.39, 5.60, and 5.67. The MedAE significantly decreased further from 0.51 D to 0.49 D ( P = .030) in eyes with an ACD less than 2.40 mm when different pACDs based on ACD were applied ( Table 4 ).
Stay updated, free articles. Join our Telegram channel

Full access? Get Clinical Tree


