Purpose
To compare the accuracy and speed of using the computerized MatchedFlicker software program (EyeIC Inc, Narberth, Pennsylvania, USA) to evaluate glaucomatous optic disc change against the traditional gold standard of manually examining stereoscopic disc photographs.
Design
A prospective evaluation of diagnostic technology.
Methods
Two resident ophthalmologists and 1 glaucoma fellow at the University of Florida independently evaluated 140 image pairs from 100 glaucomatous/ocular hypertensive patient eyes using a handheld stereo viewer and the MatchedFlicker program. Fifty had progression to glaucoma as determined by the Ocular Hypertension Treatment Study (OHTS) Optic Disc Reading Group and the OHTS Endpoint Committee in the OHTS, and 50 more had photographs taken a few minutes apart, which were negative controls with no progression. Twenty photograph pairs from each group were duplicated to determine reviewer variability. Photographs were examined in alternating blocks of 70 photograph pairs for each method, with the starting viewing method randomized. Reviewer accuracy and time to review for each method were measured.
Results
Using the handheld stereo viewer, the reviewers correctly identified progression or nonprogression in 76.0% of the slide pairs. Using the MatchedFlicker software, 87.6% were correctly identified ( P = .011). Evaluator speed averaged 34.1 seconds per image pair with the stereo viewer vs 24.9 seconds with the MatchedFlicker program ( P = .044). Overall, Flicker was significantly more specific but less sensitive than stereo slides. Trainees appeared more reluctant to identify glaucoma progression from slides than from Flicker. For the 2 less experienced trainees Flicker was significantly more accurate.
Conclusion
The MatchedFlicker software had a greater accuracy and was quicker to perform than using a handheld stereoscopic viewer.
It is estimated that in the United States more than 2 million people currently suffer from open-angle glaucoma (OAG). Monitoring for glaucoma progression includes visual field and retinal nerve fiber analysis and careful examination of the optic nerve. All 3 methods have limitations, with quality of image scan or photograph being the primary problem with retinal nerve fiber layer (RNFL) optical coherence tomography (OCT) and disc evaluation, respectively, and subjective factors related to patient alertness, their learning curve for the field testing, technician experience, and small variations in head positioning also playing a role in visual field evaluation.
Accurate disc evaluation for focal rim defects, disc hemorrhages, optic nerve size, and nerve fiber layer abnormalities is important for identification of glaucomatous progression. Photo documentation of the optic nerve head using stereo photographs has been a traditional method for ophthalmologists to monitor glaucomatous progression because of its superiority to written subjective documentation and drawings. Large randomized National Eye Institute (NEI) trials have employed optic disc stereo photograph analysis using a disc reading center as one of the primary methods to detect glaucoma progression.
Evidence suggests that structural damage can often be detected before the development of detectable visual field defects. In ocular hypertensive patients that were considered normal at baseline for automated visual field and disc morphology, Kass and associates in the Ocular Hypertension Treatment Study (OHTS) (full study group listed in the Appendix ; Supplemental Material available at AJO.com ) found that of 55% of eyes with primary open-angle glaucoma (POAG) endpoints were initially identified on stereo photographs alone, 35% by visual field changes, and 10% based on concurrent visual fields and stereo photograph changes.
It is unclear why disc evaluation through examination of sequential simultaneous stereo photographs is not done routinely in clinical practice. Possible explanations include the need for a special simultaneous-stereoscopic camera and stereo viewer (although it is possible to obtain less standardized stereoscopic photographs with a nonsimultaneous camera), and the difficulty and time-consuming nature of the stereo photograph evaluation. With the increased use of electronic medical records (EMR), it is important to have a disc imaging technique that is accurate at detecting glaucoma progression and is also well adapted to the new electronic format.
This study was designed to compare the accuracy and speed of the new MatchedFlicker (EyeIC Inc, Narberth, Pennsylvania, USA), technique using a computer screen with the traditional gold-standard method of examining slides of stereoscopic disc photographs in a group of nonexpert observers who were in various stages of ophthalmology training.
Methods
All research in this experimental study was performed in accordance with the University of Florida’s Institutional Review Board (IRB) with protocol approval prior to initiation of the study. Approval was given for the collection of optic nerve photographs from patient records and from the Bascom Palmer Eye Institute Optic Disc Reading Center, as well as for the participation of the photograph evaluators. A full waiver of informed consent was obtained for the use of de-identified patient optic nerve photographs, because no risk was posed to any patient with their use. This study adhered to the tenets of the Declaration of Helsinki and all federal and state laws.
From February to May of 2013, 2 ophthalmology residents (postgraduate year [PGY]-2 and PGY-3) and 1 glaucoma fellow (PGY-5) at the University of Florida independently evaluated stereoscopic pairs of disc photographs of 100 eyes taken at 2 time points. Fifty eyes were identified from patients in the OHTS study that showed glaucoma progression. This progression was previously determined by the OHTS Optic Disc Reading Group of the Bascom Palmer Eye Institute and confirmed as glaucomatous change by the OHTS Endpoint Committee. The patient’s comparison photographs were taken between 1 and 5 years apart, depending on when the disc progression was first noted by the study committee. Another group of 50 eyes were obtained that were known to show no progression since the photographs were taken at the University of Florida using a Topcon TRC-50DX simultaneous stereo camera system (Topcon, Oakland, New Jersey, USA) just a few minutes apart. Duplicate photographs of 20 of the 50 eyes that showed progression and 20 of the 50 eyes with no progression were randomly selected to allow for assessment of intra- and interobserver variability in detecting progression. Thus, a total of 140 image pairs (280 photographs) were examined by each observer.
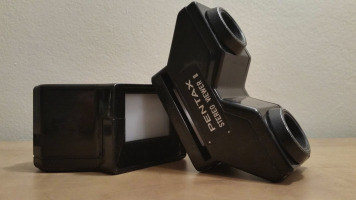
Two different examination methods were used by each observer for judging the optic disc photographs for glaucomatous progression: handheld stereo viewers and the computerized MatchedFlicker program (identified further in the study as “Flicker”). Using 2 Pentax handheld stereo viewers (Pentax, Tokyo, Japan) ( Figure 1 ), 35 mm simultaneous-stereoscopic color slides of optic disc photographs were reviewed with the slide from the first time point in one stereo viewer and the slide from the second time point in the other stereo viewer. No poor-quality photographs were used, but photographs were of naturally slightly varying quality to reflect what a practitioner would encounter in real-world clinical practice.
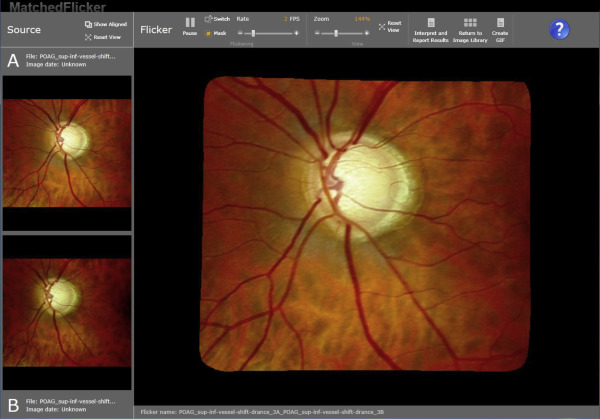
The evaluators reviewed the same sets of photographs using the Flicker software. For this computerized analysis, stereoscopic images are not required. The right image of the stereo pair from each of the 35 mm stereo photographs was digitized using a Nikon Super Coolscan 5000 (Nikon, Tokyo, Japan) and uploaded into the Flicker alignment and presentation software. In 4 eyes the right image was blurred and the left image of the stereo pair was selected instead. The right image at the second time point was also digitized and uploaded into the Flicker software. The Flicker program took these 2 digitized images, registered that they were photographs of the same eye taken at 2 time points, and aligned the object (the optic disc) in the 2 images so that they were superimposed ( Figure 2 ). The program then “flickered” rapidly between the 2 images, which simulated a sensation of movement if any structural alterations had occurred. In this way, any features that underwent a potentially glaucomatous structural change between the photographs would be detected as movement. A 16 inch Samsung Galaxy laptop (Suwon, Korea) computer screen was used for the Flicker presentations.
Using the 2 different methodologies, the evaluators assessed the optic nerve head (ONH) images for evidence of progression including disc rim thinning (focal or diffuse), vessel movement related to increased cupping, or detection of new or enlarged RNFL defects.
Prior to examining the study photographs, each evaluator was given a practice session with 10 additional photograph pairs to familiarize them with each technique. For 2 of the examiners this practice with the Flicker technique was their only exposure to the program, as they had not used it previously. All 3 had some experience reviewing disc stereo photographs with a handheld stereo viewer.
The method of examining the disc pairs was divided into 2 alternate blocks of 70 paired images, using 1 method for the entirety of that block. The method that was used first was randomized. All 280 images were reviewed separately by each of the 3 observers in a single session. A forced decision on progression or nonprogression was required for each image, even if the observer was not certain. A study coordinator recorded the evaluator’s assessment of disc progression for each photograph and recorded the time taken for the overall disc determination using each method. The time taken for each evaluator to complete the set of photographs using the 2 different techniques was divided by the number of photograph pairs viewed to give a mean “time-per-assessment” measurement.
Statistical Analysis
The difference in accuracy between the Flicker and slides method was initially analyzed with a 2-sided paired t test comparing each reviewer’s percent accuracy for both the Flicker and slides method. A more precise analysis, in which the image pairs were scored for both Flicker and slides and the paired differences in score compared, is shown in Supplemental Table 1 (Supplemental Material at AJO.com ). Each subject slide or image was scored 100% (3 of 3 reviewers correct), 66.7% (2 of 3 correct), 33.3% (1 of 3 correct), or 0% (0 of 3 correct) and the P value assessed by a 2-sided paired t test for all 100 image pairs.
The difference in the average evaluation time per assessment between the 2 methods was also analyzed with a 2-sided paired t test comparing the total time of each reviewer divided by all 140 slides in the block for each method.
Information on each reviewer’s sensitivity, specificity, and overall accuracy was compared between the 2 methods using the following logistic regression model:
logit [ Pr ( yijk = 1 ) ] = Log [ odds ( yijk = 1 : yijk = 0 ) ] = α0 + αtrt I ( i = 1 ) + α 1 I ( k = 2 ) + α 2 I ( k = 3 )
Stay updated, free articles. Join our Telegram channel

Full access? Get Clinical Tree


