Purpose
To describe microvascular abnormalities and capillary density in macular telangiectasia type 1 (MT1) using optical coherence tomography angiography (OCTA), and correlate them with fluorescein angiography (FA).
Design
Observational case series.
Methods
Seven patients with MT1 and 12 age-matched controls were included. Focal microvascular dilations were identified on 3 × 3 mm OCTA and early-frame FA images. OCTA images were processed to determine the global capillary density after subtraction of larger vessels and cystoid edema cavities. Local capillary densities were calculated inside 100-μm circles around telangiectasias, projected over superficial (SCP) and deep capillary plexuses (DCP). They were compared to a random sample of 100-μm circles generated in each OCTA image. FA images were processed to measure mean perifoveal intercapillary areas (PIA), inversely reflecting capillary density.
Results
In MT1 eyes, fewer telangiectasias were identified with OCTA than with FA ( P = .016), exclusively localized in the DCP ( P = .016). Rarefaction of both capillary plexus and abnormal microvascular morphology were better identified by OCTA than by FA. The global capillary density on OCTA was significantly lower in MT1 eyes than in fellow and control eyes, respectively: SCP, 0.347 vs 0.513 ( P = .004) and 0.560 ( P = .0005); DCP, 0.357 vs 0.682 ( P = .016) and 0.672 ( P = .0005). Capillary density was significantly reduced around telangiectasias in both SCP ( P = .021) and DCP ( P = .042). Capillary density of the SCP correlated inversely with the mean PIA on FA ( r = −0.94, P = .017). LogMAR visual acuity was inversely correlated with SCP ( r = −0.88, P = .012) and DCP capillary densities ( r = −0.79, P = .048).
Conclusions
OCTA confirmed that global and focal capillary depletion is associated with MT1.
Macular telangiectasia type 1 (MT type 1) is a congenital or developmental vascular disorder affecting mostly male subjects and consisting of focal, exudative dilations of perifoveal retinal capillaries. It is usually unilateral, may extend beyond the macula, and therefore may be part of the larger spectrum of Coats disease. Historically, the condition has been termed “miliary aneurysms” by Leber, “idiopathic juxtafoveal telangiectasis” (group 1A-1B) by Gass and Blodi, “Type 1 aneurysmal telangiectasia” by Yannuzzi and associates, and finally MT type 1 in the recent classification by the MacTel Study Group.
In contrast with type 2 idiopathic macular telangiectasia or “MacTel2,” in which telangiectasias develop along with pathognomonic degenerative alterations of the retinal architecture linked to Müller cell depletion, MT type 1 is primarily a vascular disease, complicated by macular edema originating from the exudative telangiectasias. Fluorescein angiography (FA) allows the visualization of telangiectasias, but its ability to image the fine perifoveal capillaries at high resolution and to discriminate between the superficial and deep capillary plexuses is limited. Moreover, these lesions and the surrounding perifoveal capillaries are visible exclusively during the early frames of the sequence, since details are progressively submerged by dye diffusion from telangiectasias.
Optical coherence tomography angiography (OCTA) is a recent noninvasive imaging technology based on the detection of flows that provides a representation of the microvascular morphology. Absence of dye diffusion and higher resolution help to overcome limitations of FA to image the perifoveal capillary network. Moreover, the segmentation of volumes acquired by OCTA produces a separate visualization of the superficial and the deep retinal capillary plexuses. To date, several groups have employed OCTA to describe normal features of the macular microvasculature and to describe fine alterations involving both plexuses in several vascular disorders, such as retinal vein occlusion, diabetic retinopathy, and MT type 2. Furthermore, the recent adjunction of quantitative tools has expanded the ability of OCTA to investigate highly detailed abnormalities of the retinal microvasculature, such as vessel density or non-flow areas.
Imaging MT type 1 eyes with OCTA, we have described the vascular abnormalities (“telangiectasias”) and their vascular microenvironment. We used a quantitative analysis of OCTA images to compare the macular capillary density of MT type 1 eyes with fellow eyes and with healthy control eyes. We then correlated OCTA findings with FA imaging.
Methods
Subjects
This observational case series adhered to the tenets of the Declaration of Helsinki and Swiss federal regulations and was approved by the local Ethics Committee of the Swiss Department of Health (CER-VD no. 19/15). The study was conducted from June 1 to October 1, 2015, at Jules-Gonin Eye Hospital, Lausanne, Switzerland.
Medical records, optical coherence tomography (OCT), OCTA, FA, and indocyanine green angiography (ICGA) images from 7 consecutive subjects presenting with MT type 1 were retrospectively analyzed. The diagnosis of MT type 1 was based on the presence of unilateral, exudative telangiectasia affecting the macular area, without any clinical sign or history suggestive of vascular occlusion, posterior segment inflammation, or other causes of secondary macular telangiectasia. Exclusion criteria were age <18 years and spherical equivalent <−2 diopter (D) or >+2 D.
Twelve eyes from 12 healthy subjects imaged by OCTA were selected from the local OCTA database based on age and sex to serve as a control group.
Image Acquisition and Segmentation
The instrument used for en face OCT and OCTA images, Angiovue RTx 100, is based on the AngioVue Imaging System (Optovue, Inc, Fremont, California, USA) to obtain amplitude decorrelation angiography images. This instrument has an A-scan rate of 70 000 scans per second, using a light source centered on 840 nm and a bandwidth of 50 nm. Each OCTA volume contains 304 × 304 A-scans with 2 consecutive B-scans captured at each fixed position before proceeding to the next sampling location. Split-spectrum amplitude-decorrelation angiography (SSADA) was used to extract the OCT angiography information. Each OCTA volume is acquired in 3 seconds and 2 orthogonal OCTA volumes were acquired in order to perform motion correction to minimize motion artifacts arising from microsaccades and fixation changes. Angiography information displayed is the average of the decorrelation values when viewed perpendicularly through the thickness being evaluated.
In order to obtain comparable 3 × 3-mm OCTA scans between subjects, volumes were automatically segmented by the software provided by the manufacturer to provide images of the superficial plexus (3 μm below the inner limiting membrane to 16 μm below the outer border of the inner plexiform layer) and deep plexus (16–69 μm below the outer border of the inner plexiform layer). We controlled the correct segmentation for each patient before reporting the data.
The central macular thickness was measured on the Angiovue RTx 100 OCT in the central subfield of an Early Treatment Diabetic Retinopathy Study (ETDRS) grid centered on the fovea.
FA and ICGA were performed on Spectralis (Heidelberg Engineering, Heidelberg, Germany). Early frames (≤50 seconds after dye injection) were acquired with a 30-degree lens to visualize the macular microvasculature. Image quality was optimized using the “sharpen” tool of the Heidelberg Eye Explorer software (Version 1.9.10.0; Heidelberg Engineering). Angiograms were rotated and cropped to match the 3 × 3-mm OCTA scans centered on the fovea, using ImageJ (Version 1.50c4, Wayne Rasband; National Institutes of Health, Bethesda, Maryland, USA).
Identification of Microvascular Abnormalities
OCTA images from normal and MT type 1 subjects and FA and ICGA images from MT type 1 eyes were presented randomly to 3 masked independent observers (A.A., A.Da., F.B.C.) during separate sessions for each imaging modality. Lesions identified as microvascular abnormalities were labeled by each observer, and those labeled by 2 observers or more were retained. The interobserver reliability was assessed using a 2-way, mixed-model intraclass correlation coefficient based on the number of lesions identified per OCTA, FA, or ICGA image. Numbers of lesions in the deep and superficial capillary plexuses on OCTA were compared using a Wilcoxon signed-rank paired test.
Quantitative Determination of Capillary Vessel Density on Optical Coherence Tomography Angiography
The vascular densities of the capillary network in the superficial and deep plexuses were assessed by a custom semi-automated, intensity-based algorithm on Matlab (Mathworks, Natick, Massachusetts, USA).
First, original grayscale OCTA images were processed to detect pixels corresponding to vascular flow. In each image ( Figure 1 , Top and Bottom left), a region of interest (ROI) inside the foveal avascular zone that did not include dark areas corresponding to intraretinal cystoid cavities was manually outlined to define the background intensity of the intervascular retinal tissue. Using the threshold intensity I threshold = Mean (ROI pixels) + 2 × Standard Deviation (ROI pixels) , a binary transform of the OCTA image was performed, resulting in a “skeleton” of the vascular network ( Figure 1 , Top and Bottom middle left). In order to extract larger arterioles and venules that appear brighter owing to their higher flow, another binary transform was applied to the original OCTA images with a threshold set arbitrarily at 50% of the maximum pixel intensity value (122.5 = 0.5 × 255) ( Figure 1 , Top middle right).
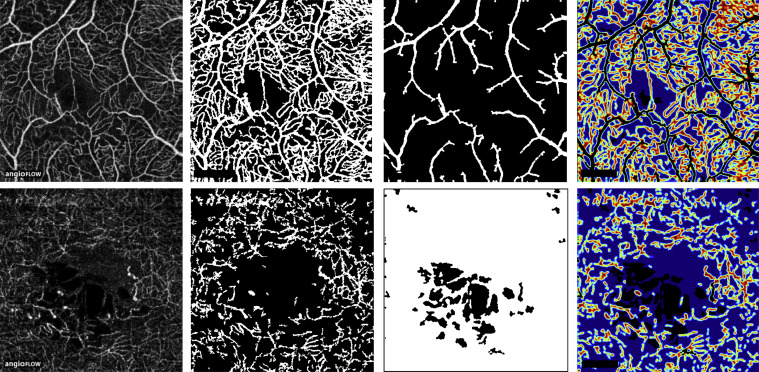
Second, pixels corresponding to the en face visualization of cystoid edema were identified on OCTA images. These areas appear slightly darker than the surrounding retinal tissue that is detected by the SSADA algorithm, most likely because of imperceptible retinal motion during acquisition originating from arterial pulsations, breathing, tremors, or microsaccades. Cystoid spaces were identified using a low threshold intensity value of 5% (12.5 = 0.05 × 255) ( Figure 1 , Bottom middle left).
The capillary network density was calculated over an area defined by subtracting from the total OCTA binary image the areas corresponding to larger vessels and cystoid edema. A 12 × 89-pixel rectangle located in the lower left corner and corresponding to the “Angioflow” sign embedded in native OCTA images was also subtracted. Over this final binary image, the total capillary network density was defined as the ratio of 1-pixels to total pixels. For graphical purposes, vessel density maps were produced by plotting the local mean intensity values in a sliding 5 × 5-pixel square area ( Figure 1 , Top and Bottom right).
Total capillary vessel densities in the deep and superficial plexuses were compared between affected and fellow eyes of MT type 1 subjects and control eyes from healthy subjects, using Mann-Whitney test and Wilcoxon signed-rank paired test (for fellow eyes). Correlations of capillary densities with multimodal imaging findings and visual acuity were performed using the Spearman rank correlation coefficients.
Quantitative Determination of Local Capillary Vessel Density Around Microvascular Lesions on Optical Coherence Tomography Angiography
In MT type 1 eyes a local capillary vessel density was calculated inside 100-μm-radius circles centered by each previously identified microvascular lesion, using a semi-automated algorithm on Matlab. These lesions were labeled manually on original OCTA images by a single operator (A.M.) and local capillary densities were computed automatically on the previously generated binary images where cystoid edema and larger vessels (and the “Angioflow” label) had been excluded. In each plexus, these local densities were computed around the microvascular lesions of both plexuses, whenever present.
In order to compare local densities to an analogous measurement reflecting the average density of OCTA images, a random distribution of 1000 local areas of similar size (100-μm-radius circles) was generated in each OCTA image. Areas overlapping a 100-μm-radius local region around a labeled microvascular lesion, another randomly generated area, or a central disc of 0.250 mm 2 (corresponding to the area of the foveal avascular zone reported by independent groups on OCTA ) were excluded ( Supplemental Figure 1 , available at AJO.com ). The distributions of perilesional and randomly distributed local densities were compared within each plexus by a Kruskal-Wallis test and a multiple comparison post-test.
Quantitative Estimation of Capillary Density on Fluorescein Angiography
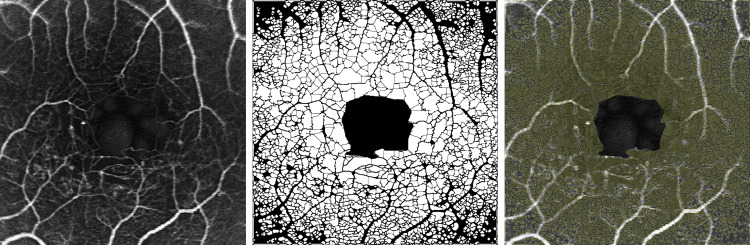
To provide an estimate of the capillary density on FA, a quantification of perifoveal intercapillary areas was performed on Matlab by adapting a method previously described in detail and applied to digital FA. Briefly, after manual outlining of the foveal avascular zone border and automated intensity-based skeletonization of the perifoveal microvasculature, intercapillary spaces were automatically detected and their areas were measured over the 3 × 3-mm angiograms, which corresponds approximately to the perifoveal 5-degree region reported in the original method ( Figure 2 ). For each angiogram, the mean perifoveal intercapillary area was calculated and was considered an inverse estimate of capillary density.
Statistical Analyses
Comparative tests and correlation analyses were performed on GraphPad Prism (Version 5.0f; GraphPad Software, San Diego, California, USA). Intraclass correlation coefficients, Kruskal-Wallis test, and post-tests were calculated on R software (Version 3.2.2; R Foundation for Statistical Computing, R Core Team, 2015, Vienna, Austria; http://www.R-project.org/ ) using the “irr” package (Version 0.84, 2012, M. Gamer, J. Lemon, I. Fellows, P. Singh, http://CRAN.R-project.org/package=irr ) and the “pgirmess” package (2015, Version 1.6.3, P. Giraudoux, http://CRAN.R-project.org/package=pgirmess ). Visual acuities were converted to the logarithm of the minimal angle of resolution (logMAR) for calculations. P values inferior to .05 were considered statistically significant.
Results
There was no difference between the 7 patients presenting MT type 1 and the 12 healthy controls in terms of age (57.1 ± 10.2 vs 57.8 ± 6.9 years, P >.99) and sex (all male subjects).
Identification of Microvascular Abnormalities
In MT type 1 eyes imaged by OCTA, microvascular abnormalities consisting of focal capillary dilations were detected exclusively in the deep capillary plexus by the 3 independent observers. There was a mean of 6.9 (range, 2–14) lesions in the deep plexus and 0 lesions in the superficial plexus ( P = .016) ( Table 1 ). Microvascular abnormalities were not observed in fellow eyes of MT type 1 subjects or in control healthy eyes.
| Case, Sex (Age, y) | OCTA – Superficial Capillary Plexus | OCTA – Deep Capillary Plexus | FA | ICGA | OCT | Best-Corrected Visual Acuity | |||||||
|---|---|---|---|---|---|---|---|---|---|---|---|---|---|
| Abnormal Microvascular Lesions, n | Observed Capillary Density of OCTA Image | Local Capillary Density in Random Regions | Observed Perilesional Capillary Density | Abnormal Microvascular Lesions, n | Observed Capillary Density of OCTA Image | Local Capillary Density in Random Regions | Observed Perilesional Capillary Density | Abnormal Microvascular Lesions, n | Mean Perifoveal Intercapillary Area, 10 −3 mm 2 | Abnormal Microvascular Lesions, n | Central Macular Thickness, μm | LogMAR (Snellen) | |
| 1, M (52) | 0 | 0.377 | 0.379 | 0.302 | 9 | 0.542 | 0.564 | 0.396 | 54 | 3.75 | 36 | 343 | +0.1 (20/25) |
| 2, M (51) | 0 | 0.380 | 0.374 | 0.291 | 5 | 0.318 | 0.332 | 0.0978 | 7 | 3.59 | 3 | 402 | +0.1 (20/25) |
| 3, M (68) | 0 | 0.378 | 0.390 | 0.280 | 14 | 0.527 | 0.549 | 0.412 | 32 | 3.64 | NA | 377 | 0.0 (20/20) |
| 4, M (56) | 0 | 0.212 | 0.204 | 0.162 | 2 | 0.230 | 0.234 | 0.153 | 6 | NA | 4 | 305 | +0.5 (20/63) |
| 5, M (54) | 0 | 0.306 | 0.309 | 0.372 | 7 | 0.206 | 0.214 | 0.281 | 12 | 3.79 | 17 | 304 | +0.2 (20/32) |
| 6, M (74) | 0 | 0.319 | 0.311 | 0.310 | 8 | 0.235 | 0.251 | 0.267 | 28 | 4.99 | NA | 342 | +0.2 (20/32) |
| 7, M (45) | 0 | 0.455 | 0.430 | 0.400 | 3 | 0.441 | 0.461 | 0.355 | 13 | 2.15 | 6 | 282 | 0.0 (20/20) |
| Mean ± SD | 0 | 0.347 ± 0.077 | 0.349 ± 0.149 | 0.302 ± 0.076 | 6.9 ± 4.1 | 0.357 ± 0.145 | 0.372 ± 0.232 | 0.280 ± 0.170 | 21.8 ± 17.4 | 3.65 ± 0.90 | 13.2 ± 13.9 | 326 ± 40 | +0.16 |
| P value | P = .021 a | P = .042 a | |||||||||||
On early-frame 3 × 3-mm FA images, a higher number of lesions was identified by the 3 independent observers (mean: 21.8, range, 6–54) than on OCTA ( P = .016). Early-frame confocal ICGA was obtained in 5 MT type 1 subjects. Lesions suggestive of telangiectasia were observed in all 5 subjects (mean: 13.2, range, 3–36), but their number was variably higher or lower than observed using OCTA or FA, with no difference in mean number ( P = .13 and P = .31, respectively).
The resulting intraclass correlation coefficient was 0.97 (95% confidence interval [CI]: 0.89–0.99) for OCTA, 0.96 (95% CI: 0.81–0.99) for FA, and 0.99 (95% CI: 0.98–1.00) for ICGA, indicating excellent consistency between the 3 independent observers, with a greater agreement for OCTA and ICGA than for FA. The detailed number of lesions identified by each observer is given in Supplemental Table 1 (Supplemental Material available at AJO.com ).
Qualitative Description of Capillary Network Changes
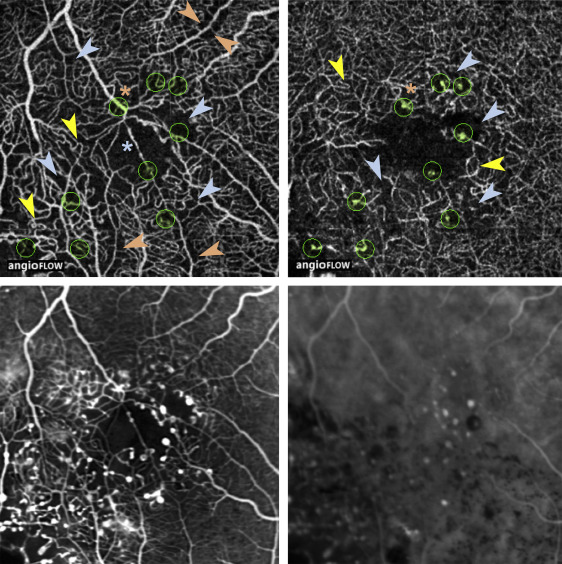
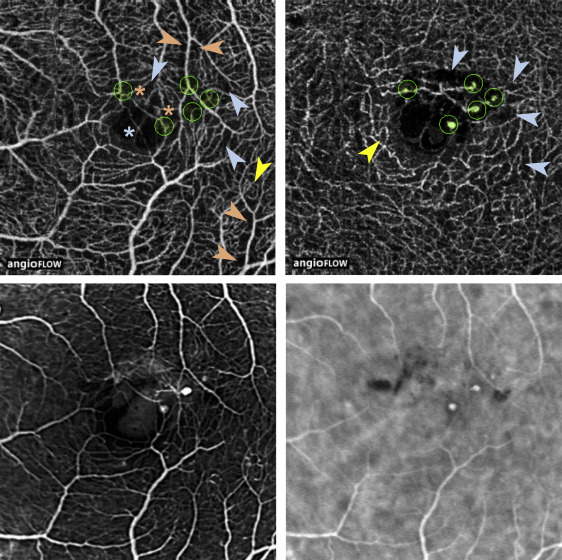
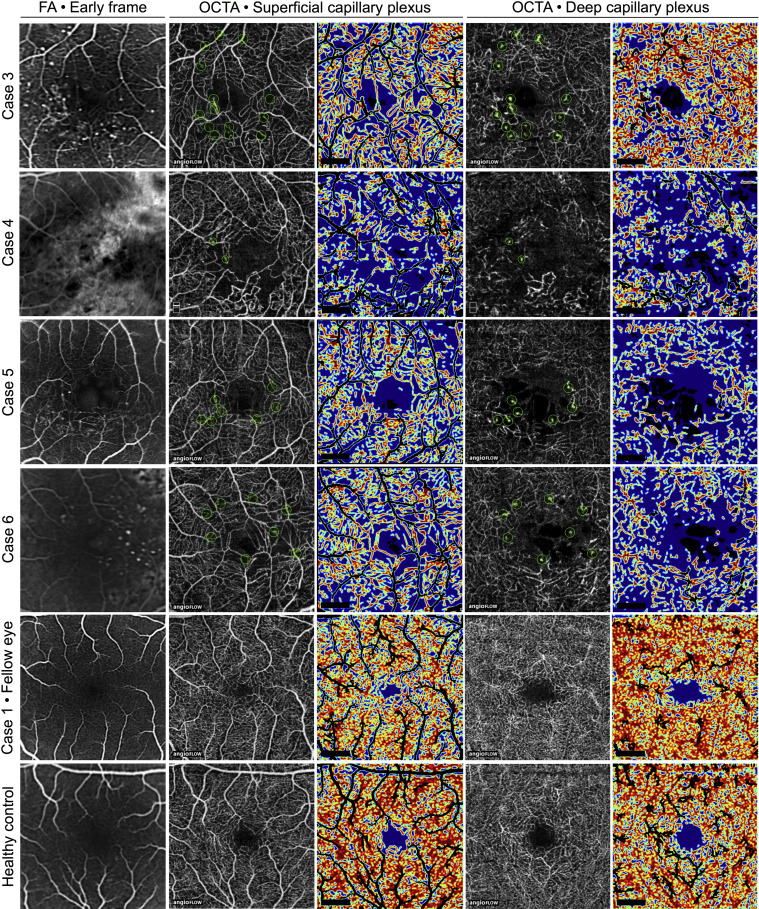
A qualitative visual assessment of OCTA images revealed a rarefied capillary network in the superficial and deep plexuses. Enlarged capillary-free areas along arterioles and exacerbated capillary loops were mostly observed in the superficial plexus ( Figures 3–5 ). In 5 out of 7 patients, a proportion of focal microvascular dilations suggestive of telangiectasias were located close to a termination or branching of a venule or arteriole (Cases 1–3 and 5–6, Figures 3–5 ). In addition, the foveal avascular zone morphology was severely altered in OCTA images of the superficial plexus, and showed an abnormal capillary vessel crossing linearly this area in 4 out of 7 eyes (Cases 1–3 and 6, Figures 3–5 ). Similar abnormal features were partly visible on early-frame FA, although it did not discriminate between superficial and deep plexus alterations ( Figures 3–5 ). In addition, the definition of the perifoveal microvasculature on early FA images was variable and qualitatively lower than on OCTA. This discrepancy was caused by leakage from telangiectasias (Case 3, Figure 5 ), fluorescein filling of cystoid edema cavities (Case 2, Figure 4 and Cases 5–6, Figure 5 ), or long-standing retinal pigment epithelium alterations secondary to retinal edema and subretinal exudates (Case 4, Figure 5 ).
Stay updated, free articles. Join our Telegram channel

Full access? Get Clinical Tree


