Purpose
To examine the usefulness of fluorescein angiography (FA) in identifying the macular center and diagnosis of zone in patients with retinopathy of prematurity (ROP).
Design
Validity and reliability analysis of diagnostic tools.
Methods
Thirty-two sets (16 color fundus photographs and 16 color fundus photographs paired with the corresponding FA images) of wide-angle retinal images obtained from 16 eyes of 8 infants with ROP were compiled on a secure web site. Nine ROP experts (3 pediatric ophthalmologists and 6 vitreoretinal surgeons) participated in the study. For each image set, experts identified the macular center and provided a diagnosis of zone. main outcome measures : (1) Sensitivity and specificity of zone diagnosis and (2) computer-facilitated diagnosis of zone, based on precise measurement of the macular center, optic disc center, and peripheral ROP.
Results
Computer-facilitated diagnosis of zone agreed with the expert’s diagnosis of zone in 28 (62%) of 45 cases using color fundus photographs and in 31 (69%) of 45 cases using FA images. Mean (95% confidence interval) sensitivity for detection of zone I by experts compared with a consensus reference standard diagnosis when interpreting the color fundus images alone versus interpreting the color fundus photographs and FA images was 47% (range, 35.3% to 59.3%) and 61.1% (range, 48.9% to 72.4%), respectively ( t (9) ≥ (2.063); P = .073).
Conclusions
There is a marginally significant difference in zone diagnosis when using color fundus photographs compared with using color fundus photographs and the corresponding FA images. There is inconsistency between traditional zone diagnosis (based on ophthalmoscopic examination and image review) compared with a computer-facilitated diagnosis of zone.
Retinopathy of prematurity (ROP) is a vascular proliferative disease of the retina that occurs in premature infants. Major advances in the diagnosis and treatment of ROP have occurred as a result of the classification criteria outlined by the Cryotherapy for ROP and Early Treatment for ROP studies. Both of these clinical trials demonstrated that the classification of zone in ROP is an important metric for prognosis and treatment.
Zone I of the retina is defined as a circle, the radius of which extends from the optic disc center to twice the distance from the optic disc center to the macular center. Based on this definition, identification of the macular center is critical to diagnose zone I disease properly. Diagnosis of zone is particularly important because zone I disease has a guarded prognosis and must be treated promptly. Previous studies have shown that variability may exist in identification of the macular center, which may translate to differences in the diagnosis of zone.
Fluorescein angiography (FA) is an imaging method that may provide useful information regarding the retinal vasculature in the premature retina. Although a number of investigators have described FA changes in ROP, there is no consensus among vitreoretinal specialists and pediatric ophthalmologists regarding the proper use of FA in ROP. The current literature is limited to descriptive case series on FA findings in ROP and other pediatric vitreoretinal disorders. These initial reports suggest that FA may allow more objective assessment of disease zone. There are currently no studies, to our knowledge, on the direct comparison of expert diagnosis of ROP made from FA findings versus expert diagnosis of ROP made from color fundus photographs in patients with ROP. The purposes of this study were (1) to examine and compare how color fundus photographs and FA influence the identification of the macular center in ROP and (2) to evaluate the influence of FA on diagnosis of zone in ROP.
Methods
This study was approved as a prospective study by the Institutional Review Board at Weill Cornell Medical College. Informed consent was obtained from all study participants before participation, and waiver of consent was obtained for use of de-identified retinal images. This study was conducted in accordance with Health Insurance Portability and Accountability Act guidelines.
Image Acquisition
Wide-angle images of the posterior retina and corresponding FA images were captured bilaterally from 8 infants with ROP (16 eyes) using a wide-angle camera (RetCam; Clarity Medical Systems, Pleasanton, California, USA). Images were obtained from infants between 33 and 44 weeks postmenstrual age. For acquisition of FAs, 4 (50%) of 8 infants were imaged in the neonatal intensive care unit without intubation or sedation, whereas the remaining 4 infants (50%) were imaged in the operating room under sedation, but were not intubated.
Consensus Reference Standard Diagnosis of Zone
For each image set, a reference standard ROP diagnosis was established. This was carried out by combining the clinical diagnosis and the image-based diagnosis by multiple experts, as follows. (1) The clinical diagnosis (based on complete ophthalmic examination by an experienced ROP examiner) was recorded. (2) Each set of retinal images was interpreted by 3 experienced readers (R.V.P.C., M.F.C., S.O.) using a web-based system. (3) The diagnosis that was selected by most image readers (zone, stage, plus disease, overall disease category) then was compared with the clinical diagnosis. When these 2 diagnoses were the same, it was defined as the reference standard diagnosis. When the diagnoses were different, all of the data were reviewed by 2 of the investigators (R.V.P.C., M.F.C.) along with 2 study coordinators (S.O., K.E.J.), and a consensus reference standard was determined. This consensus reference standard then was used for the purposes of this current study.
Study Experts
Study experts were defined as board certified practicing pediatric ophthalmologists or vitreoretinal specialists who met at least 1 of the following criteria: having been a principal investigator or certified investigator for the Cryotherapy for ROP or Early Treatment for ROP studies or having published at least 2 peer-reviewed ROP articles. Furthermore, all experts in this study routinely evaluate and treat children with ROP.
Study Design
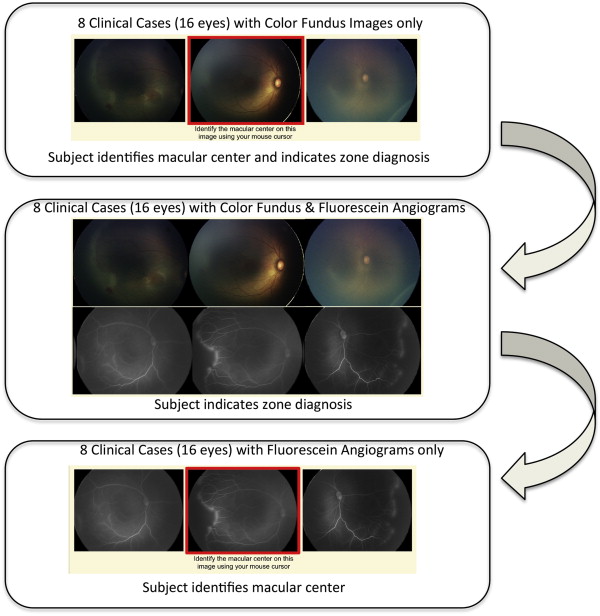
Study experts were directed to a secure website developed by the authors (S.N.P., M.A.K., M.F.C., R.V.P.C.) that displayed a set of 3 retinal images of each eye (temporal, posterior, nasal). For each image set, certain baseline demographic information from the time of imaging was provided, for example, the birth weight, gestational age, and postmenstrual age. Experts first were directed to use their mouse cursor to identify the macular center on the posterior retinal photograph. Responses were recorded as (x, y) coordinates of the image. Color fundus photographs alone were displayed in sequential order and then FA images with corresponding color fundus photographs were displayed in the same order. After selecting the macular center, experts then were asked what zone (I, II, II-posterior, III) they would classify each set of retinal images ( Figure 1 ). For each color fundus photograph and FA image, experts were asked to rate the image quality for identification of the macular center (adequate, possibly adequate, not adequate) and their confidence in identifying the macular center (confident, somewhat confident, not confident).
Computer-Facilitated Diagnosis of Zone
For every response to each image, the linear distance from the optic disc center to the marked macular center was measured. A computer-facilitated diagnosis of zone was determined for images in which peripheral ROP was visible. In these images, the closest linear distance from the optic disc center to the peripheral disease was measured. The location of the optic disc center and peripheral disease was determined by the study authors (R.V.P.C., M.F.C.). The value, determined for each image as the distance from the macular center to the optic disc center, was the mean distance calculated by using the identification of the macular center by all study experts. To account for differences in magnification of the images, all distances were standardized by multiplying 1.05/(measured optic disc width in millimeters of each image). This standardization is based on prior published data showing the mean optic disc width in premature infants to be 1.05 mm. Based on these arithmetic changes in linear distance, the computer-facilitated diagnosis of zone was assigned to either zone I or II.
Statistical Analysis
All data were analyzed using SPSS software version 22 (SPSS, Inc, Chicago, Illinois, USA). For each eye, a paired sample t test was performed to determine whether the mean difference in linear distance between paired color fundus photograph and FA image was significantly different from 0. The variances of each method in the identification of the macular center were compared using a nonparametric Wilcoxon signed-rank test.
Using the consensus reference standard diagnosis, sensitivity and specificity were computed for each expert for the diagnosis of zone I and zone II. Significant differences in sensitivity or specificity between the imaging methods were assessed using paired sample t tests.
The mean unweighted κ statistic was used for analysis of agreement on zone disease diagnosis. An accepted scale was used to interpret results as follows: 0 to 0.20 indicated slight agreement, 0.21 to 0.40 indicated fair agreement, 0.41 to 0.60 indicated moderate agreement, 0.61 to 0.80 indicated substantial agreement, and 0.81 to 1.00 indicated near perfect agreement.
Results
Study Experts
Among the 9 experts who consented to participate in the study, 6 (67%) were retina specialists and 3 (33%) were pediatric ophthalmologists. The experts have been practicing ophthalmology for a mean of 19 years (standard deviation, 8.6 years; range, 10 to 33 years). When asked if FA is safe in neonates and infants, all (9/9) responded “yes.” Each expert graded 32 images (16 color fundus photographs, 16 FA images) from 16 eyes, for a total of 288 readings of the macular center. Figure 2 reveals examples of concordance and discordance among experts in the identification of the macular center on color fundus photographs and FA images. In 3 (20%) of 15 eyes, there was a significant difference in intergrader agreement of macular center identification between the color fundus photograph and corresponding FA image: t (9) ≥ |4.807| ( P < .001; Table 1 ). There were no statistically significant differences between the variances of each method with regard to the identification of the macular center ( P = .75).
| Case and Eye | Distance to Macular Center on Color Fundus Photography | Distance to Macular Center on FA | P Value a |
|---|---|---|---|
| 1 | |||
| Right | 5.28 (1.20) | 4.96 (0.57) | .203 |
| Left | 5.74 (0.91) | 6.27 (0.69) | .355 |
| 2 | |||
| Right | 3.07 (0.23) | 3.44 (0.34) | .121 |
| Left | 3.54 (0.46) | 3.40 (0.42) | .567 |
| 3 | |||
| Right | 3.58 (0.46) | 4.12 (0.44) | .240 |
| Left | 3.29 (0.38) | 3.38 (0.32) | .720 |
| 4 | |||
| Right | 3.70 (0.58) | 2.90 (0.35) | .001 |
| Left | 3.94 (0.87) | 2.75 (0.54) | <.001 |
| 5 | |||
| Right | 4.10 (0.28) | 3.37 (0.24) | .092 |
| Left | 4.19 (0.48) | 3.16 (0.29) | <.001 |
| 6 | |||
| Right | 3.82 (0.12) | 3.90 (0.61) | .750 |
| Left | 3.24 (0.33) | 3.75 (0.68) | .073 |
| 7 | |||
| Right | 4.29 (0.07) | 4.29 (1.10) | 1.000 |
| Left | NA | NA | NA |
| 8 | |||
| Right | 3.54 (0.14) | 3.21 (0.35) | .189 |
| Left | 3.58 (0.13) | 3.68 (0.13) | .690 |
Computer-Facilitated Diagnosis of Zone
Ten (33%) of 30 digital images (5 color fundus photographs, 5 FA images) had both a clearly visible optic nerve and peripheral ROP present ( Table 2 ). The computer-facilitated diagnosis of zone based on an expert’s identification of the macular center agreed with that expert’s diagnosis of zone in 28 (62%) of 45 cases using color fundus photographs and in 31 (69%) of 45 cases using FA.
| Case No. and Eye by Imaging Method | Computer Facilitated Diagnosis of Zone a | Consensus Diagnosis of Zone b | Expert Responses for Zone Diagnosis (n = 9) | |
|---|---|---|---|---|
| Zone I | Zone II | |||
| Color photography | ||||
| 1 | ||||
| Right eye | Zone II | Zone I | 3 | 6 |
| Left eye | Zone I | Zone I | 4 | 5 |
| 3, Right eye | Zone I | Zone I | 5 | 4 |
| 2, Left eye | Zone II | Zone I | 5 | 4 |
| 4, Right eye | Zone I | Zone I | 7 | 2 |
| Fluorescein angiography | ||||
| 1 | ||||
| Right eye | Zone II | Zone I | 1 | 8 |
| Left eye | Zone I | Zone I | 5 | 4 |
| 3 | ||||
| Right eye | Zone I | Zone I | 6 | 3 |
| Left eye | Zone I | Zone I | 7 | 2 |
| 6, Right eye | Zone II | Zone II | 0 | 9 |
Stay updated, free articles. Join our Telegram channel

Full access? Get Clinical Tree


