Purpose
To investigate a potential circadian fluctuation of the choroidal volume in healthy adults by enhanced depth imaging (EDI) via spectral-domain optical coherence tomography (SD OCT).
Design
Prospective observational case series.
Methods
Thirty healthy eyes of 15 healthy subjects with a median age of 26 years (range 22-55) underwent EDI SD OCT scans for macular choroidal volume measurement every 3 hours within a 24-hour period at a single tertiary center. The mean ocular perfusion pressure was calculated for each eye at each of the 8 time points as 2/3(mean arterial pressure–intraocular pressure [IOP]). The circadian fluctuation of the macular choroidal volume as well as the association with axial length, mean ocular perfusion pressure, or IOP was assessed using a linear mixed model.
Results
Macular choroidal volume showed a significant circadian fluctuation ( P < .05) and was lowest at midday (mean ± SD, 10.14 ± 2.62 mm 3 ) and highest at 3 AM (mean ± SD, 10.66 ± 2.70 mm 3 ). Of all factors tested, only mean ocular perfusion pressure showed a significant association with macular choroidal volume fluctuation ( P = .016).
Conclusions
Macular choroidal volume shows a significant circadian pattern with higher values at night and lower values during the day in young adults. Besides time, mean ocular perfusion pressure is significantly associated with this fluctuation.
The choroid is a highly vascularized layer of the eye that, among a plethora of functions, supplies nutrients and oxygen for the retinal pigment epithelium as well as the photoreceptors, maintains a stable temperature in the outer retina, and removes metabolic waste from phototransduction. Enhanced depth high-resolution optical coherence tomography (enhanced depth imaging spectral-domain optical coherence tomography; EDI SD OCT) provides detailed in vivo visualization of the choroid and enables unprecedentedly exact volume measurements of the choroid at the posterior pole. This increased visibility of the choroid promises new insights in ocular diseases. In the evaluation of the choroid, however, physiologic fluctuations need to be accounted for. Recently, circadian changes in subfoveal choroidal thickness have been quantified.
While subfoveal choroidal thickness is fast and easy to measure, macular choroidal volume analysis delivers more robust measurements by averaging the choroidal thickness of thousands of A-scans. Further, single measurement of choroidal thickness might fail to fully represent a diffuse choroidal involvement in diseases such as uveitis, age-related macular degeneration, high myopia, and central serous chorioretinopathy. Looking at its 3-dimensional structure allows for the assessment of choroidal architecture from any arbitrary direction and measurement of relation to surrounding tissue. The current drawbacks of prolonged measurement and tedious manual segmentation of the choroidal boundaries are likely to diminish significantly as OCT hardware and software improves and faster OCTs become readily available in routine clinical practice.
The purpose of the present study was thus to investigate a potential circadian fluctuation of the macular choroidal volume in healthy adults by EDI SD OCT within a 24-hour timeframe.
Methods
Subjects
Fifteen healthy white volunteers (7 female and 8 male) participated in this prospective pilot study at the Department of Ophthalmology of the Medical University of Graz, Austria. All subjects had a corrected visual acuity equal or superior to 1.0 Snellen equivalent (emmetropia or less than 3 diopters myopia or hypermetropia). Exclusion criteria were any ocular pathology, including history of ocular surgery or trauma, use of ocular medication, elevated intraocular pressure (IOP), or significant vitreous floaters. Further exclusion criteria were current use of any systemic medication, history of cardiovascular disease, diabetes mellitus, or hypertension. The procedures followed the tenets of the Declaration of Helsinki and informed written consent was obtained from all subjects before the study procedures. The institutional review board of the Medical University of Graz prospectively approved all study procedures. This trial is registered online at http://www.clinicaltrials.gov (ID NCT02223546 ).
Examination
Screening procedures included review of medical history and concomitant medication, and assessment of systemic blood pressure. Further, best-corrected visual acuity testing, slit-lamp biomicroscopy, measurement of IOP (Goldmann tonometer AT 900; Haag-Streit AG, Koeniz, Switzerland), funduscopy, and axial length measurement (IOLMaster; Carl Zeiss Meditec, Jena, Germany) were performed. Study examinations took place every 3 hours within a 24-hour timeframe, starting at 9 AM. Between 10 PM and 6 AM subjects slept in a room next to the OCT in their preferred recumbent sleeping position. Measurements of all parameters were taken in the sitting position. In each subject both eyes were measured, starting with the right eye. The study measurements were performed in the following order: choroidal volume scanning of the macula via EDI SD OCT (see below), measurement of IOP, systolic (SBP) and diastolic blood pressure (DBP) evaluation, and heart rate measurement. For each individual the mean arterial pressure (MAP) as well as the mean ocular perfusion pressure were calculated at each time point by the following formulas as described previously: MAP is defined as DBP + 1/3(SBP–DBP); mean ocular perfusion pressure results from 2/3(MAP–IOP).
Additionally, to exclude a potential bias for the nightly measurements owing to the position change from the recumbent sleeping to the sitting measuring position, we measured the choroidal volume and blood pressure parameters of 10 healthy subjects before and after this transition in a separate experiment. In short, after at least 2 hours of normal nighttime sleep a choroidal volume scan of both eyes was taken. The first scan was taken in a recumbent position. For this purpose the OCT device was dismounted from its stand and the subjects remained in their recumbent position throughout the procedure. Immediately afterward, the subject was seated and the choroidal volume was measured a second time with the OCT mounted to its stand. Subsequently, a third scan, again in sitting position, was taken after a simulated switch to another room by having the subject walk 20 meters. The inclusion and exclusion criteria of the main experiment applied in this group as well. All scans adhered to the choroidal volume scanning protocol described hereafter.
Macular Choroidal Volume Scanning
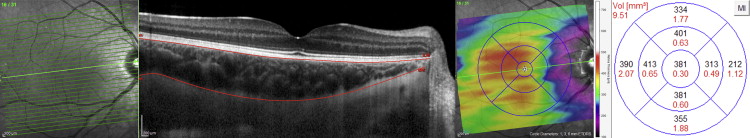
The choroidal volume scanning and analysis protocol used in this study was published in detail elsewhere. In short, an array of 31 high-resolution B-scans centered at the fovea was obtained using the enhanced depth imaging mode of a spectral-domain OCT device (Spectralis; Heidelberg Engineering, Heidelberg, Germany). Scans measured 9.3 mm in length and were horizontally spaced 240 μm apart, resulting in a 30 × 25-degree macular cube. To improve image quality a minimum of 25 frames were averaged per scan using the built-in eye tracking software (TruTrack; Heidelberg Engineering).
Two retinal specialists manually segmented the choroids of the scans, as previously described, and the built-in software calculated a 6-mm volume grid according to the Early Treatment of Diabetic Retinopathy Study (ETDRS). Each cube scan was given a code and was randomly assigned to 1 of the 2 readers, who then segmented the choroid and returned the file for data entry. Thus, data acquisition, segmentation, and data entry were separated to maximize the masking to the time point of examination when creating the macular choroidal volume map. An example of the resulting segmentation is shown in Figure 1 .
Additionally, to elucidate where most of the change in volume took place we compared the ratio of the Haller to Sattler layer within the scans of the maximal choroidal volume and minimal choroidal volume of each of the 30 eyes.
Therefore, a single grader sub-segmented the maximal and minimal choroidal volume scan of each eye. In accordance with the panel for the international nomenclature for optical coherence tomography, the Haller and Sattler layers were defined by large outer oval vascular profiles and by small oval vascular profiles in the inner choroid, respectively. Since the choriocapillaris and Sattler layer are poorly discriminable on OCT we comprised both in a Sattler layer/choriocapillaris complex. Subsequently the ratio between the Haller and Sattler layer volume was calculated for the time point of maximal and minimal choroidal volume.
Statistical Analysis
The main outcome was the macular choroidal volume. Secondary outcome measures were subfoveal choroidal thickness, the quotient of the Haller and Sattler layer volume, IOP, and mean ocular perfusion pressure. The descriptive statistic for the outcomes choroidal volume and subfoveal choroidal thickness is presented for 30 eyes of the 15 subjects. We analyzed the circadian fluctuation of the choroidal volume using a linear mixed model with a random intercept. This model type takes into account the clustered structure of the data, with 8 repeated observations per eye, and 2 eyes belonging to the same patient. As our study was an exploratory analysis, no power calculation was performed. First, the time trend of the circadian fluctuation of the choroidal volume using orthogonal polynomials was examined and a cubic time trend was fitted. Using this model we then investigated separately the influence of the variables axial length, IOP, and mean ocular perfusion pressure on choroidal volume. Additionally, we calculated the Akaike information criterion (AIC) as a measure of the relative quality of the models. Wilcoxon signed rank test was used to analyze the ratio between the Haller and Sattler layer volume. A 1-way repeated measurement analysis of variance (ANOVA) was used to analyze choroidal volume data regarding the change from recumbent to sitting measurement position. A P value < .05 was considered to be statistically significant. Unless otherwise specified, data are shown as mean ± standard deviation. All analyses were performed using the statistical software R (version 2.15.3) with the nlme package (version 3.1-108) to carry out multilevel modeling.
Results
Demographics
A total of 30 eyes of 15 white subjects (7 female and 8 male) with a median age of 26 years (range 22-55) were included. The mean axial length of the globe was 23.82 ± 1.08 mm (range 21.98-25.64 mm). The median age of the 10 subjects from the second experiment (6 female, 4 male) was 30.5 years (range 27-40). All subjects completed the EDI SD OCT measurements. In all cases the choroidal scleral interface could be visualized with the described enhanced depth imaging regimen and after manual choroidal segmentation the built-in software successfully constructed a 3-dimensional choroidal map.
Macular Choroidal Volume
The mean daily average macular choroidal volume of the 30 eyes was 10.33 ± 2.53 mm 3 (range 6.57-16.81 mm 3 ). Comparing the mean choroidal volume for each time point, choroidal volume was lowest at midday (10.14 ± 2.62 mm 3 ) and highest at 3 AM (10.66 ± 2.70 mm 3 ). Figure 2 shows the circadian changes in choroidal volume of the 30 eyes. A similar pattern was observable in both eyes and each sub-segmentation of the ETDRS grid (central, nasal, temporal, superior, and inferior; data not shown).
In 24 of 30 eyes highest macular choroidal volume was found between midnight and 6 AM; 19 of 30 eyes had their lowest choroidal volume between midday and 6 PM. Minima and maxima of fellow eyes corresponded temporally (that is, within 2 consecutive measurements) in 7 and 11 of the 15 patients, respectively.
The average maximal difference between observed choroidal volume per eye (that is, the mean of the differences between the lowest and the highest value in each eye) was 0.98 mm 3 (range 0.38-2.31 mm 3 ) and in percentage median 9.2% (interquartile range 6.9%-12.0%; range 4.3%-15.9%). The circadian fluctuation of the choroidal volume showed a statistically significant cubic time trend ( P < .01; Table ). Besides time, from all models tested, only mean ocular perfusion pressure had a significant association with choroidal volume ( P = .016). Models considering either axial length or IOP were not significantly associated with change in choroidal volume ( P > .05). The best model fit was observed for the model that included mean ocular perfusion pressure (AIC = 282.3) and is shown in Figure 3 . All models showed that the total variance is dominated by the variance between patients. There is little variation in the observation between the eyes within the same patient compared to the total random variation.
| Model | Log(L) | P | AIC | Fixed-Effect Parameters – Estimates (SE) a | Random Effects – Estimates | Residuals σ 2 | |||||
|---|---|---|---|---|---|---|---|---|---|---|---|
| Intercept | Time | Time 2 | Time 3 | Variable | σ 2 intercept:patient | σ 2 intercept:eye | |||||
| Time trend | −141.4 | 7 | 296.8 | 10.33 d (0.66) | 2.70 d (0.33) | 0.94 c (0.33) | -0.90 c (0.33) | – | 6.47 | 0.12 | 0.11 |
| MOPP | −133.2 | 8 | 282.3 | 11.03 d (0.72) | 2.57 d (0.33) | 0.68 b (0.33) | -1.31 d (0.35) | -0.01 b (0.01) | 6.65 | 0.12 | 0.10 |
| IOP | −134.8 | 8 | 285.6 | 10.48 d (0.68) | 2.43 d (0.37) | 0.81 b (0.32) | -0.91 c (0.33) | -0.01 (0.01) | 6.52 | 0.12 | 0.10 |
| Axial length | −141.0 | 8 | 298.0 | 2.82 (11.71) | 2.70 d (0.33) | 0.94 c (0.33) | -0.90 c (0.33) | 0.32 (0.49) | 6.93 | 0.11 | 0.11 |
Stay updated, free articles. Join our Telegram channel

Full access? Get Clinical Tree


