Purpose
To evaluate choroidal thickness in young adults using enhanced-depth imaging spectral-domain optical coherence tomography and to describe volume differences in all the areas defined in the Early Treatment Diabetic Retinopathy Study.
Design
Prospective clinical study.
Methods
In 95 healthy young (23.8 ± 3.2 years) adult volunteers, 95 eyes were prospectively enrolled. Manual choroidal segmentation on a 25-raster horizontal scan protocol was performed. The measurements of the 9 subfields defined by the Early Treatment Diabetic Retinopathy Study were evaluated.
Results
Mean subfoveal choroidal thickness was 345.67 ± 81.80 μm and mean total choroidal volume was 8.99 ± 1.88 mm 3 . Choroidal thickness and volume were higher in the superior and temporal areas than in the inferior and nasal sectors of the same diameter, respectively. Strong correlations between subfoveal choroidal thickness and axial length and myopic refractive error were obtained (r = −0.649, P < 0.001, and r = 0.473, P < 0.001, respectively). Emmetropic eyes tended to have thicker subfoveal choroidal thickness (381.94 ± 79.88 μm vs 307.04 ± 64.91 μm) and higher total choroidal volume than myopic eyes (9.80 ± 1.87 mm 3 vs 8.14 ± 1.48 mm 3 ). The estimation of the variation in the subfoveal choroidal thickness in relationship to the axial length was −43.84 μm/mm. In the myopic group, the variation in the subfoveal choroidal thickness with the myopic refractive error was −10.45 μm per diopter.
Conclusions
This study establishes for the first time a normal database for choroidal thickness and volume in young adults. Axial length, and myopic ammetropy are highly associated with choroidal parameters in healthy subjects. Enhanced-depth imaging spectral-domain optical coherence tomography exhibited a high degree of intraobserver and interobserver repeatability.
The development of optical coherence tomography (OCT) technology has revolutionized the diagnostic, monitoring and therapeutic approaches to many retinal diseases. Spectral-domain OCT offers improved axial resolution (3 μm); by providing 19 000 A-scans per second, it shortens examination times, reducing the eye exposure as well as artifacts. The latest development in OCT technology, swept-source longer wavelength OCT, has a longer band light source than does the conventional instrumentation (1 μm of band light source), providing higher penetration through the retinal pigment epithelium (RPE) and allowing for better visualization of the choroid; however, at the present time, swept-source OCT use is limited to research.
The role of the choroid in a number of diseases, including central serous chorioretinopathy, high myopia, age-related macular degeneration, choroidal melanoma, and polypoidal choroidal vasculopathy, emphasizes the importance of understanding choroidal structure in ocular disease. Indocyanine green has been the best tool for studying choroidal vasculature; however, it does not provide a quantitative evaluation of the layer. Other imaging methods such as echography aid in evaluating the layer, and magnetic resonance imaging could provide limited imaging of it. Until recently, accurate morphologic study of the choroid using spectral-domain OCT was not possible owing to its posterior location and the scattering of light caused by the pigmented RPE cells. Both the recently introduced EDI system by Spaide and associates and swept-souce OCT provide higher penetration through the RPE, allowing for accurate in vivo deep choroidal imaging and measurement .
Changes in choroidal thickness have been described as being related to smoking, changes in arterial pressure, daylight/daytime, age, and axial length. It is important to have a normative base of choroidal thickness at differing ages to compare values with aging. Measurement of choroidal thickness in young adults is required to create this normative base. Choroidal thickness is greater in children than in adults at various ages because choroidal layer thickness diminishes with age, mainly in the temporal area. Although young adult choroidal thickness has been described in previous work using swept-souce OCT, these studies focused only on thickness at the horizontal and vertical levels that cut the fovea because automated choroidal segmentation software was unavailable, and measurement could take place only manually. Measurements of a small number of points can be influenced by local changes in choroidal thickness or irregularities in the choroidoscleral border.
In the present study, we evaluated choroidal thickness and 3-dimensional reconstruction in young subjects using EDI spectral-domain OCT to describe volume differences among all of the defined areas of the Early Treatment Diabetic Retinopathy Study (ETDRS).
Material and Methods
This prospective study was performed between February 1 and June 30, 2013, with healthy volunteers 19–32 years of age. The subjects were recruited from students of the optometry school and evaluated in this cross-sectional observational study at the Ophthalmology Department of the Lozano Blesa University Hospital, Zaragoza, Spain. All of the subjects referred to themselves as healthy. Written consent was obtained from each participant before enrollment. The study was performed in accordance with the tenets of the Declaration of Helsinki.
The inclusion criteria were best-corrected visual acuity (BCVA) over 0.8 on the Snellen scale; refractive spherical equivalent ≤12.0 diopters (D); or astigmatism <3D with no retinal or optic disc alteration as determined by mydriatic funduscopic examination. Exclusion criteria were history of amblyopia, strabismus, systemic diseases (no findings during medical examination prior to university enrollment) or intraocular pressure measured by Goldmann tonometry as being above 21 mm Hg.
All subjects underwent a complete ophthalmologic examination, including BCVA, assessment of ocular motility and alignment and evaluation of the anterior and posterior poles. A biometer (IOLMaster; Carl Zeiss Meditec, Dublin, CA) was used to explore each subject’s axial length; an open-view autorefractometer (autokerato/refractometer WAM-5500, Grand Seiko, Hiroshima, Japan) and an aberrometer (Wavefront Supported Custom Ablation; Carl Zeiss Meditec, Jena, Germany) were used to establish each participant’s refractive status. The average of 3 measurements was recorded without pupillary dilation. Then, spectral-domain OCT was performed using Spectralis OCT (Spectralis; Heidelberg Engineering, Heidelberg, Germany). Each eye was considered separately, and only 1 random eye from each subject was included in the study.
All subjects underwent choroidal segmentation on a 25-raster horizontal scan protocol. Volume fast macular scans and 3 additional scans with the same protocol using EDI were performed. Each subject’s refractive errors were corrected to improve retinal image quality. The peripapillary retinal nerve fiber layer was also evaluated to identify any optic nerve pathology. This sequence was performed using TruTrack eye-tracking technology (Heidelberg Engineering), which recognizes, locks onto and follows the patient’s retina during scanning; the tracker also automatically takes follow-up scans to ensure accurate monitoring of disease progression. The Spectralis software version used was 5.6b. The quality of the scans was assessed prior to the analysis, and poor-quality scans were rejected; only images with a score higher than 28 dB over 40 dB were used. All scans were performed by the same experienced operator. Between scan acquisitions, there was a time delay, and subject position and focus were randomly disrupted, meaning that alignment parameters had to be newly adjusted at the start of each image acquisition. No manual correction was applied to the OCT output. An internal fixation target was used because it has previously been shown to give the highest reproducibility.
We selected the retinal thickness map analysis protocol to display the numeric averages of the measurements for each of the 9 subfields defined by the ETDRS, with 3 concentric circles defining 9 macular sectors (single 1 mm central area and inner and outer rings, 3 and 6 mm respectively, were divided in four quadrants, nasal, temporal, superior and inferior to the fovea). The average of all points within the inner circle of 1 mm radius was defined as the subfoveal choroidal thickness. All 9 areas were considered for analysis.
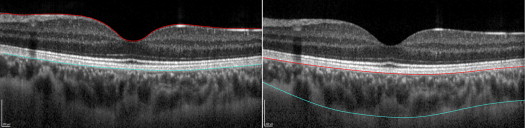
To assess choroidal thickness, segmentation lines were manually changed ( Figure 1 ). The internal limiting membrane layer was moved to the outer part of the RPE level, and the Bruch membrane segmentation line was moved to the division between the choroid and the sclera. Moving both segmentation lines limits the choroid, and the values that appeared in the described macular areas were the true choroidal thickness values. Segmentation was performed by the same observer, and 1 of the 3 choroidal maps was also segmented by another observer to ensure interobserver reproducibility.
Statistical analyses were conducted using the Statistical Package for the Social Sciences (SPSS 20.0, SPSS, Chicago, Illinois, USA). The Kolmogorov-Smirnov test was used to assess the normal distribution of the results, and paired t tests were subsequently performed to compare means among areas. To calculate the degree of correlation among the study values, Pearson correlation coefficients were calculated. Choroidal thicknesses were compared among axial lengths, sex and age using the Student t test. Choroidal values for the 9 areas defined in the ETDRS were compared to assess the differences in the various areas. Values of P < 0.05 were considered to be indicative of statistically significant differences.
To assess the repeatability of repeated measurements, intraclass correlation coefficients (ICCs) were calculated. The ICC was defined as the ratio of the between-subject variance and the sum of the pooled within-subject (S w ) and between-subject variances. The study’s ICC interpretation considered values between 0 and 0.2 to have slight reliability and those between 0.21 and 0.4 to have fair reliability. Reliability was moderate if the ICC value was between 0.41 and 0.6, substantial if the ICC value was between 0.61 and 0.8, and nearly perfect when the ICC value exceeded 0.81. The coefficient of variation (COV) was calculated as the S w divided by the mean of the measurements and expressed as a percentage; the lower the COV, the higher the repeatability. The Bland-Altman method was used to analyze the intraobserver and interobserver agreement among measurements and between observers, respectively.
Results
Choroidal Thickness and Volume
The choroidal thickness and volume values shown on the ETDRS grid were evaluated in a total of 95 healthy eyes, as shown in Figure 2 . The choroidal limits were delimited without difficulty in all subjects except 1; 1 eye was excluded because of ocular traumatism during childhood involving surgical aphakia and retinal detachment. A total of 95 measured eyes were used for our study, of which 30 were male (31.58%) and 65 were female (68.42%). The mean age was 23.8 ± 3.2years (range, 19–32). All studied eyes had a BCVA of 0.8 or better, as was set in the inclusion criteria, and all of the subjects were white. Mean spherical equivalent (D) was −1.50 ± 2.32 D (range, −11.25 D to 0 D), and mean axial length was 24.04 ± 1.21 mm (range, 22.05–28.72 mm). Mean choroidal thicknesses and volumes in the different areas are displayed in Table 1 . Mean subfoveal choroidal thickness was 345.67 ± 81.80 μm, and mean volume in the same area was 0.27 ± 0.06 mm 3 . Choroidal thickness and volume were higher in the superior and temporal areas (3 and 6 mm) compared with the inferior and nasal sectors of the same diameter. Table 2 shows statistically significant differences ( P < 0.05) among these zones.


